Structural and Luminescence Properties of (Ba, Ca) Sio4: Dy3+ Phosphors for White Light Applications
In this report monocrystalline white-emitting phosphors Ba1.3Ca0.7SiO4: 0.03Dy3+ were synthesized by a low temperature solution combustion method. The thermal, structural parameters and optical properties of the obtained phosphors were characterized by TGA, FTIR, XRD, SEM, EDS, TL, and PL. The mass of the Ba1.3Ca0.7SiO4 (host) sample as a function of temperature and the characteristic information about the composition kinetic analysis of thermal decomposition has provided by TGA. The characteristic spectrum of the sample was examined by FTIR. The structural parameters and appropriateness of the phase formation characterized by XRD. Photoluminescence spectra revealed strong transition at 482 nm (4F9/2 →6H15/2), 575 nm (4F9/2 →6H13/2) and weak transition at 710 nm (4F9/2 →6H15/2). The simulated CIE chromaticity coordinate of Ba1.3Ca0.7SiO4:0.03Dy3+ falls in the white light region. The TL glow curve, the UV ray induced to the phosphor, and effect of dose response recorded for UV time exposure.
Introduction
Nowadays, nano-range alkaline earth metal silicate- based luminescent materials in various reports, including bulk, and nanocrystals received a lot of attention for numerous applications [1, 2, 3]. Solid materials such as Ca2MgSi2O7 and Sr2MgSi2O7 synthesized by solid-state method and used as a host material for many technological applications [4]. However, in solid-state synthesis method, there was an unreacted phase appeared due to the high processing temperature [5]. The temperature used for completion of the reaction was 1450°C, as well as the kinetics of this reaction is slow [6]. During such a reaction, γ-phase powder predominantly achieved after cooling to room temperature. M3SiO5 (M = Sr, Ca, and Mg) has been synthesized by using the sol-gel process at 950°C [7, 8]. The processing time and synthesis temperature for the formation of gel is high. On the other hands, very fine, homogenous, and pure crystalline materials proceeded without the intermediate decomposition structure were obtained using low- temperature solution combustion method [9, 10]. Solution combustion technique is dependent on the exothermic reaction between oxidizer and fuel. The advantage of the solution combustion process was explained in terms of simplicity, homogeneity, cost effectiveness, energy-saving, and purity for applications [11], fuel cell [12], energy conversion [13], energy storage [14], and others. Rare-earth ion-doped inorganic luminescent materials have significant importance in many areas of application [15, 16, 17]. Likewise, phosphorescent material with deep traps is exposed to UV radiation, absorbs energy from the radiation, and gets excited. When the temperature of the material is higher, thermally stimulated luminescence due to the recombination of carriers specifically electrons reactivated from the deeper traps level. Thus, the energy is converted to the luminescence and released in the form of visible light. This phenomenon is known as thermoluminescence [18, 19]. In order to get an appropriate procedure of thermoluminescence, the obtained phosphorescent materials should first be exposed to the radiation and then heated for it to emit light again. Materials that exhibit thermally stimulated luminescent include glasses, ceramics, plastics and some organic solids. TL is therefore deemed to be a thermally stimulated process [18]. The glow curve can display different peaks originating from various trapping states.
In our past study [20], we detailed the impact of doping Eu3+ particles within the Ba1.3Ca0.7SiO4: Eu3+ silicate-based ceramic phosphors for white lighting application. To the best of our knowledge, thermoluminescence (TL) and trap parameters for Ba1.3Ca0.7SiO4 doped with Dy3+ had not reported yet. To the finest of our information, thermoluminescence and trap parameters for Ba1.3Ca0.7SiO4 doped with Dy3+ had not studied yet. Here, all the possible transition and trap level formation in alkaline earth silicate-based phosphor appropriate for UV ray detection have been discussed.
Experimental Method
The starting materials used in the preparation of Ba1.3Ca0.7SiO4:0.03Dy3+ were Ba (NO3)2(99.9%), Ca (NO3)2.4H2O (99.9%), Dy (NO3)3 (99.9%), CH4N2O (99.9%), and Si (OC2H5)4 (99.9%). All these raw-materials are mixed in 10ml of deionized (DI) water in specific molar ratios [20]. The mixtures were constantly stirred at the temperature of 80-90oC for 30min until the transparent solution was formed. Then, the transparent solution was rapidly transferred to alumina crucible and put into a preheated furnace at ~550oC. The process was actually exothermic and spontaneous ignition was immediately happened. It took only 5-10 minutes for the whole process to accomplish. Ba1.3Ca0.7SiO4: Dy3+ phosphor powders obtained after annealing the samples at 1000oC for 2hrs. At the final stage a synthesized sample were crushed to fine powders for further characterization.
Thermogravimetric analysis (TGA) of the powders’ precursor were performed on a TGA/DTG (NETZSCH STA449C, Selb, Germany) thermal analyzer at heating rate of 10°C/min under nitrogen flow to evacuate all gases advanced and avoid thermo-oxidative degradation. Functional groups present in the samples were investigated by the Fourier- transform infrared spectrophotometer (FT-IR) (IR Affinity- 1S, Shimadzu). The crystal structure and phase formation of the phosphors were studied by x-ray diffractometer (XRD) of Model Philips Bruker D8 advance. The scanning electron microscope (SEM) of Model JEOL JSM-7800F, fitted out with Energy-dispersive x-ray spectroscope (EDS) (Oxford Aztee) was used to characterize the morphology and elemental composition of the Ba1.3Ca0.7SiO4: 0.3Dy3+ phosphor. Photoluminescence (PL) excitations and emissions measurements were carried out using Cary Eclipse fluorescence spectrophotometer (Model LS-55) with a xenon flash lamp to act as the excitation source. A thermoluminescence spectroscopy (TL) study was performed by the thermoluminescence reader (TL1009I).
Result and Discussion
TGA and FTIR Analysis
As-prepared Ba1.3Ca0.7SiO4 (host) samples were characterized by TGA that proceeded by heating the samples from 0 to 800oC with the heating rate of 10oC/min in N2 environment. A TGA / DTG curve for the as-prepared hydrolysis product of Ba1.3Ca0.7SiO4 is represented in Figure 1a. It has been observed that the three weight-loss stages of TGA curve such as 8%, 18.6%, and 21% well agree with the peak temperatures in DTG curve such as 90.7oC, 604.4oC, and 669oC respectively. The weight loss on the first stage of TGA, i.e. 8% is associated with the evaporation of residual solvents on the external surface and removal of water including ammonia gases. The second weight-loss stage of 18.6% is caused by oxidative decomposition and removal of the remaining organic species [21]. The third weight loss of 21% is attributed to the combustion and decomposition of remaining carbonaceous species as well as surface dehydroxylation of the silica surfaces, which is the main weight-loss stage occurring in the temperature of the 669oC. After third weight loss, there is no significant thermal change or weight loss observed, and this phenomenon specifies the completion of the whole reaction process (Figure 1b).
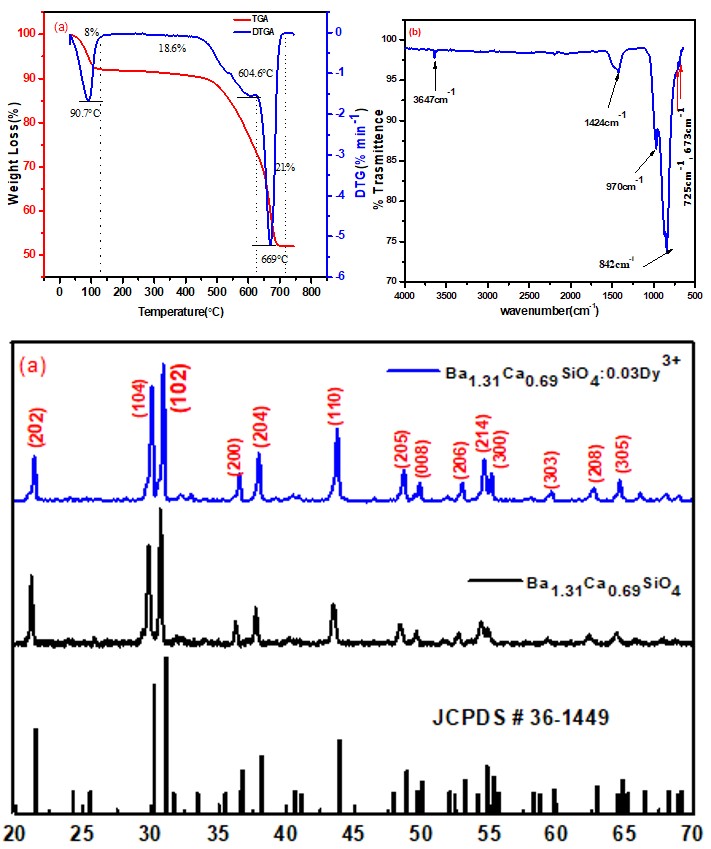
Figure 1(a): TGA/DTG curves for as-prepared sample under a N2 flow of 80 cm3 min-1, at a heating rate of 10oC min-1 (b) FTIR spectra of Ba1.3Ca0.7SiO4 powder samples.
The FT-IR technique is one of the most sought spectroscopic investigations to probe the structural units present in the material (Figure 1b). It was observed that the peaks at 725cm-1 and 673cm-1 show the presence of Ba-O and Ca-O groups. The O-Si-O and Si-O peaks at 842 cm-1 and 970 cm-1 can be attributed to the Si-O symmetric stretching modes [22]. Besides, the weakly intense bands at 3647 cm-1 and 1434 cm-1 correspond to adsorbed OH- and NH3 - species, respectively. Those weak bands were happened due to the trapping of some adsorbed OH- and NH3 - species in the Ba1.3Ca0.7SiO4 gel-containing precursors.
XRD Analysis
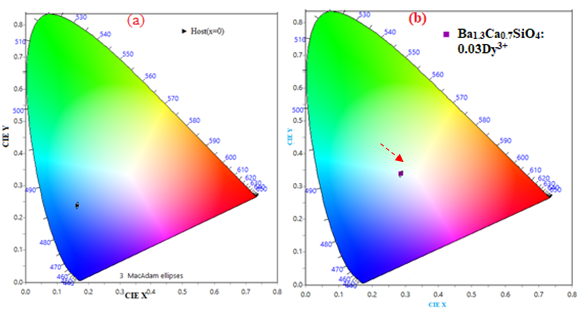
Typical x-ray diffraction patterns the Ba1.3Ca0.7SiO4: 0.03Dy3+ phosphors are shown in Figure 2a. The intensities and positions of diffraction peaks of the Ba1.3Ca0.7SiO4 samples were matched to the T-phase hexagonal structure with JCPDS Card No. 36-1449. The XRD measurement reveals that the crystal structure of the phosphors has not changed, since the ionic radius of Ca2+ nearly matches with the Dy3+ ionic radius when Dy3+ occupies Ca2+ sites within the Ba1.3Ca0.7SiO4 phosphor [23]. The prepared nanocrystals which belong to the space group (pm1) with hexagonal unit cell parameter ‘a’ = 0.5749nm, ‘c’ = 1.466nm, ‘v’= 41.973(nm) 3. The average crystallite size of Ba1.3Ca0.7SiO4 doped with 3mol% of Dy3+ ions has been determined using Scherrer’s equation [23, 24].
( ) 0.92 cos s D λ β θ =
(1) Where λ is the wavelength of the x-ray which is constant and λ=0.154 Å, Ds is represented Scherrer’s crystal size, β is the full width at half maximum, and θ is the Bragg angle. The calculation of the Scherrer crystallite size based on intense diffraction peaks (2θ =30.89, 30.02, 43.72, 54.56, 37.96, 48.66, 55.11, 21.37, 64.64, 36.49, 52.97, and 49.75), gave the average crystallite size of Ba1.3Ca0.7SiO4: 0.03Dy3+ of ∼30.67 nm as indicated in Table 1. The actual crystal structure of the Ba1.3Ca0.7SiO4: 0.03Dy3+ is a result of a lattice deformation of Ba1.3Ca0.7SiO4 via partial substitution of Ca2+ with Dy3+ due to similar ionic radius of Ca and Dy3+.
Figure 2(a): XRD patterns of Ba1.3Ca0.6SiO4: 0.03Dy3+ compound.
| [hkl] | 2 θ(0) | Particle size (nm) | d (nm) |
|---|---|---|---|
| [102] | 30.898 | 28.30647 | 0.020505 |
| [104] | 30.0248 | 23.54251 | 0.019943 |
| [110] | 43.7186 | 27.55643 | 0.028667 |
| [214] | 54.5546 | 25.58496 | 0.035281 |
| [204] | 37.9632 | 78.66058 | 0.02504 |
| [205] | 48.6603 | 24.95868 | 0.031724 |
| [300] | 55.1103 | 32.96364 | 0.035613 |
| [202] | 21.3718 | 19.83111 | 0.014276 |
| [305] | 64.6364 | 25.48513 | 0.041149 |
| [200] | 36.4946 | 28.72673 | 0.024086 |
| [206] | 52.9669 | 25.39492 | 0.034342 |
Table 1: The structural parameters and crystallite size of Ba1.3Ca0.7SiO4: 0.03Dy3+.
SEM/EDS
Figure 3 shows the SEM micrographs of the Ba1.3Ca0.7SiO4 and Ba1.3Ca0.7SiO4:0.03Dy3+. In Figure 3a, the Ba1.3Ca0.7SiO4 (host) which synthesized using urea assisting solution combustion seemed to crack exposing regular polygonal aggregates as well as some highly agglomerated regions. Figure 3b shows the SEM images of the 0.03mol of Dy3+ doped sample. This displays small and large particles that are separated with clear grain boundaries. In this sample, the particles are arranged in definite order having a slight uniform size having good connectivity with the grain. The particles ‘slight agglomeration with an irregular spherical shape, pores, and voids at both samples was observed due to the evolution of a large number of gases during the combustion process. The EDS spectrum was used to assess chemical composition of prepared phosphors as shown Figure 3c-3d. In the EDS spectrum of Ba1.3Ca0.7SiO4 (host), no other emissions appeared apart from strontium (Ba), (Ca), silicon (Si), and oxygen (O) while in the EDS spectrum of Ba1.3Ca0.7SiO4: 0.03molDy3+, no other emissions appeared apart from strontium (Ba), (Ca), silicon (Si), oxygen (O), and Dy3+ but, the peak equivalent to C in both samples existed in the spectra because of conductive adhesive. Generally, the intense peaks of, are presented in the EDS spectra, confirms the existence of Ba, Ca, Si, O, and Dy elements in the synthesized phosphor [25, 26].

Excitation and Emission Properties
Figure 4a depicted that the weak PL excitation spectra at 238 nm showed host absorption band (HAB) in the shorter wavelength. A broad emission band centred at ~482 nm shown in Figure 4b occurred due to self-trapped luminescent recombination in the host lattice. A peak at 293 nm may be ascribed to the (charge transfer CTB) transition from oxygen to dysprosium (O2 → Dy3+) in the host lattice [27]. The sharp peaks observed at 350 nm, 388 nm, and 448 nm ascribed to the 4f →4f transition of Dy3+. The characteristic excitation wavelength of synthesized phosphors was 350 nm.
The three emission peaks at 482 nm, 575 nm, and 710 nm corresponding to the transition 4F9/2→6H15/2 (blue), 4F9/2→6H13/2 (yellow) and 4F9/2→6H11/2 (red), respectively are shown Figures 4c, 4d. It was observed that the emission due to 0.03Dy3+ around 482 nm corresponds to the magnetic dipole MD transition whereas, the emission band at 575 nm corresponds to the electric dipole ED transition which is hypersensitive transition according to the selection rule ∆J =±2 [28]. The blue emission band at 482 nm is stronger than the yellow emission band at 575nm. This was particularly happened when Dy3+ ions occupy a high-symmetry local site with inversion symmetry in the host matrix [29]. Most of the time the optical properties of the material are influenced by the structure of the lattice and methods of phosphors preparation [30]. When trivalent Dy3+ doped into the Ca2+ site, three Ca2+ ions must be substituted by two Dy3+ particles, and hence, a cation vacancy is produced within the lattice. It can be represented by the following equation [31]:
Ba1.3Ca0.7SiO4 →V0ca +2[Dy3+] ·Ca(2)
Where V’ca is calcium. The incorporation Dy3+ ions in the Ba1.3Ca0.7SiO4 can neutralize the charge produced in the matrix during ions replacement, and this stabilize the structure and enhance the luminescence [32].

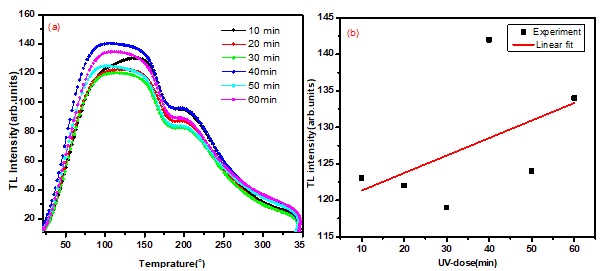
The luminescence color of Ba1.3Ca0.7SiO4 (host) and Ba1.31Ca0.69SiO4: 0.03 mol Dy3+ samples simulated by using the CIE chromaticity diagram [33] (Figure 5a-b). The CIE coordinates of the host and Dy3+ doped samples calculated (x, y) = (0.17, 0.24) and (0.30, 0.33), respectively which corresponded with the chromaticity coordinates of standard white light (x = 0.30, y = 0.33).
TL Glow Curve
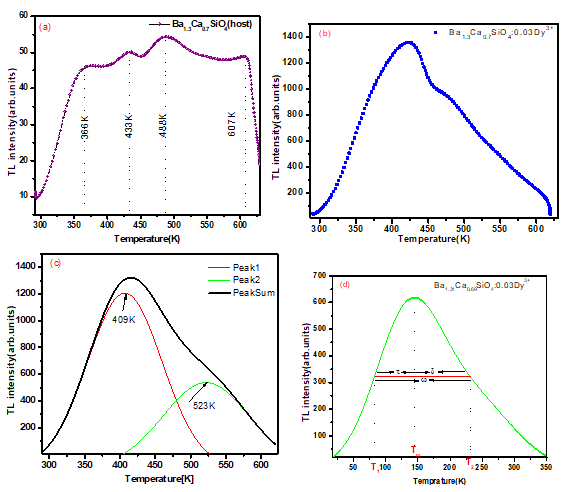
All solid materials contain lattice imperfections in the form of impurities and intrinsic defects. When these solid materials are excited by suitable radiation, these imperfections in the lattice capture electron or holes and their radiative recombination are studied by thermoluminescence glow curve technique. Thermoluminescence glow curves usually indicate the intensity of emitted light as a function of temperature showing the glow curves with one or more peaks when charge carriers are released. The glow curve is characteristic of various trap levels that lie in a band gap of the nanocrystal. The traps are characterized by certain physical parameters that include activation energy (E) and frequency factor(s). Figure 6a,6b shows TL glow curves of Ba1.3Ca0.7SiO4: 0.03Dy3+ obtained at different UV exposure times and constant heating rate of 50C.S−1.
The results in Figure 6a reveal thermoluminescence signals increment with increasing UV exposure time. The maximum intensity was found at 40 minutes exposure, but after 40 minutes, a decrease in thermoluminescence signals has been observed. In addition, the TL result shows the glow curves with one or more peaks when the charge carriers are released. The analysis of TL glow curves was very important part of study to extract the kinetic parameters such as trap depth, order of kinetics (b), and frequency factor(s). These parameters are used to decide the stability of traps/ luminescent centers. The activation energy (E) or trap depth was essential to make free the trapped electron in the traps centers. The parameter used to transfer the information whether the re-trapped charge carriers in order of kinetics or the order of lattice vibration is frequency factor [34]. The plot of UV stimulated (10-60 min) glow curves appear the variety of TL intensity versus UV exposure time (Figure 6a). The obtained result depicts the behaviour of the TL glow curve which changes with UV dose, and this was a good indication of the TL in the dosimetric application. In this process, the electron gets trapped during excitation with UV radiation into a defect created by impurities [34, 35]. Figures 7a-b shows the TL glow curves of the host and
0.03mol Dy3+ ion-doped Ba1.3Ca0.7SiO4 phosphors. The glow peaks at 366K, 433K, 488K, and 607K observed in the host. The un-doped sample shows the lowest signal intensity with a maximum of around 488K and this was probably connected to the intrinsic defect energy levels. The Dy3+ doped sample display relatively high TL intensities with glow peaks observed at 409K and 523K (Figures 7c,7d). The lower temperature peak (409K) happened due to electrons being trapped at deep levels, while the higher temperature peak at 523K might be due to the activation of the electrons from the shallow traps. These electrons had captured in the deep traps may go without attaining re-trap at intermediate levels to the conduction band and recombine consequently, giving rise to the high-temperature glow peak. The behaviours of the two peaks are different since they arise from two different types of defect centers.
The trap parameters (trap depth (E), the order of kinetics (b), frequency factors(s)) arranged in Table 2 were calculated by using the peak shape method. The fitted glow peaks of the prepared phosphor revealed that the calculated E was varied from 0.70 to 0.45 eV, which shows the deeper and shallower traps were formed in the prepared sample during UV irradiation. It was fact that when the sample irradiated by using UV rays (lower energy source) the excited electrons got trapped in the shallower trap levels. Thus, the activation energy required for escaping one electron from trap level is lower. Chen’s half-width methods’ [35, 36] are the most popular and acceptable methods which used to calculate the trap parameters.
Figure 7d clearly explained that the three points on the peaks such as T1, Tm, T2 ascribe the low half intensity temperature, the temperature of maximum intensity, and high half intensity temperature, respectively. All other trap parameters were derived from δ = (T2 − Tm), = (Tm − T1), ω = (T2 − T1), and μg = δ/ω [36]. The geometrical factor, which ranges between 0.42 and 0.52, is close to 0.42 for first-order kinetics and 0.52 for second order of kinetics. The general kinetics order (other than first or second order), the correlation between order of kinetics (b) and the geometrical factor (μg). On the other hands, the order of kinetics (b) is the mechanism of recombination of de- trapped carriers with their counterparts. The trap depth called the so-called activation energy (E) can be calculated by the general formula, which is valid for any kinetics by Eq. 3
2 2 m m kT E c b kT α α α = −
( ) (3) For general order kinetics, the value of the cα and bα (α = τ, δ, ω) is expressed as cτ = [1.51 + 3(µg - 4.2)], bτ = [1.58 + 0.42(µg − 0.42)], cδ = [0.976 + 7.3(µg - 0.42)], bδ = 0 and cω = [2.52 + 10.2(µg − 0.42)], bω = 1.0.
The frequency factor(s) is one of the important trap parameters and it describe the probability of electron escape from the traps after exposure to UV radiation. It can be calculated by using the general expression in Eq.4 kT E E s b kT E kT β = + − −
2 2 1 ( 1) exp m
(4) m m Where k is Boltzmann constant, E is the activation energy, b is order of kinetics, and Tm is a temperature of peak position, and β is heating rate. From the calculated kinetic parameters, it is found that glow curve is characteristic of the different trap levels that lie in the band gap of the material. Here the order of kinetics shows general order which nearly goes to second order. Activation energy is found to be the highest for higher peak and varies from 0.70 to 0.45eV (Table 3).
| Molar concentration of Dy3+ | T 1 | T m | T 2 | τ | Activation Energy(eV) | Frequency factor (S) S-1 | ||||
|---|---|---|---|---|---|---|---|---|---|---|
| Peak 1 | 0.03 | 357 | 418 | 505 | 61 | 87 | 148 | 0.58 | 0.7 | 2.5x10⁵ |
| Peak 2 | 0.03 | 458 | 521 | 584 | 63 | 63 | 126 | 0.5 | 0.45 | 1.0x10⁸ |
Table 2: Kinetic parameters of Ba1.3Ca0.7SiO4: 0.03Dy3+ for 10 min UV exposure time with constant heating rate 5K.S-1.
Conclusion
In summary, we have successfully synthesized Ba1.3Ca0.7SiO4: 0.03Dy3+ phosphors by the solution combustion method. Thermogravimetric analysis proved that the as-prepared sample thermally stabilized at the weight-loss stage occurred in the temperature above 669 oC. FT-IR technique was used for spectroscopic investigations to probe the structural units present in the material. The XRD studies confirmed the formation of a single-phase having space group (p3m1) with an average crystallite size of ∼30.67 nm. SEM result shows the surface morphology contains small and large particles separated with clear grain boundaries. In this sample, the particles arranged in definite order having a slight uniform size having good connectivity with the grain. The EDS result shows the presence of elements such as Ca, Ba, Si, O, and Dy in the samples. PL spectra revealed strong emission due to 4F9/2→6H15/2 transition at 482 nm (blue) and 4F9/2 → 6H13/2 transition at 575 nm (yellow) and weak emission due to 4F9/2 → 6H11/2 transition at 645 nm (red). The calculated CIE coordinates show the emission color founded in the white region. TL measurement was done by irradiating the phosphor material with UV rays. Optimization of the TL properties shown that the best dosimetric glow curve at 40 minutes UV-exposure time for Ba1.3Ca0.7SiO4: 0.03Dy3+ peaked at 409 k and 523k signifying deeper and shallower traps. The TL properties on the prepared material had also studied by plotting TL intensity versus UV exposure time. The TL peak intensity increases as UV exposure times increase up to 40 min, where it attains maximum time, but for continued UV exposure, a decrease in TL signals had observed. These had predicted that, with the increasing UV irradiation time, a density of charge carriers had increased, but after a specific irradiation time, the charge carriers’ density decreases, resulting in decrease the TL intensity. Apart from their unique strong photoluminescence properties and expected magnetic properties, which provide the Ba1.3Ca0.7SiO4: 0.03Dy3+ phosphor with the potential for application in white light displays, the behaviour of the TL glow curve with the variation of UV dose shows this phosphor is also suitable material for UV ray detection and UV dosimetric application.
Acknowledgment
The authors would like to acknowledge the financial support given from the ministry of science and higher education (Ethiopia) and national research foundation (NRF), South Africa.
References
-
Kim WJ, Kim SJ, Lee KS, Samoc M, Cartwright AN, et al. (2008) Robust Microstructures Using UV Photopatternable Semiconductor Nanocrystals. Nano lett 8(10): 3262-3265.
-
Siriwong P, Thongtem T, Phuruangrat A, Thongtem S (2011) Hydrothermal synthesis, characterization, and optical properties of wolframite ZnWO4nanorods. CrystEngComm 13(5): 1564-1569.
-
Hunag S, Xu J, Zhang Z, Zhang X, Wang L, et al. (2012) Rapid, morphologically controllable, large-scale synthesis of uniform Y(OH)3 and tunable luminescent properties of Y2O3:Yb3+/Ln3+ (Ln = Er, Tm and Ho). J Mater Chem 22(31): 16136-16144.
-
Alvani AAS, Moztarzadeh F, Sarabi AA (2005) Journal of Luminescence 114(2): 131-136.
-
Pan W, Ning GL, Wang JH, Lin Y (2007) A Novel Synthesis of Alkaline Earth Silicate Phosphor Sr3MgSi2O8:Eu2+,Dy3+. Chinese Journal of Chem 25(5): 605-608.
-
Pritts IM, Daugherty KE (1976) The effect of stabilizing agents on the hydration rate of β-C2S. Cement and Concrete Research 6(6): 783-795.
-
Nettleship I, Shull JL, Kriven WM (1993) Chemical preparation and phase stability of Ca2SiO4 and Sr2SiO4 powders. Journal of the European Ceramic Society 11(4): 291-298.
-
Singh D, Sheoran S, Bhagwan S, Kadyan S (2016) Optical characteristics of sol-gel derived M3SiO5:Eu3+ (M = Sr, Ca and Mg) nanophosphors for display device technology. Cogent Phys 3(1): 1262573.
-
Kingsley JJ, Manickam N, Patil KC (1990) Combustion synthesis and properties of fine particle fluorescent aluminous oxides. Bulletin of Mater Science 13: 179- 189.
-
Kingsley JJ, Patil KC (1988) A novel combustion process for the synthesis of fine particle α-alumina and related oxide materials. Mater Lett 6(11-12): 427-432.
-
Qiu Z, Zhou Y, Lü M, Zhang A, Ma Q (2007) Combustion synthesis of long-persistent luminescent MAl2O4: Eu2+, R3+ (M = Sr, Ba, Ca, R = Dy, Nd and La) nanoparticles and luminescence mechanism research. Acta Mater 55(8): 2615-2620.
-
Raza MA, Rahman IZ, Beloshapkin S (2009) Synthesis of nanoparticles of La0.75Sr0.25Cr0.5Mn0.5O3−δ (LSCM) perovskite by solution combustion method for solid oxide fuel cell application. Journal of Alloys and Compounds 485(1-2): 593-597.
-
Kelkar SA, Shaikh PA, Pachfule P, Ogale SB (2012) Nanostructured Cd2SnO4 as an energy harvesting photoanode for solar water splitting. Energy & Environ Sci 5(2): 5681-5685.
-
Wen W, Wu JM, Tu JP (2012) A novel solution combustion synthesis of cobalt oxide nanoparticles as negative-electrode materials for lithium ion batteries. J of Alloys and Comp 513: 592-596.
-
Hao E, Bailey RC, Schatz GC, Hupp JT, Li S (2004) Synthesis and Optical Properties of “Branched” Gold Nanocrystals. Nano Lett 4(2): 327-330.
-
Jüstel T, Nikol H, Ronda C (1998) New Developments in the Field of Luminescent Materials for Lighting and Displays. Angew Chem Int Ed Engl 37(22): 3084-3103.
-
Azorín J (1986) Determination of thermoluminescence parameters from glow curves—I. A review. International Journal of Radiation Applications and Instrumentation. Part D. Nuclear Tracks and Radiation Measurements 11(3): 159-166.
-
Bos AJJ (2006) Theory of thermoluminescence. Radiation measurements 41(S1): S45-S56.
-
Chen R, McKeever SWS (1997) Theory of thermoluminescence and related phenomena [electronic resource]. World Scientific, River Edge, NJ, Singapore, 13: 559.
-
Golja DR, Dejene FB (2020) Effect of Eu3+ ion concentration on the structural and photoluminescence properties of Ba1.3Ca0.7SiO4 ceramic-based red phosphors for solid-state lighting applications. J Alloys and Comp 827: 154216.
-
Sing KSW, Everett DH, Haul RAW, Moscou L, Pierotti RA, et al. (1985) Reporting physisorption data for gas/solid systems with special reference to the determination of surface area and porosity. Pure & Appl Chem 57(4): 603-619.
-
Balachander L, Ramadevudu G, Shareefuddin MD, Sayanna R, Venudhar YC (2013) IR analysis of borate glasses containing three alkali oxides. Science Asia 39(3): 278-283.
-
Huang Z, Chen YJ, Chen L, Xie Y, Xiao LJ, et al. (2013) Fluorescence improvement of Ba1.3Ca0.7SiO4:Eu2+,Mn2+ phosphors via Dy3+ addition and their color-tunable properties. Ceram Intern 39(3): 2709-2714.
-
Pan W, Ning G, Zhang X, Wang J, Lin Y, et al. (2008) Enhanced luminescent properties of long-persistent Sr2MgSi2O7:Eu2+, Dy3+ phosphor prepared by the co- precipitation method. J of lumin 128(12): 1975-1979.
-
Shenker D, Chen R (1971) Numerical curve fitting of general order kinetics glow peaks. J of Physics D: Appl Physics 4: 287.
-
Kivits P, Hagebeuk HJL (1977) Evaluation of the model for thermally stimulated luminescence and conductivity; reliability of trap depth determinations. J of Lumin 15(1): 1-27.
-
Pavitra E, Raju GSR, Ko YH, Yu JS (2012) A novel strategy for controllable emissions from Eu3+ or Sm3+ ions co- doped SrY2O4:Tb3+ phosphors. Phys Chem Chem Phys 14(32): 11296-11307.
-
Mulak J, Mulak M (2007) On a complementary scale of crystal-field strength. J Phys A: Math Theor 40: 2063.
-
Ratnam BV, Jayasimhadri M, Jang K, Lee HS, Yi SS, et al. (2010) White Light Emission from NaCaPO4:Dy3+ Phosphor for Ultraviolet-Based White Light-Emitting Diodes. J of the American Ceram Society 93(11): 3857- 3861.
-
Chen Y, Cheng X, Liu M, Qi Z, Shi C (2009) Comparison study of the luminescent properties of the white-light long afterglow phosphors: CaxMgSi2O5+x:Dy3+(x=1, 2, 3). J of lumin 129(5): 531-535.
-
Gupta SK, Kumar M, Natarajan V, Godbole SV (2013) Optical properties of sol–gel derived Sr2SiO4:Dy3+ – Photo and thermally stimulated luminescence. Opt Materials 35(12): 2320-2328.
-
Zukauskas A, Shur MS, Gaska R (2002) Introd to Solid State Lighting. General & Introductory Electrical & Electronics Engineering, pp: 224.
-
Kulkarni PP, Gavhane KH, Bhadane MS, Bhoraskar VN, Dahiwale SS, et al. (2020) Investigation of the photoluminescence and novel thermoluminescence dosimetric properties of NaGdF4:Tb3+ phosphors. Mat Advances 1(5): 1113-1124.
-
Nobbs JH (1985) Kubelka—Munk Theory and the Prediction of Reflectance. Review of Progress in Coloration and Related Topics 15(1): 66-75.
-
Elhaes H, Attallah M, Elbashar Y, El-Okr M, Ibrahim M (2014) Application of Cu2O-doped phosphate glasses for bandpass filter. Physica B: Condensed Matter 449: 251-254.
-
Kolte MM, Pawade VB, Dhoble SJ (2017) Structural and optical characterization of RE (Eu2+, Ce3+) doped SrMg2Al6Si9O30 nanocrystalline phosphor. Journal of Materials Science: Materials in Electronics 29: 906-913.
- Sense, Gravity, Parity & Chirality in Mathematical Physics
- Quantum Lattice Simulations PHYSICS: Microcircuit Particle Formation and Observable Macroscopic Irreversible Time - A Discrete Lagrangian with Cellular Automata Framework
- Quantum Biology from Biomacromolecule to Cell, and Central Dogma Described by Quantum Theory
- Focus, Agility, Speed and Technology (FAST) for Sustainability and Growth
- Square Root Metric Geometry and Pati-Salam Model in Curved Space-Time
- A Simple System Demonstrating the Mpemba Effect in Classical Mechanics