Features of the Kinetics of the Fenton Reaction
The Fenton reaction is of considerable interest due to the fact that it can be applied in chemical, biochemical and biomedical research. The Fenton reaction makes it possible to estimate the content of hydroperoxides. Hydroperoxides in a large number of cases are the trace that remains after the occurrence of redox reactions. To perform such studies, it is necessary to know the characteristics of the reaction at different ratios between the concentrations of hydroperoxides and ferrous iron. The reaction yield is determined by registering chemiluminescence. The number of oxidation events of ferrous iron N(Fe2+ ® Fe3+) in the Fenton reaction is calculated in this work for the cases [Fe2+] > [H2O2] and [Fe2+] < [H2O2] at concentrations of Fe2+ and H2O2 ranging from 10-3 to 10-7 mol/L. It is shown that the peroxide concentration can be unambiguously determined only for the case [Fe2+] > [H2O2]. In the case of [Fe2+] < [H2O2], due to a strong decrease in the reaction rate, it is not always possible to register the total chemiluminescence yield. The kinetics of the formation of luminous products in the Fenton reaction after the introduction of luminol has been calculated. Conditions are considered when chemiluminescence with luminol is proportional to the concentration of hydroperoxides. The considered features of the Fenton reaction must be taken into account when performing specific research work.
Introduction
The Fenton reaction has been known for over 100 years. Despite this, it turned out that there are difficulties in its description and understanding. The nature of the active species obtained in the Fenton reaction and their properties are still the subject of discussion. In a detailed review [1], published in 2021, on the Fenton reaction in biophysical, biochemical, and biomedical research, 347 papers are analyzed and cited. This overview provides comprehensive information related to the basics of the Fenton reaction, including the Fenton reaction itself and Fenton-like reactions.
There is no need to return to these works, therefore, below we will consider only aspects that were not covered by the review [1], and part of the work performed after 2021. The Fenton reaction attracts researchers from various points of view, including calculations of the reaction mechanism and alternative approaches [2, 3, 4]. Its advantage is that it is simply implemented and serves as a source of various chemically active species, one of which is hydroxyl radicals. The interaction of hydroxyl radicals leads to the formation of all types of reactive oxygen species [5]. The possibilities of using the Fenton reaction attract the attention of specialists in various fields of knowledge.
The observed quantity in the Fenton reaction is the number of N(Fe2+ ® Fe3+) oxidation events. One of the methods for detecting oxidation events in the Fenton reaction is chemiluminescence [6]. The mechanism of the appearance of luminescence arising in the Fenton reaction upon the interaction of hydroxyl radicals with organic substances both without additional additives and after the introduction of luminol, which enhances luminescence, was considered in Ivanova IP, et al. [7]. In this work, a scheme of the process of interactions in Fenton’s solution with both active species and various substances introduced into the solution is proposed. The channels for the formation of luminous products are analyzed, which are recorded by a chemiluminometer. The channels for the formation of luminous products are analyzed, which are recorded by a chemiluminometer. Within the framework of the proposed scheme, the possibility of studying the properties of antioxidants and prooxidants is discussed. It has been established that the main luminous agent is singlet oxygen.
The use of chemiluminescence in the Fenton reaction for biomedical research is analyzed in Ivanova IP and Piskarev IM [8, 9]. The possibilities of assessing the oxidative and antioxidant capacity of the substrate are considered in Piskarev IM and Trofimova SV, et al. [10, 11]. In Lin HC [12], when studying super weak luminescence in a mixture of Fenton with ortho-chlorophenol, the result of work [7] was confirmed that singlet oxygen is luminescent agent. In Romodin LA [13], chemiluminescence was considered in the study of free radical reactions, kinds of luminescent additives were discussed to increase the quantum yield of chemiluminescence. Research continues on Fenton like reactions [14] and new methods of chemiluminescence analysis in the Fenton reaction [15].
This work is devoted to modeling the Fenton reaction, calculations of time characteristics, recommendations for choosing the ratio between the concentrations of reagents (hydrogen peroxide and ferrous iron), dependence on the acidity of the solution, calculations of the chemiluminescence kinetics with the introduction of luminol.
Theoretical Background
Kinetic Model of Processes in Fenton’s Solution
It was further assumed that the number of N(Fe2+ ® Fe3+) oxidation events in the Fenton reaction is determined by registering the luminescence that accompanies the reaction. The mechanism of chemiluminescence in the Fenton reaction was considered in Ivanova IP, et al. [7]. The scheme of chemical reactions describing the process of interaction in an acidic medium between active species arising in the Fenton reaction, reaction (1 - 17), is shown in Table 1. The interaction of luminol (Lum) with hydroxyl radicals is described by reactions 15, 16. The concentrations of OH- and H+ ions (solution pH) were set as coefficients. The model includes the interaction of ferrous iron with hydrogen peroxide and the subsequent formation of radicals OH•, HO2 •, O2 •- and singlet oxygen O2(S), dissociation of hydrogen peroxide H2O2 « HO2 - + H+, pKa = 11.5 (reactions 12, 13), and equilibrium HO2 • « H+ + O2 •-, pKa = 4.8 (reactions 7, 8). Singlet oxygen, reaction 17, is included in the scheme due to the fact that active species are consumed for its formation. Further transformations of singlet oxygen leading to the appearance of luminescence are considered in Ivanova IP, et al. [7]. The values of the reaction rate constants were taken from Handbook of Chemistry and Physics [16]. The solution of the system of differential equations of chemical kinetics was carried out using the MathCad 11 package.
| №№ | Reaction | Rate constant, L/ (mol s), [16] |
|---|---|---|
| 1 | Fe2+ + H O à Fe3+ + OH· + OH- 2 2 | k = 56 1 |
| 2 | OH· + H O à HO · + H O 2 2 2 2 | k = 3×10⁷ 2 |
| 3 | HO · + HO · à H O + O 2 2 2 2 2 | k = 8,3 ×10⁵ 3 |
| 4 | Fe2+ + OH· à Fe3+ + OH- | k = 3 ×10⁸ 4 |
| 5 | OH· + OH· à H O + 1/2О 2 2 | k = 5,5 ×10⁹ 5 |
| 6 | OH· + HO · à H O + O 2 2 2 | k = 7,1 109 6 |
| 7 | HO · à H+ + O ·- 2 2 | k = 7,5 ×10⁶ 7 |
| 8 | H+ + O ·- à HO · 2 2 | k = 1,2 102pK = 4.8 8 a |
| 9 | HO · + O ·- à HO - + O 2 2 2 2 | k = 9,7 107 9 |
| 10 | HO · + OH- à O ·- + H O 2 2 2 | k = 1010 10 |
| 11 | O ·- + Fe3+ à Fe2+ + O 2 2 | k = 1,9 ×10⁹ 11 |
| 12 | H O à HO - + H+ 2 2 2 | k = 2 ×10⁻² 12 |
| 13 | HO - + H+à H O 2 2 2 | k = 1010 pK = 11.5 13 a |
| 14 | OH· + HO - à HO · + OH- 2 2 | k = 7,5 ×10⁹ 14 |
| 15 | Lum + OH· +1/2O à 2 LumOOH· | k = 8,7 109 [6] 15 |
| 16 | LumOOH· + O ·- à L* 2 | k = 1 16 |
| 17 | O ·- + OH· + H+ à H O + O (s) 2 2 2 | k = 1010 17 |
Table 1: Rate constants of reactions in Fenton’s solution.
The number of acts of oxidation of ferrous iron N(Fe2+ ® Fe3+) was calculated. It included both the amount of initially oxidized Fe2+ molecules introduced with the reagent and Fe2+ molecules reduced in reaction (11) from Fe3+ ions interaction with the O2 •- ion-radical. The interaction of ferric iron with hydrogen peroxide was not taken into account, since the rate constant of this reaction is five orders of magnitude smaller than the rate constant of reaction (1) [1]. It was assumed that in a neutral and alkaline medium ferric iron precipitates after the reaction Fe3+ + 3OH- à Fe(OH)3¯. The calculation took into account the lifetime of ferric ions in solution. Observing the time for the appearance of a colored precipitate in a neutral medium after mixing the reagents, the authors concluded that the lifetime of the Fe3+ ion is about 1 second. Then, assuming that the rate of formation of Fe(OH)3 is proportional to the concentration of OH- ions, the lifetime of Fe3+ ions at pH = 12 will be 106 times less and will be approximately 10-6 seconds.
Results and Discussion
Fe2+ Oxidation Kinetics for the Case [Fe2+] > [H2O2]
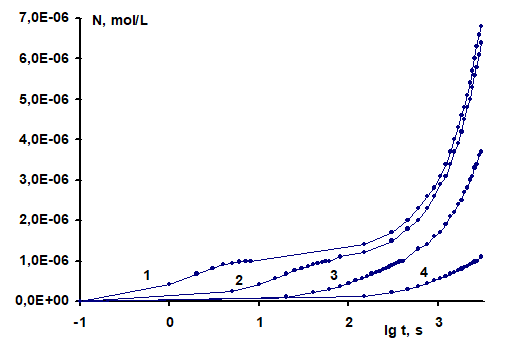
The calculated dependence of the number of oxidation events N(Fe2+ ® Fe3+) in an acidic medium (рН = 2) for the case of [Fe2+] > [H2O2] at [H2O2] = 10-6 mol/L and different concentrations of Fe2+ on time after the mixing of the reagents and the beginning reactions are shown in Figure 1. It can be seen from the graph that for all concentrations of Fe2+ from 10-2 to 10-5 mol/L, the value of N(Fe2+ ® Fe3+) reaches the limit value of 2 x 10⁻⁶ mol/L. The value of the limiting concentration is determined by the fact that one molecule of hydrogen peroxide decomposes into two hydroxyl radicals, each of which oxidizes one molecule of ferrous iron. The oxidation process stops when the hydrogen peroxide is completely consumed, and the maximum number of oxidation events is N = 2[H2O2].
In the reaction scheme, the limiting stage is the interaction of ferrous iron with peroxide (reaction 1), since the rate constant of this reaction is minimal. The remaining reactions have large rate constants and reactions occur almost instantaneously. The interaction of peroxide with OH• radicals (reaction 2) could shorten the reaction time. The rate constant of this reaction is large, but the concentration of radicals is low, [OH•]<<[Fe2+], so the reaction of hydrogen peroxide with iron still remains decisive. Let us qualitatively estimate the reaction time until complete termination of reaction at [Fe2+] > [H2O2]. The rate of reaction (1) is equal to:
$$ \mathrm {w} = \mathrm {k} _ {1} \left[ \mathrm {F e} ^ {2 +} \right] \left[ \mathrm {H} _ {2} \mathrm {O} _ {2} \right] \tag {1} $$ The time of this reaction will be determined by the consumption of peroxide:
$$ \tau = \frac {\left[ \mathrm {H} _ {2} \mathrm {O} _ {2} \right]}{\mathrm {k} _ {1} \cdot \left[ \mathrm {F e} ^ {2 +} \right] \cdot \left[ \mathrm {H} _ {2} \mathrm {O} _ {2} \right]} = \frac {1}{\mathrm {k} _ {1} \cdot \left[ \mathrm {F e} ^ {2 +} \right]} $$
2 2 2+ 2+ 1 2 2 1
(2) Those, the reaction time at [Fe2+] > [H2O2] does not depend on the peroxide concentration and is determined by the ferrous iron concentration. Figure 1 shows that the reaction time increases with decreasing Fe2+ concentration, while the reaction yield, the number of ferrous iron oxidation events, remains constant and is determined by the peroxide concentration. Thus, the Fenton reaction makes it possible to determine the concentration of hydroperoxides in a sample.
![Figure 1: It can be seen from the graph that for all concentrations of Fe2+ from 10-2 to 10-5 mol/L, the value of N(Fe2+ ® Fe3+) reaches the limit value of 2 x 10⁻⁶ mol/L. The value of the limiting concentration is determined by the fact that one molecule of hydrogen peroxide decomposes into two hydroxyl radicals, each of which oxidizes one molecule of ferrous iron. The oxidation process stops when the hydrogen peroxide is completely consumed, and the maximum number of oxidation events is N = 2[H2O2].](/fulltextimages/11238/fig_1.png)
The kinetics of Fe2+ oxidation at [Fe2+] > [H2O2] and different peroxide concentrations for [Fe2+] = 10–3 mol/L is shown in Figure 2. It can be seen that at all peroxide concentrations from 10-4 to 10-8 mol/L in 60 seconds, the number of oxidation events occurs, equal to the number of hydroxyl radicals formed during the decomposition of peroxide, i.e. 2x[H2O2]. The reaction time in all cases considered is the same.
![Figure 2: It can be seen that at all peroxide concentrations from 10-4 to 10-8 mol/L in 60 seconds, the number of oxidation events occurs, equal to the number of hydroxyl radicals formed during the decomposition of peroxide, i.e. 2x[H2O2]. The reaction time in all cases considered is the same.](/fulltextimages/11238/fig_2.png)
Figure 2: Kinetics of Fe2+ oxidation in the Fenton reaction at [Fe2+] > [H2O2]. N(mol/L) - the number of oxidation events (Fe2+ ® Fe3+) depending on the time after mixing the reagents t(s) at pH = 2 and different concentrations of [H2O2]. Concentration [Fe2+] = 10-3 mol/L; [H2O2] concentrations: 1 - 10-4, 2 - 10-5, 3 - 10-6, 4 - 10-7, 5 - 10-8 mol/L.
Fe2+ Oxidation Kinetics for the Case of [Fe2+] < [H2O2]
At [Fe2+] < [H2O2], the contribution of other reactions, except for reaction (1), cannot be neglected. The initially introduced divalent iron is quickly consumed. Trivalent iron will be reduced back to ferrous (reaction 11), and the process will continue until the peroxide is completely consumed, and its rate is determined by the Fe3+ reduction rate.
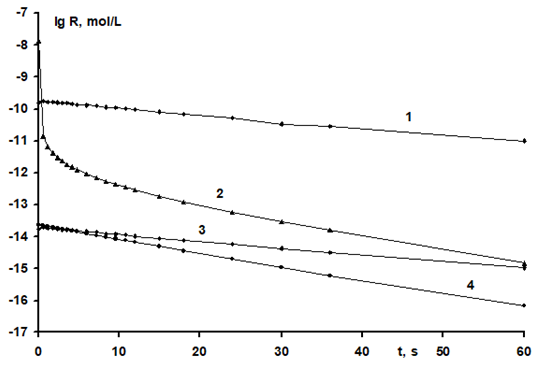
Dependence of the number of N(Fe2+ ® Fe3+) oxidation events in an acidic medium (pH = 2) at [Fe2+] = 10-6 mol/L for the case of [Fe2+] < [H2O2] at different peroxide concentrations on time after mixing the reagents, after which the Fenton reaction begins, shown in Figure 3. Figure 3 shows that the number of oxidation events significantly exceeds the number of Fe2+ molecules initially introduced into the solution. This is due to the occurrence of chain reactions, on the maintenance of which consumes hydrogen peroxide. The time during which the number of oxidation reactions could approach the number of hydrogen peroxide molecules under all conditions is more than 5000 seconds.
Comparing Figures 1-3, one can understand that it is possible to determine the concentration of accumulated hydroperoxides in an acidic medium only for the case [Fe2+] > [H2O2], when it is possible to register all the radiation accompanying the reaction. An important practical conclusion follows from these data. The radiation that directly accompanies the reaction should be recorded at [Fe2+] = 10-3 mol/L within 60 seconds after the preparation of the mixture and introduction of iron into the solution. The calculation showed that under the condition [Fe2+] > [H2O2], the reaction time is determined by the iron concentration in accordance with the qualitative assessment (ratio 2) and is 6 seconds, 60, 600 and 6000 seconds for [Fe2+] = 10-2, 10-3 , 10-4 and 10-5 mol/L, respectively.
Active Species Concentration
The concentrations of active species that appear in Fenton’s solution at concentrations of [Fe2+] = 10-3, and [H2O2] = 10-4 mol/L, pH = 2 for up to 60 seconds from the start of the reaction are shown in Figure 4. It can be seen that the main active species are hydroxyl radicals, however, at the beginning of the reaction, when Fe3+ ions have not yet been produced, the concentration of O2 •- superoxide radicals is much higher. Ferric iron ions consume superoxide radicals, and when there is no Fe3+ yet, O2 •- radicals quickly accumulate. With the advent of ferric iron, the concentration of superoxide radicals drops sharply.
In a neutral environment (pH = 6), the oxidation of ferrous iron with oxygen dissolved in water and the precipitation of ferric iron begin to play a role. However, for times up to 600 seconds, the effect of these processes is not significant, and the estimates made for an acidic medium are valid. In a strongly alkaline medium (pH = 12), these processes are accelerated; however, at the initial stage of the reaction, the proposed model can be used to assess the kinetics.
Luminol-dependent Luminescence
To enhance the luminescence of the solution in the Fenton reaction, luminol is introduced into it. Let us consider the case of determining the peroxide concentration by detecting the radiation that occurs during the reaction when luminol is added to the solution. In principle, it is desirable to register the total luminescence yield. This value is determined by the intensity of the radiation and the duration of the process. It is impossible to evaluate the peroxide concentration by the radiation intensity alone, since the radiation duration is an independent parameter [7]. It is experimentally possible to determine the number of emitted photons in a limited time, but if the reaction time is long, it will be practically impossible to count all the emitted photons.
The mechanism of formation of excited states emitting photons was considered in Vladimirov YA, et al. [6]. At the first stage, luminol Lum interacts with hydroxyl radicals (reaction 15, Table 1), forming LumOOH
- radicals in the presence of atmospheric oxygen. Further transformations of the LumOOH
- radicals can lead to the formation of products that directly emit photons. The mechanisms of luminescence reactions are analyzed in Ivanova IP, et al. [7]. Let us consider the kinetics of LumOOH
- formation. If the emission occurs instantaneously, then the intensity of the emission will be proportional to the rate of formation of LumOOH
- , and the total number of emitted photons will be proportional to the number of formed LumOOH
- radicals.
Let us estimate the concentrations of iron and luminol that are convenient for the experimenter. The rate of formation of active species varies with the time of the reaction. The dependence of the LumOOH• formation rate for up to 1000 seconds after the start of the reaction for [Fe2+] = 10-3, 10-4 and 10-5 mol/L is shown in Figure 5.
Take the case [Fe2+] > [H2O2]. In this case, the reaction time will be determined by the concentration of ferrous iron.
![Figure 5: Take the case [Fe2+] > [H2O2]. In this case, the reaction time will be determined by the concentration of ferrous iron.](/fulltextimages/11238/fig_5.png)
Figure 5: Dependence of the rate of formation of luminol radicals LumOOH•, lgdN, mol/(L s) at pH = 2 and different concentrations of ferrous iron on time since the start of the reaction, t, s. Numbers indicate: 1 - [Fe2+] = 10-3 mol/L, 2 - [Fe2+] = 10-4 mol/L, 3 - [Fe2+] = 10-5 mol/L. In all cases, the concentration of [H2O2] = 10-5 mol/L, the concentration of luminol 10-4 mol/L.
Based on the fact that the luminescence must be recorded during the entire reaction time, it is not a problem to measure the light emission at [Fe2+] = 10-3 mol/L of 60 seconds. At [Fe2+] = 10-4 mol/L it is also possible to register luminescence during the reaction time of 600 seconds, however, the luminescence intensity will decrease by 10 times. In this case, the measurement time during which the effect + background will be recorded will also increase by 10 times, i.e. in the resulting light sum, the signal-to-noise ratio will be much worse. It is already difficult to register radiation during the reaction time of 6000 seconds at [Fe2+] = 10-5 mol/L, the signal-to-noise ratio will worsen even more.
The calculation shows that at [Fe2+] = 10-5, 10-4 and 10–3 mol/L, the amount of LumOOH• radicals formed during the total reaction time will be the same. However, if the radiation is registered for a limited time, for example, 60 seconds, then at [Fe2+] = 10-3 mol/l, we can register the entire glow, in other cases, only a part of it. It is impossible to say from the experiment what part of the radiation was registered, since the reaction time depends not only on [Fe2+], as for [Fe2+] > [H2O2], but also on [H2O2], if [H2O2] > [Fe2+]. We do not know the value of the peroxide concentration to be found, so the result may be ambiguous.
The dependence of the concentration of [LumOOH•] radicals formed during the observation time of 120 seconds (NL) on the concentration of peroxide for different concentrations of luminol is shown in Figure 6. The concentration of [Fe2+] is chosen equal to 10-5 mol/L, the concentration of luminol is from 10-3 to 10-7 mol/L. Such concentrations of reagents are often used in practical analyzes [6, 12]. It turned out that the values of NL do not depend on the concentration of luminol in the range [Lum] from 10–3 to 10–5 mol/L (the values at these concentrations coincide and lie on the same curve (1). For curve (2), at peroxide concentrations from 10–3 to 10–5 mol/L, almost all luminol (its concentration is 10–6 mol/L) is consumed, so the dependence of NL on [H2O2] is weak within these limits. Similarly for curve (3) at [H2O2] from 10-3 to 10-6 mol/L.
The complex and non-linear nature of the dependencies in Figure 6 indicates that the measured concentration of [LumOOH•] at one set of concentrations of[Fe2+] and [Lum] does not allow one to unambiguously determine not only the absolute value of [H2O2], but also the ratio of concentrations for different solutions. In particular, for curve 3 it can be seen that at [Lum] = 10-7 mol/L and [Fe2+] = 10-5 mol/L, the dependence of [LumOOH•] on [H2O2] is very weak, and the concentration of [LumOOH•] can even decrease with increasing [H2O2] (curve 3).
![Figure 6: The concentration of [Fe2+] is chosen equal to 10-5 mol/L, the concentration of luminol is from 10-3 to 10-7 mol/L. Such concentrations of reagents are often used in practical analyzes [6,12]. It turned out that the values of NL do not depend on the concentration of luminol in the range [Lum] from 10–3 to 10–5 mol/L (the values at these concentrations coincide and lie on the same curve (1). For curve (2), at peroxide concentrations from 10–3 to 10–5 mol/L, almost all luminol (its concentration is 10–6 mol/L) is consumed, so the dependence of NL on [H2O2] is weak within these limits. Similarly for curve (3) at [H2O2] from 10-3 to 10-6 mol/L.](/fulltextimages/11238/fig_6.png)
One of the possible ways of further transformations of LumOOH• is the interaction with the superoxide radical O2 •- (reaction 16). The result is an excited molecule L*. The photon emission time, according to Vladimirov YA, et al. [6], is much less than 1 second. Impurity molecules can increase this time, but there are no such impurities in pure Fenton’s solution. Therefore, in what follows, we assume that the luminescence L* occurs instantaneously, and the reaction rate constant 16 is set equal to 1. The resulting product L* can emit photons in the blue region of the spectrum [7]. The formation rate L* is determined by the relation:
_ 16 2
[LOOH ] [O
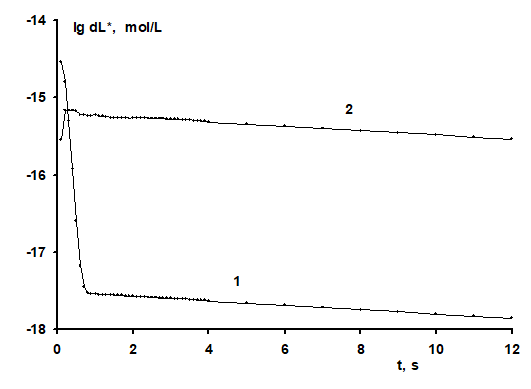
$$ \mathrm {d L} ^ {*} / \mathrm {d t} = \mathrm {k} _ {1 6} \cdot \left[ \mathrm {L O O H} ^ {\bullet} \right] \cdot \left[ \mathrm {O} _ {2} ^ {\bullet -} \right]. \tag {3} $$ The dependence of the rate of formation of L* (dL*) at [Fe2+] = 10-3 mol/L, pH = 2, [H2O2] = 10-4 mol/L and [Lum] = 10-4 mol/L on time for the first 12 seconds from the beginning of the reaction is shown in Figure 7 (curve 1).
A strong decrease in the rate with time is due to a decrease in the [O2 •-] concentration (see Figure 4, curve 2). It can be seen from Figure 7 that at pH=2, in the first 0.7 seconds, the rate of formation of dL* decreases by more than 1000 times. This is due to the rate of formation of the superoxide radical, which is maximal at the beginning of the reaction. The total concentration of formed molecules dL* for the first 0.7 seconds is 5.15 10-15 mol/L, and for 12 seconds - 5.39 10-15 mol/L. If the emission occurs instantaneously, then, starting registration after 2 seconds, we lose information about almost all emitted photons.
The situation is different at pH = 12 (see Figure 7, curve 2), when the trivalent iron formed in the reaction and almost instantly precipitates. In this case, trivalent iron does not have time to appreciably consume superoxide radicals, superoxide radicals concentration does not decrease much, and the amount of L* products that decompose with the emission of photons increases greatly.
Conclusion
- The number of oxidation events in the Fenton reaction N(Fe2+ ® Fe3+) is measured by registering the chemiluminescence that accompanies the reaction.
- For [Fe2+] > [H2O2], the Fenton reaction time is determined by the ferrous iron concentration and does not depend on the hydroperoxide concentration. The number of N(Fe2+ ® Fe3+) oxidation events is determined by the hydroperoxide concentration.
- At [Fe2+] < [H2O2], the reaction continues until the hydroperoxide is completely consumed. The number of N(Fe2+ ® Fe3+) oxidation events is also determined by the concentration of hydroperoxide, but not all of the luminescence accompanying the Fenton reaction can be recorded due to the fact that the reaction is slow. The duration of the reaction can significantly exceed the registration time.
- The concentrations of iron and luminol convenient for the experimenter were estimated. If the choice of concentrations of ferrous iron and luminol is unsuccessful, chemiluminescence will not depend on the concentration of hydroperoxides.
References
-
Tang Z, Zhao P, Wang H, Liu Y, Bu W (2021) Biomedicine Meets Fenton Chemistry. Chem Rev 121(4): 1981-2019.
-
Barbusinski K (2009) Fenton Reaction – Controversy Concerning the Chemistry. Ecological Chemistry and Engineering S 16(3): 347-358.
-
Arsene I, Gorinchioy N (2019) DFT Study of the Entire Reaction Cycle of H2O2 Decomposition and O2 Generation Catalyzed by Fenton Reagent. Chemistry Journal of Moldova 14(1): 88-97.
-
Miliordos E, Xantheas SS (2015) Ground and Excited States of the [Fe(H2O)6]2+ and [Fe(H2O)6]3+ Clusters: Insight into the Electronic Structure of the [Fe(H2O)6]2+- [Fe(H2O)6]3+ Complex. J Chem Theiry Comput 11(4): 1549-1563.
-
Piskarev IM (2021) The Formation of Ozone-Hydroxyl Mixture in Corona Discharge and Lifetime of Hydroxyl Radicals. IEEE Transactions on Plasma Science 49(4): 1363-1372.
-
Vladimirov YA, Proskurina EV (2009) Free Radicals and Sell chemiluminescence. Biochemistry (Mosc) 74(13): 1545-1566.
-
Ivanova IP, Trofimova SV, Piskarev IM, Aristova NA, Burhina OE, et al. (2012) Mechanism of Chemiluminescence in Fenton Reaction. Journal of Biophysical Chemistry 3(1): 88-100.
-
Ivanova IP, Trofimova SV, Piskarev IM (2014) Fenton’s Reactions Induced Chemiluminescence ls Mathematical Modelling of Process; Characteristics, Parameters and Application Conditions for Biomedical Studies. Sovremennye Tehnologii v Medicine 6(4): 14-24.
-
Piskarev IM, Ivanova IP (2015) Reactions between Hydroperoxides and Fe2+ to Investigate Redox Processes in Biological Objects: a Kinetics Study. Research Journal of Pharmaceutucal, Biological and Chemical Sciences 6(6): 225-234.
-
Piskarev IM, Ivanova IP (2016) Assessment of Oxidative and Antioxidant Capacity of Biological Substrates by Chemiluminescence Induced by Fenton Reaction. Sovremennye Tehnologii v Medicine 8(3): 16-25.
-
Piskarev IM, Trofimova SV, Burkhina OE, Ivanova IP (2015) Investigation of the Level of Free Radical Processes in Substrates and Biological Samples Using Induced Chemiluminescense. Biophysics 60(3): 496- 505.
-
Chen H, Lin JM (2022) Ultra Weak Chemiluminescence from Fenton’s Reaction. In: Jin-Ming L, et al. (Eds.), Ultra Weak Chemiluminescence. Springer, Berlin, Heldelberg, pp: 127-141.
-
Romodin LA (2022) Chemiluminescence Detection in the Study of Free-Radical Reactions. Part 2. Luminescent Additives that Increase the Chemiluminescence Quantum Yield. Acta Naturae 14(1): 31-39.
-
Yang Y, Jiang Y, Wang X, Han S (2022) Chemiluminescence of Doped Carbon Dots with H2O2-KMnO4 System for the Detection of Cu2+ and Tannin. Spectrochimica Acta, Part A: Molecular and Biomolecular Spectroscopy 279(15): 121434.
-
Wang D, Yu W, Jiang B, Zeng T, Song D, et al. (2023) A Novel Chemiluminescent Method for Efficient Evaluation of Heterogeneous Fenton Catalists Using Cigarette Tar. Toxics 11(1): 30.
-
Haynes WM (2016) Handbook of Chemistry and Physics. 97th (Edn.), Boca Raton, CRC Press, pp: 2670.
- Sense, Gravity, Parity & Chirality in Mathematical Physics
- Quantum Lattice Simulations PHYSICS: Microcircuit Particle Formation and Observable Macroscopic Irreversible Time - A Discrete Lagrangian with Cellular Automata Framework
- Quantum Biology from Biomacromolecule to Cell, and Central Dogma Described by Quantum Theory
- Focus, Agility, Speed and Technology (FAST) for Sustainability and Growth
- Square Root Metric Geometry and Pati-Salam Model in Curved Space-Time
- A Simple System Demonstrating the Mpemba Effect in Classical Mechanics