Development and Validation of Three Different UV Spectrophotometric Methods for Determination of New Antifungal Combination Used in Treatment of External Fungal Infections and Their Comparison Using ANOVA
Luliconazole and Terbinafine hydrochloride combination is used for external fungal infections and is newly introduced in market. Hence it is necessary to develop a appropriate method of analysis for rapid and accurate determination of these drugs. Three simple, sensitive, accurate, precise and economical UV-spectrophotometric methods (A,B,C) have been developed for simultaneous estimation of Luliconazole and Terbinafine hydrochloride in their pharmaceutical dosage form and their comparison by ANOVA. Method (A) is well based on first order derivative spectrophotometric method, in which zero crossing points for Luliconazole is 249.50 nm and Terbinafine hydrochloride is 258.50 nm. Linearity was found in range of 3-18 μg/ ml for both the drugs using methanol as a common solvent. Method (B) is constructed on the principle of dual wavelength method using absorbance difference at 281 and 306 nm for Luliconazole & 262 and 296 nm for Terbinafine hydrochloride. Method (C) is based on norm of Q-absorbance ratio method where iso-absorptive point was obtained at 250 nm and the λ max selected was of Terbinafine hydrochloride 282 nm. The developed methods were validated as per ICH guideline. Accuracy and precision of methods were determined and validated. All the developed methods showed good reproducibility and recovery with % RSD <2. These three methods developed were compared using one way ANOVA and the fcal value was found to be less than ftab value indicating that there is no significant difference in the assay results of the three methods. All three methods were found to be rapid, specific, precise and accurate and found no interferences from the cream excipients so it can be used for routine investigation of both drugs in quality control laboratories.
Introduction
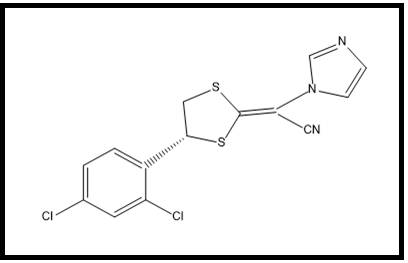
Luliconazole (LULI) is chemically named as (2E)-2-[(4R)- 4(2,4-dichlorophenyl)-1,3-dithiolan-2-ylidene]-2-imidazol- 1ylacetonitrile (Figure 1) and act as a broad-spectrum imidazole that is active against various fungi including tinea, candida, aspergillus, trichophyton and epidermophyton.
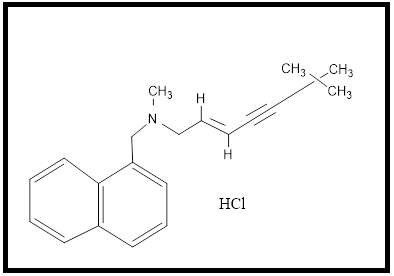
Molecular weight of LULI is 354.28 g/mol.and molecular formula C14H9Cl2N3S2. LULI is an imidazole drug and act as fungistatic by inhibiting the enzyme Lanosterol demethylase in fungal cell membrane [1, 2, 3]. Terbinafine hydrochloride (TERB) is an ally amine antifungal chemically known [(2E)- 6, 6-dimethylhept-2-en-4-yn-1-yl](methyl)[(naphthalen- 1-yl)methyl] amine (Figure 2) and act against tinea pedis, tinea cruris, tinea corporis. Molecular weight of TERB is 291.43 g/mol and molecular formula C21H25NCl. TERB is a fungicidal drug acts by inhibiting squalene mono-oxygenase, thus blocking the biosynthesis of ergo sterol, in fungal cell membrane [4, 5, 6]. LULI and TERB in combination are used in treating topical fungal infections. The deep literature survey revealed that various types of spectrophotometric and chromatographic methods are available for estimation of LULI [7, 8, 9, 10, 11] and TERB [12, 13, 14, 15, 16] alone or in combination with some other drugs like Beclomethasone propionate [17], Mometasone furoate [18] and Clarithromycin [19]. Literature survey also showed that there no reported method available for the analysis of both drugs in combined dosage form. Therefore a simple, rapid, accurate and reliable method for simultaneous estimation of LULI and TERB seemed to be necessary. Spectrophotometric methods of analysis are simpler and economic than in comparison with chromatographic and electrophoretic methods. Purpose of this research was to develop and validate both drugs concurrently by simple, accurate, rapid and precise first derivative spectrophotometric, dual wavelength and Q-absorbance assays for routine analysis [20].
Materials
Reagents and Chemicals
LULI and TERB API were obtained from Luxica Pharma, Bharuch, Gujarat. Marketed formulation (Cream) containing 1% w/w of LULI and 1% w/w of TERB were purchased from local pharmacy. Reagents, glassware and instruments were provided by Pioneer Pharmacy Degree College, Vadodara, Gujarat, India.
Instrumentation and Apparatus
A double beam UV-Visible Spectrophotometer (UV-1800 Shimadzu, Japan) with software UV-probe 2.33, with spectral slit width of 2 nm, wavelength accuracy of 0.5 nm and a pair of 1cm matched quartz cuvettes was used to measure absorbance. All weights were taken on an electronic balance (ATX 224 Shimadzu, Japan). Volumetric flasks and pipettes of borosilicate glasses were used in the experiments.
Selection of Common Solvent
Selection of solvent was done on the basis of assessment of solubility of LULI and TERB in different solvents like methanol, water, chloroform etc. analytical grade of methanol was selected as a common solvent for method development.
Preparation of Solutions
Standard stock solution of each drug was prepared by accurately weighing 10 mg of LULI and 10 mg of TERB transferred into100 ml separate volumetric flasks, dissolving with small amount of methanol and diluted up to the mark with methanol. This solution gave (100 µg/ml of each LULI and TERB).
Wavelength Selection
Dilution of standard drug working solution with methanol, solution containing 10 μg/ml of LULI and 10 μg/ ml of TERB were scanned in the range of 200-400 nm. The λmax was found to be 296 nm and 282 nm for LULI and TERB, respectively.
Methodology
Calibration Curve of LULI and TERB
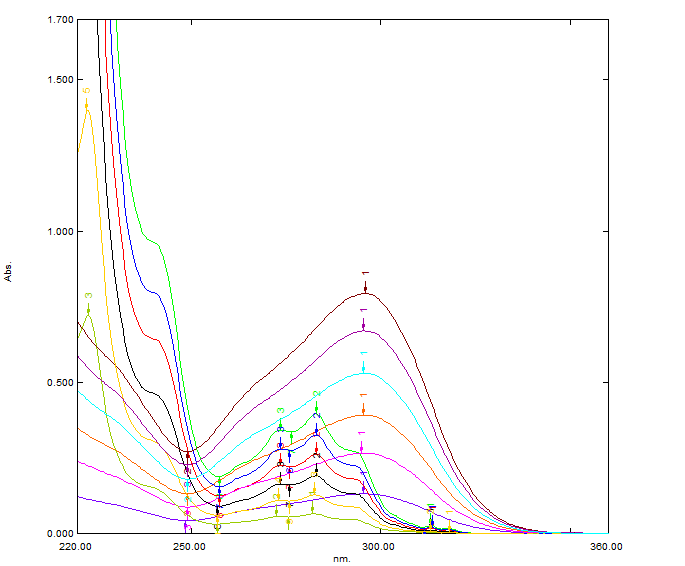
For first order derivative dual wavelength and Q-absorbance spectrophotometric method, accurate aliquots of LULI (3-18 μg/mL) and TERB (3-18 μg/mL) were transferred from its stock solution (100 μg/mL, each drug) in to a series of 10 ml volumetric flask and diluted up to mark with methanol and mix well.
Method A: First Order Derivative Spectroscopic Method
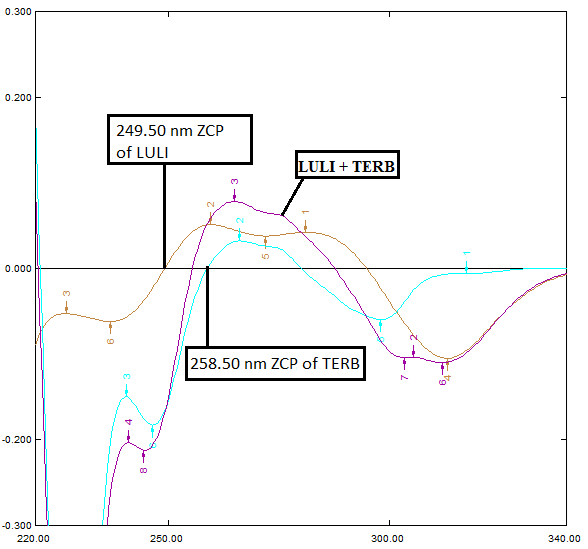
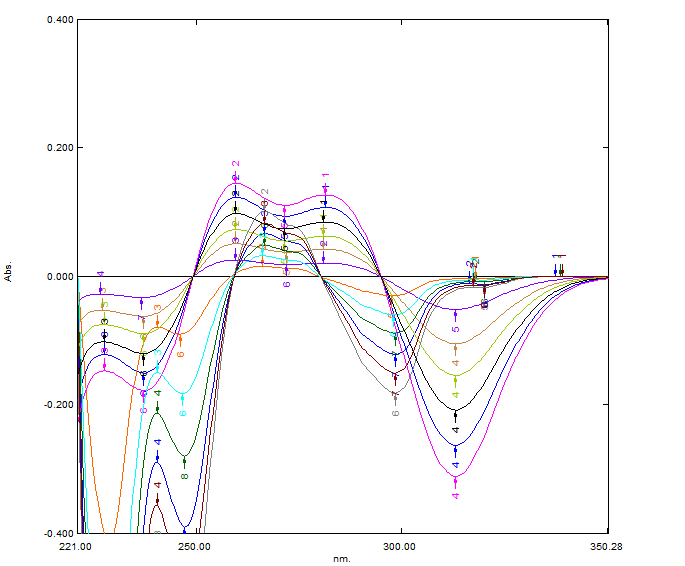
Working solution of LULI 10 µg/ml and TERB 10 µg/ ml were scanned in the range of 200-400 nm, methanol was kept as reference solution. Data were recorded at an interval of 2 nm. The spectra recorded were converted first to fourth order derivative using uv probe software, and these spectra analysed for Zero crossing point (ZCP) of both the LULI and TERB, respectively. The ZCP on the first derivative spectra of one drug, the drug shows the considerable absorbance, these two wavelengths can be employed for the estimation of LULI and TERB without any interference from other drug in cream. Hence, for determination of TERB and LULI two analytical wavelengths were selected 249.50 nm and 258.50 nm respectively. These absorbance’s Vs concentration were plotted in the quantitative mode to obtain the calibration curve from which by extrapolating the value of absorbance’s of the sample solution, the concentration of the corresponding drugs were determined. Both the drugs obeyed Beer’s law.
Spectrophotometric Conditions for First Order Derivative Spectrophotometric
Measurement mode: Spectrum Scan speed: Medium Band width: 1 nm Wavelength range: 200-400 nm δλ: 10000 Scaling factor: 10 ZCP of LULI: 249.50 nm ZCP of TERB: 258.50 nm
Method B: Dual Wavelength Method
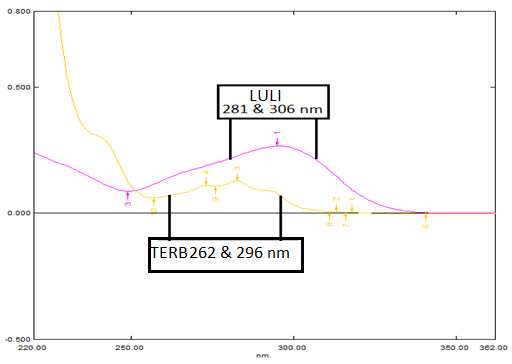
The basic requirement for dual wavelength method is the selection of two such wavelengths where interfering component shows same absorbance whereas the component of interest shows significant difference in absorbance with concentration. Working solution of LULI and TERB 10 µg/ml were scanned in UV between 200-400 nm. Two wavelengths form each drug were selected from the overlain zero order spectra of respective drugs on which estimation shall be done. For LULI two wavelengths that are 281 nm and 306 nm was selected. The absorbance difference of LULI was zero but TERB has shown some significant absorbance difference at 281 nm and 306 nm. The absorbance difference of TERB was zero but LULI had shown some significant difference at 262 nm and 296 nm. However, the difference obtained from absorbance of LULI and mixture at 262 nm and 296 nm was same. Hence, the estimation of LULI was done by calculating the absorbance difference at 262 nm and 296 nm while estimation of TERB was done by calculating the absorbance difference at 281 nm and 306 nm. Calibration curves were prepared for LULI and TERB by plotting absorbance versus concentration at both wavelengths. Each reading was the average of three determinations.
Method C: Q-Absorbance Ratio Method
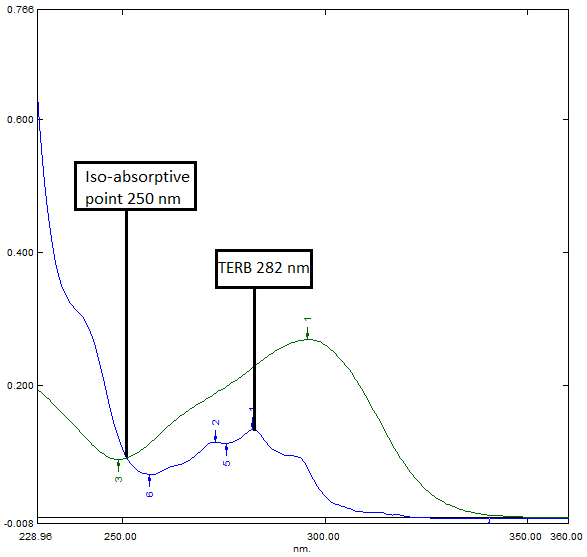
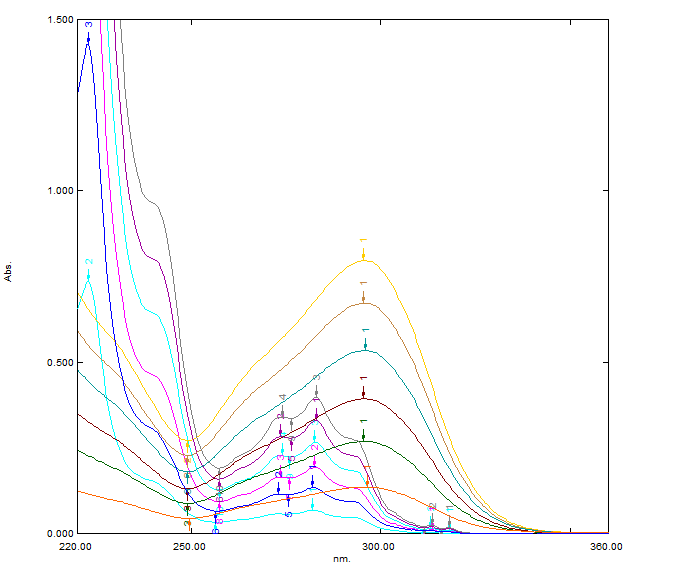
Q-absorbance ratio method uses the ratio of absorbance at two particular wavelengths, one which is the isoabsorptive point and another is the λ-max of one of the two components. Solution of 10 µg/ml of both drugs were prepared and scanned in the range of 200-400 nm against methanol as blank. The overlain spectra were obtained to determine isoabsorptive point. The iso-absorptive point was observed at 250 nm. And the other wavelength selected was 282 nm λ max of TERB and the concentration of each component was calculated as per equation Cx = (Qm-Qy / Qx-Qy)*A / a1 Cy = (Qm-Qx / Qy-Qx)*A / a2 Where, Cx and Cy are concentration of x and y respectively, A is absorbance of sample at isoabsorptive point, a1and a2 are absorptivity of x and y, respectively at isoabsorptive point, Qm = Absorbance of sample solution at λmax of one of the drug Absorbance of sample solution at isoabsorbtive point Qx = Absorbtive of x at λmax of one of the components Absobtivity of x at isoabsorbtive point Qy = Absorbtivity of y at λmax of one of the components Absorbtivity of y at isoabsorbtive point
Analysis of LULI and TERB in Cream
For estimation of LULI and TERB in pharmaceutical cream formulation equivalent to 10 mg of drug was taken and 30 ml of methanol was added to dissolve the drug content. This solution was sonicated for 10 minutes and filtered with watt man filter paper to get clear solution. The volume of filtrate was make up to the mark with methanol in 100 ml volumetric flask and from this stock further working solution of 12 µg/ml (which contains 12 mcg/ml of each drug LULI & TERB) was made by pipetting out 1.2 ml of stock solution transferred into 10 ml volumetric flask and was diluted up- to the mark with methanol. These solutions were scanned according to the wavelength selected in different methods. Absorbance obtained from three methods was put into their respective calibration curve equations and concentration is obtained. From this obtained concentration, % label claim was found.
Validation Parameters
Validation was carried out according to ICH guideline (ICH Q2 (R1), 2005.
Accuracy
The accuracy of the developed methods is to be studied by checking the interference of excipients present in the pharmaceutical dosage forms, it is also known as recovery a study which is done by standard addition method. The study was done by addition of known amounts of standard LULI and TERB to identified concentration of sample aliquot. These added amounts were recovered and further calculated in as % recovery with upper and lower limits of relative standard deviation (% RSD).
Precision/ Repeatability
Precision of the proposed methods was checked by scanning solutions (n=6) of LULI and TERB repeatedly, without changing the parameters and measuring their absorbance.
Intermediate Precision
For the developed methods Intraday and Interday precisions were measured in terms of % RSD. For intraday precision experiment was repeated for 3 different time intervals in a day where as for interday precision experiments were repeated for 3 consecutive days. The results for both were reported in terms of % RSD.
Limit of Detection (LOD) & Limit of Quantitation (LOQ)
LOD & LOQ for the methods were calculated by using formulas 3 X s/m for Limit of detection and 10X s/m for Limit of quantitation. Whereas s= standard deviation of intercept (n=6) and m = slope of the conforming calibration curve.
Analysis of Variance (ANOVA)
ANOVA is a statistical method to determine the variance between results produced by developed methods in the simultaneous estimation of LULI and TERB (P < 0.05).
Result and Discussion
Method A: First Order Derivative Spectroscopic Method
This method showed added resolution in terms of ZCP (zero crossing points) shown in the Figures 3 & 4 give details on overlain first order derivative spectra used for the estimation of LULI and TERB. Zero crossing of LULI is at 249.50 nm where TERB can be determined, at 258.50 TERB showed zero crossing where LULI can be determined.
Method B: Dual Wavelength Method
Figures 5 & 6 shows the four selected wavelengths two for each drug where the drugs showed zero absorbance difference and their overlain spectra. Hence these wavelengths were used each other drugs by preparing calibration curves of absorbance difference for each drug.
Method C: Q-Absorbance Ratio Method
Isoabsorptive point and the λ max selected, along with their overlain spectra were shown in Figures 7 & 8. 250 nm was found to be isoabsorptive point where the both drugs showed same absorbance. Calibration curve were plotted by taking absorbance for each drug on the selected λ max and for both drugs on isoabsorptive point. Results of assay, accuracy studies and summary of validation parameters are described in Tables 1-3 respectively.
| Formulation | Method | Label claim (mg) | Amount of drug found (mg) | % Label claim Assay (n=6)±SD | |||
|---|---|---|---|---|---|---|---|
| LULI | TERB | LULI | TERB | LULI | TERB | ||
| Cream | Method A | 100 | 100 | 99.61 | 99.78 | 99.6 ±1.44 | 99.7 ±0.63 |
| Method B | 99.66 | 100.16 | 99.6 ± 0.70 | 100.1 ±1.06 | |||
| Method C | 99.16 & 99.33 | 99.66&100.66 | 99.1 ± 1.47& 99.3 ± 1.45 | 99.6 ± 1.85 & 100.6 ± 1.50 |
Table 1: Assay results for cream formulation using the proposed methods.
| Drugs | Amount present (µg/ml) | Amount added (µg/ml) | Total amount of drug (µg/ml) | Amount found (µg/ml) | % Recovery ± SD (n=3) | % RSD | |
|---|---|---|---|---|---|---|---|
| Method A | LULI | 6 | 3 | 6 | 8.98 | 99.66 ± 0.21 | 0.21 |
| Method A | LULI | 6 | 6 | 12 | 11.98 | 99.92 ± 1.2 | 1.28 |
| Method A | LULI | 6 | 9 | 15 | 14.98 | 99.95 ± 0.78 | 0.78 |
| Method A | TERB | 6 | 3 | 6 | 8.83 | 99.67 ±1.07 | 1.07 |
| Method A | TERB | 6 | 6 | 12 | 11.79 | 99.14 ±0.53 | 0.54 |
| Method A | TERB | 6 | 9 | 15 | 14.83 | 99.91 ± 0.89 | 0.89 |
| Method B | LULI | 6 | 3 | 6 | 8.96 | 99.30 ± 0.82 | 0.83 |
| Method B | LULI | 6 | 6 | 12 | 11.96 | 99.51 ± 1.25 | 1.25 |
| Method B | LULI | 6 | 9 | 15 | 14.93 | 99.33 ± 0.83 | 0.84 |
| Method B | TERB | 6 | 3 | 6 | 8.96 | 99.78 ± 0.17 | 0.18 |
| Method B | TERB | 6 | 6 | 12 | 11.93 | 99.33 ± 0.89 | 0.9 |
| Method B | TERB | 6 | 9 | 15 | 14.97 | 99.96 ±0.26 | 0.26 |
| Method C | LULI | 6 | 3 | 6 | 8.98 | 99.75 ± 0.47 | 0.47 |
| Method C | LULI | 6 | 6 | 12 | 11.97 | 99.60 ± 0.45 | 0.45 |
| Method C | LULI | 6 | 9 | 15 | 14.99 | 99.93 ± 0.62 | 0.62 |
| Method C | TERB | 6 | 3 | 6 | 8.99 | 99.71 ± 0.69 | 0.69 |
| Method C | TERB | 6 | 6 | 12 | 11.98 | 99.68 ± 0.80 | 0.8 |
| Method C | TERB | 6 | 9 | 15 | 14.98 | 99.86 ± 0.27 | 0.27 |
| Method C | LULI & TERB at 250 nm | 6 | 3 | 6 | 8.94 | 99.31 ± 0.66 | 0.67 |
| Method C | LULI & TERB at 250 nm | 6 | 6 | 12 | 11.91 | 99.31 ± 0.79 | 0.8 |
| Method C | LULI & TERB at 250 nm | 6 | 9 | 15 | 14.91 | 99.47 ± 0.17 | 0.17 |
Table 2: Application of the standard addition technique for recovery studies to the analysis of LULI and TERB in tablets by the p
| Parameters | Method A | Method B | Method C | ||||
|---|---|---|---|---|---|---|---|
| LULI | TERB | LULI | TERB | LULI | TERB | LULI & TERB | |
| Working wavelength (nm) | 258.5 | 249.5 | Absorbance difference at 262 &296 | Absorbance difference at 281 & 306 | 282 | 282 | 250 |
| Concentration range(μg/ml) | Mar-18 | Mar-18 | Mar-18 | Mar-18 | Mar-18 | Mar-18 | Mar-18 |
| Regression equation | y = 0.0079x + 0.002 | y = 0.0312x - 0.0238 | y = 0.0203x + 0.0003 | y = 0.0185x + 0.0017 | y = 0.0372x + 0.003 | y = 0.0217x - 0.0014 | y = 0.016x - 0.0059 |
| Correlation coefficient(r2) | 0.9998 | 0.9991 | 0.9995 | 0.9996 | 0.9998 | 0.9997 | 0.9998 |
| mean of slope | 0.0079 | 0.0237 | 0.0203 | 0.0185 | 0.0371 | 0.021749 | 0.016 |
| SD of intercept | 0.0002 | 0.0001 | 0.000289 | 0.00263 | 0.00015 | 0.00142 | 0.00063 |
| LOD(μg/ml) | 0.083 | 0.0138 | 0.0469 | 0.469 | 0.0133 | 0.066 | 0.129 |
| LOQ(μg/ml) | 0.253 | 0.042 | 0.142 | 1.421 | 0.04 | 0.2 | 0.393 |
| Precision | |||||||
| Repeatability(n=6) %RSD | 1.92 | 0.98 | 1.75 | 1.55 | 0.66 | 0.77 | 0.98 |
| Intraday(n=3) %RSD | 0.59 - 1.16 | 0.971.14 | 1.071.67 | 0.67-1.80 | 0.230.89 | 0.43-0.65 | 0.90-1.21 |
| Intrday(n=3) %RSD | 1.21-1.60 | 0.571.57 | 0.461.11 | 0.67-1.47 | 0.781.34 | 0.74-1.79 | 0.54-0.66 |
Table 3: Summary of validation parameters of developed methods.
Statistical Comparison of Results Obtained from the Three Developed Methods
A, B and C methods were compared using one-way analysis of variance (ANOVA) and as a conclusion there was no significant difference was found between the methods, as the Fcal value was found less than Ftab. The results of one-way ANOVA are given in Tables 4 & 5.
| Source of Variation | SS | df | MS | F calculated | P-value | F tabulated |
|---|---|---|---|---|---|---|
| Between Groups | 0.033 | 2 | 0.016539 | 0.201092 | 0.820007 | 3.68232 |
| Within Groups | 1.2336 | 15 | 0.082246 | |||
| Total | 1.2667 | 17 | - | |||
| Between Groups | 0.0206 | 2 | 0.010339 | 0.09686 | 0.908246 | 3.68232 |
| Within Groups | 1.6011 | 15 | 0.10674 | |||
| Total | 1.6217 | 17 | - |
Table 4: One way ANOVA of LULI.
Conclusion
Three spectrophotometric methods (first derivative spectroscopic, dual wavelength and Q-absorbance ratio) were developed for simultaneous estimation of LULI and TERB in their combined pharmaceutical formulation. The methods were found to be precise and accurate as can be reflected from validation data and were successfully applied for estimation of LULI and TERB in formulation. The one-way ANOVA results show that there is no significant difference between assay results obtained from these three methods. Hence the proposed methods can be used in routine analysis of LULI and TERB with relatively less expensive and simple to operate instrumentation.
Acknowledgements
Authors express their sincere thanks to, Luxica Pharma, Bharuch for providing the API of Luliconazole and Terbinafine hydrochloride. Authors also extend their thanks to the management, Pioneer Pharmacy Degree College, Vadodara for providing the facilities to carry out the present work.
References
-
Patel S, Pawar S, Jain V (2019) A brief review on Luliconazole: an antifungal agent. World Journal of Pharmacy and Pharmaceutical Sciences, pp: 700-702.
-
Luliconazole (2019) Drug profile of Luliconazole.
-
Luliconazole (2019) Medically reviewed by Drugs.com.
-
Terbinafine (2019) Drug profile of Terbinafine.
-
Terbinafine (2019) Terbinafine hydrochloride.
-
Tripathi KD (2007) Essentials of Medical Pharmacology 6th (Edn.), Jaypee Brother’s Medical Publishers (P) Limited.
-
Patel P, Pawar SP (2019) Development and validation of UV spectrophotometric and RP-HPLC methods for estimation of Luliconazole in bulk and gel formulation. World Journal of Pharmacy and Pharmaceutical Sciences 8(7): 709-729.
-
Majumder T, Hasan R, Roy P, Ratan P, Nazmul Hasan Md (2019) Method development and validation of RP- HPLC method for estimation of Luliconazole in marketed formulation (cream). The Pharma Innovation Journal 8(5): 103-108.
-
Kumar M, Shanthi N (2018) Qualitative and quantitative methods for determination of drug Luliconazole. International Journal of Research in Advent Technology 6(10): 2764-2769.
-
Malasiya A, Goyal A (2017) Method development and validation of RP HPLC method for assay and related substances of Luliconazole in topical dosage form. International Journal of Pharmaceutical Chemistry and Analysis 4(2): 46-50.
-
Maha SA, Abou El-Alamin MM, Mostafa AA, Aboul- Enein HY (2017) Stability indicating methods for the determination of Luliconazole by TLC and HPTLC- densitometry in bulk powder and cream dosage form. Journal of Planar Chromatography 30(1): 1.
-
Sireesha R, Vijayakar RPS, Kumar VP, Sivagami B, Sikdar P, et al. (2018) RP-HPLC method development and validation for the estimation of antifungal drug Terbinafine HCl in bulk and pharmaceutical dosage form. International Journal of Research in Pharmaceutical Chemistry and Analysis 1(1): 8-12.
-
Qarah N, Basavaiah K, Swamy N (2016) Ion pair extractive spectrophotometric assay of Terbinafine hydrochloride in pharmaceuticals and spiked urine using bromocresol purple. Journal of Applied Spectroscopy 83(4): 694-695.
-
Goswami P (2013) Validated spectrophotometric method for estimation of Terbinafine hydrochloride in bulk and in tablet dosage form using inorganic solvent. Der Pharmacia Lettre 5(3): 386-390.
-
Patel K (2012) A validated RP-HPLC method for determination of Terbinafine hydrochloride in pharmaceutical solid dosage form. International Journal of Pharmacy and Technology 4(3): 4663-4669.
-
Patel K, Karkhanis V (2012) A validated HPTLC method for determination of Terbinafine hydrochloride in pharmaceutical solid dosage form. International journal of pharmaceutical sciences and research 3(11): 4492- 4495.
-
Keriwala TM (2019) Development and Validation of simultaneous UV spectroscopy method for Luliconazole and Beclomethasone Dipropionate in combined pharmaceutical dosage form. International Journal of Pharmaceutical Sciences 10(1): 93-107.
-
Patel M, Patel H (2014) Development and validation of RP-HPLC method for simultaneous estimation of Terbinafine hydrochloride and Mometasone furoate in combined dosage form. International Journal of Pharmacy and Pharmaceutical Sciences 6(1):106-109.
-
Rao R (2018) UV spectrophotometric analysis of drugs Terbinafine hydrochloride and Clarithromycin. Modern Chemistry & Applications 6(2): 1-5.
-
ICH Q (R1) (2005) Harmonized tripartite guideline, Validation of analytical procedures: text and methodolo y, International Conference on Harmonization ICH, Geneva.
- Gallic and Citric Acid Present in the Peels of Tropical Fruits as an Alternative in the Fight against Cancer
- Treating the Forehead Lines with Combination of Forehead and Glabellar Botulinum Toxin Among Japanese Patients
- Clinical Evaluation of Patients Suffering from Breast Cancer & Determination of Treatment Therapies and Better Strategies Related to Breast Cancer
- Medieval Recipes by Al-Zahrāwī for Heart Palpitations Treatment
- Etiology and Prescription Errors of Myocardial Infarction in Different Health Care Systems of Azad Kashmir
- Early Diagnosis and Multidisciplinary Management of Turner Syndrome: A Paediatric Case Study