Resolution, SNR, Signal Averaging and Scan Time in MRI for Metastatic Lesion in Spine: A Case Report in a 74 Years Old Patient
Background: MRI image quality is compromise between resolution, scan time, Signal Averaging (NSA/NEX.), SNR and Integrated parallel acquisition technique (SENSE). Any compromise in any of these parameters can lead to poor quality images that can lead to misdiagnosis. The higher the image resolution, the better the small pathologies can be diagnosed, thus it is the goal of imaging a good quality scan by using a standardized protocols. Methods: The study was conducted in Department of Medical Imaging, Medcare International Hospital, Gujranwala, Pakistan, Gujranwala Institute of Nuclear Medicine & Radiotherapy (GINUM), Gujranwala, Pakistan. Case Presentation: We present a case of 74 year old man with severe lower back pain. His initial MRI did not reveal any significant pathology; however a repeat MRI revealed metastatic involvement of the lumbar vertebrae. Conclusion: Standardized MRI protocols have been developed after much study to optimize all the parameters. Any modification in the protocols to reduce image time is therefore hazardous. It is therefore imperative that they be followed in order to avoid generating suboptimal images.
Waseem Zafar1,2*, Ahmed Masood2, Basit Iqbal1 and Sohail Murad1
Radiotherapy, Pakistan
Road, Nizampur, Gujranwala, Pakistan, Tel: +92 (300) 4576755; Email: waseem_mt@yaoo.com thus it is the goal of imaging a good quality scan by using a standardized protocols.
Pakistan, Gujranwala Institute of Nuclear Medicine & Radiotherapy (GINUM), Gujranwala, Pakistan.
in order to avoid generating suboptimal images.
Introduction
Resolution is the ability of human eyes to distinguish one structure from other. In MRI the resolution is Resolution, SNR, Signal Averaging and Scan Time in MRI for Metastatic Lesion in Spine: A Case Report in a 74 Years Old Patient determined by the number of voxels in a specified FOV. The higher the image resolution, the better the small pathologies can be diagnosed. Resolution is directly proportional to the number of voxels. Voxel size can be calculated by dividing the FOV by the matrix size (e.g. FOV 320, Matrix 320x320, voxel size is 320/320=1mm). There are two resolution parameters used in MRI for the production of a 2D image i.e. basic resolution & phase resolution [1, 2].
Clin Radiol Imaging J
Basic Resolution
Basic resolution is the number of voxels in redout direction. Basic resolution determines the size of the image matrix. Basic resolution is inversely proportional to the size of the voxel [2].
SNR is inversely proportional to the basic resolution. In other words SNR is directly proportional to the voxel size, increasing the base resolution will reduce the voxel size therefore the SNR of the image [3, 4] will be reduced (Figure 1).
SNR & Basic Resolution
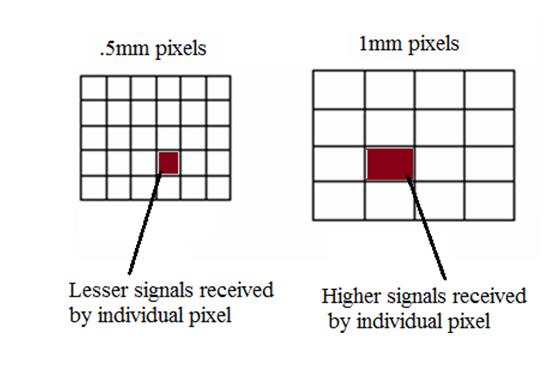
If we compare a 256x256 and 128x128 matrix formats, the voxel size of 128 (2x2mm) matrix is four times larger than the 256(1x1mm) matrix but there are only half phase encoding steps. Therefore the SNR is calculated by 4√2= 2.82 (Table 1).
| Matrix | Relative SNR |
|---|---|
| 128x128 | 2.82 (1x2.8=2.82) |
| 256x256 | 1 |
| 512x512 | 0.35 (1/2.82=3.5) |
Table 1: Relationship between Matrix size and SNR
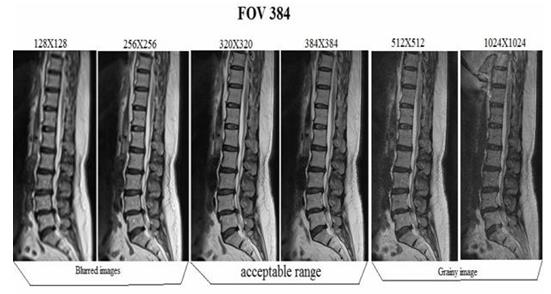
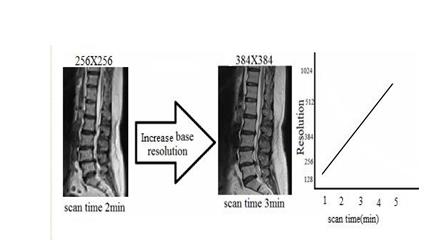
Increasing the basic resolution will increase the image quality. Increasing the resolution more than the acceptable range will produce noisy or grainy image due to low SNR and reducing the basic resolution more than the acceptable range will produce a blurry image due to high SNR [4]. Increasing the basic resolution will result in a prolonged scan time. Ways to improve a low resolution / blurred image. Improvement in scan time leads to a higher resolution and sharper images (Figure 2).
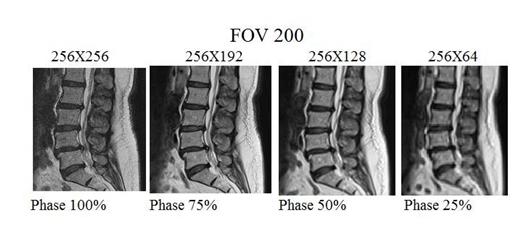
SNR & Phase Resolution
Decreasing the phase resolution will reduce the image quality and scan time. Reducing the phase resolution will increase the voxel size therefore the SNR will increase considerably (Figures 4 & 5, Table 2).
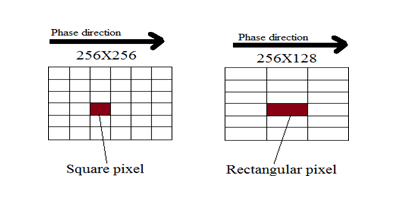
| FOV readout | FOV phase | Phase resolution | Matrix Size | Pixel (mm) |
| 256 mm | 100% | 100% | 256x256 | 1x1 |
| 256 mm | 100% | 75% | 256x192 | 1x1.33 |
| 256 mm | 100% | 50% | 256x128 | 1x2 |
| 256 mm | 100% | 25% | 256x64 | 1x4 |
Table 2: Demonstrates a relationship between SNR and Phase resolution.
Signal Averaging
A signal to noise improvement method that is accomplished by taking the average of several FID`s made under similar conditions to suppress the effects of random variations or random artifacts. It is a common method to increase the SNR by averaging several measurements of the signal. The number of averages is also referred to as the number of excitations (NEX) or the number of acquisitions (NSA). Doubling the number of acquisitions will increase the SNR by the √2. The approximate amount of improvement in signal to noise (SNR) ratio is calculated as the square root of the number of excitations [5].
By using multiple averages, respiratory motion can be reduced in the same way that multiple averages increase the signal to noise ratio. NEX/NSA will increase SNR but will not affect contrast unless the tissues are being lost in noise (low CNR). Scan time scales directly with NEX/NSA and SNR as the square root of NEX/NSA. The use of phase array coils allows the number of signal averages to be decreased with their superior SNR and resolution, thereby decreasing.
Sense (IPAT)
With SENSE, two or more coil elements acquire imaging data simultaneously, enabling a scan time reduction by a factor of up to the number of coil elements used. The major negative point of parallel imaging techniques is that they diminish SNR in proportion to the numbers of reduction factors [4]. R is the factor by which the number of k- space samples is reduced. In standard Fourier imaging reducing the sampling density results in the reduction of the FOV, causing aliasing. As long as the actual phase percentage is close to the requested phase percentage, the resulting image will be fine. The difference can increase when higher TFE-factors are used, and in that case you might need to tune the sequence (change number of phases, spatial resolution and/or SENSE factor) to avoid that the actual phase percentage is much lower than the requested phase percentage: this could lead to increased temporal blurring.
Parameters Benefits and Trade-offs
The relationships between MR imaging parameters are complex. The table shows the effects of increasing or enabling a parameter (set to "Yes") on scan time, resolution, signal-to-noise ratio (SNR) and artifact level for some parameters (Table 3).
↓ lower, ↑ higher, = unchanged, • more information available in following Table
Parameter Scan time Resolution SNR Artifacts NSA ↑ = ↑ ↓ REST ↑ = = ↓ Voxel Size ↓ ↓ ↑ ↑/↓
FOV (In combination with fixed matrix size)*
$$ \begin{array}{l} = \downarrow \uparrow = \\ \uparrow \\ \end{array} $$
FOV (In combination with fixed voxel size)*
↑ = ↑ =
Rectangular FOV (%)
↑ = ↑ =
| Parameter | Scan time | Resolution | SNR | Artifacts |
| Scan Percentage (%) | ↑ | ↑ | ↓ | = |
| Slice thickness | = | ↓ | ↑ | = |
| Scan Matrix | ↑ | ↑ | ↓ | = |
| Halfscan | ↓ | = | ↓ | ↑ |
| SMART | = | = | = | ↓ |
| Water Fat Shift | = | = | ↑ | ↑ |
| 3D Slices | ↑ | = | ↑ | = |
| SE Flip Angle | = | = | ↓ | = |
| Flowcomp FFE, TSE | = | = | ↓ | ↓ |
| Flowcomp SE | = | = | = | ↓ |
| Partial Echo | = | = | ↑/↓ | ↑/↓ |
| SPIR/ProSet | ↑ | = | = | ↓ |
| SENSE | ↓ | = | ↓ | = |
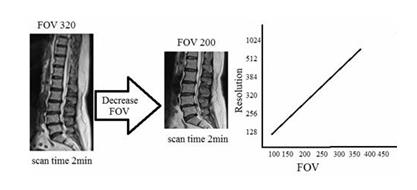
The effect of parameter FOV can differ depending on the way of working: you can either adjust the Matrix size or the voxel size. The table illustrates the effects.
| Way of working | FOV | Scan matrix | Pixel size | TE | TR | Scan time | SNR |
| Matrix size | ↓ | = | ↓ | ↑1) | ↑2) | ↑ | ↓3) |
| Voxel size | ↓ | ↓ | = | = | = | ↓ | ↓4) |
Table 4: Parameters benefits and trade-offs.
Instrumentation
MRI Systems
- Achieva (Philips) 1.5 T
- Magnetom-C (SIEMENS) 0.35T
Objective
The study is designed with following objectives: a) To detect the malignant lesions in spine by using standard protocols to obtain good quality images? b) How system optimization can influence the delectability, sensitivity and reliability of an imaging system of MRI?
Methods
The study was conducted in Department of Medical Imaging, Medcare International Hospital, Gujranwala, Pakistan, Gujranwala Institute of Nuclear Medicine & Radiotherapy (GINUM), Gujranwala, Pakistan.
Case Presentation
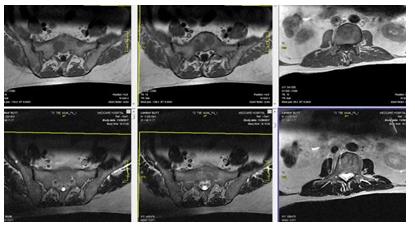
We present the case of a 74-year-old male with a history of severe lower back pain, bony aches, vomiting and abdominal pain. He was referred for an MRI spine from a local hospital to evaluate a suspicious lytic lesion seen on x-ray. Two independent observers observed the both studies separately and gave their comments regarding the MRI studies. A first or previous MRI spine done two weeks earlier (using an Achieva Philips 1.5 Tesla system) had failed to characterize the lesion adequately by the first observer, simply showing intervertebral disc bulges (Figures 6 & 7).
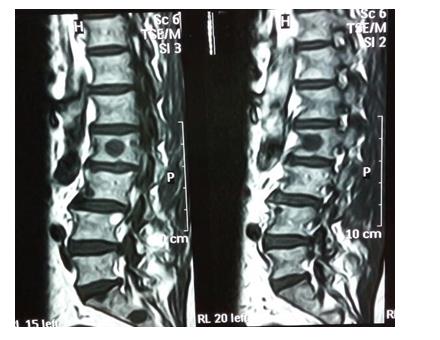
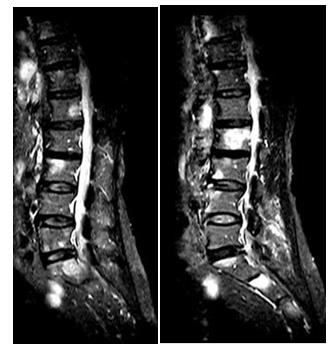
A repeat MRI spine was performed at our institution using a 0.35 Tesla (Magnetom-C (SIEMENS) machine was using standardized protocol. The second scan revealed by second observer metastatic lesions in multiple dorso- lumbar vertebrae (Figures 8-12). Subsequently the earlier MRI was reviewed which also seemed to have similar changes but far less clear. The same was communicated to the referring physician who ordered a CT chest, abdomen & pelvis including biphasic to diagnose the site of primary lesion, which turned out to be cancer of head pancreas. Bony metastatic lesions were subsequently confirmed in bone scan performed at a local nuclear medicine facility by author BI.
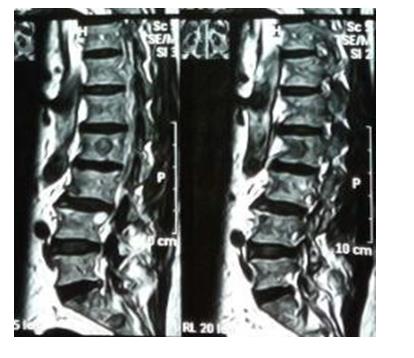
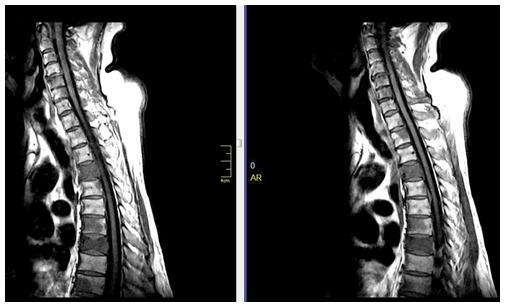
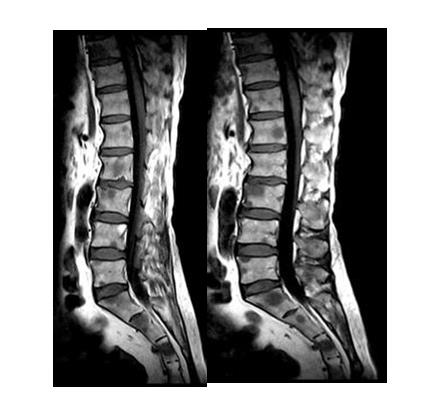
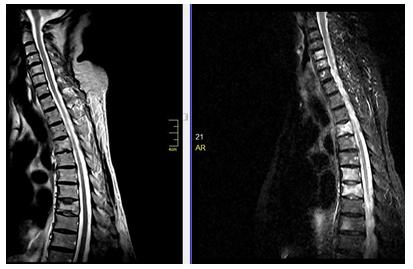
Both the MRI studies were technically analyzed by author WZ to discover the cause of missing metastatic lesions in the first MRI scan. It was observed that the image quality was suboptimal due to a compromise to minimize resolution, SNR, signal averages (NSA, NEX) and also applying SENSE technique to shorten the scan time, due to which there were blurry and poor quality images were acquired and information were lost which lead to misdiagnosis (Tables 5 & 6).
Following were the parameters of T1w sequence used of both MRI modalities
| Sr. No | MRI Systems | Tesla | TR | TE | Scan Time | NSA/NEX (Avg) | Matrix (Base Resolution) | Phase Resolution | Filter | RFOV | Phase FOV | VOXEL Size | Slice Thickness | SENSE | COIL |
| 1 | Achieva (Philips) | 1.5T | 400 | 11 | 1.10 min | 2 | 256 | 70 | Smoothening applied | 309 | 311/11 | 0.6 mm | 4 | SENSE-Spine | Surface coil for spine |
| 2 | Magnetom-C(SIEMENS) | 0.35T | 444 | 18 | 4:18 min | 3 | 320 | 90 | Medium Smoothening applied | 350 | 100 | 0.53 mm | 4.5 | N/A | Phased array surface + body coil |
Table 5: Comparison of Parameters of T2w sequence of both modalities.
| Sr. No | MRI Systems | Tesla | TR | TE | Scan Time | NSA/NEX(Avg) | Matrix(Base Resolution) | Phase Resolution | Filter | RFOV | Phase FOV | VOXEL Size | Slice Thickness | SENSE | COIL |
| 1 | Achieva(Philips) | 1.5T | 2210 | 120 | 1.50 min | 3 | 256 | 70 | mootheing applied | 309 | 311/11 | 0.6 mm | 4 | SENSE-Spine | Surface coil for spine |
| 2 | Magnetom-C(SIEMENS) | 0.35T | 3350 | 135 | 6:30 min | 5 | 320 | 90 | 350 | 100 | 0.53 mm | 4.5 | N/A | Phased array surface + body coil |
Table 6: Comparison of Parameters of T2w sequence of both modalities.
a. Observations by comparing the parameters (Tables 5 &
6) and images (Figures 6-12) of both studies demonstrate that the operator of 1.5T MRI System Achieva (Philips) shorten the scan time by decreasing signal averages (NSA or NEX), matrix size, phase resolution, increasing voxel size and by using IPAT or SENSE technique which leads to poor quality images.
decrease the signal to noise ratio and increasing the respiratory motion artifact which leads to blurry images in 1.5T MRI System Achieva (Philips) (Tables 3,5 & 6).
c. By reduction the matrix size from 320 to 256 & phase resolution to decrease the scan time and also diminish the resolution by increasing the voxel size (Tables 3, 5 & 6).
d. In comparison to 0.35T Magnetom-C (SIEMENS)
scanners, a SENSE (IPAT) technique) has applied to shorten the scan time which also diminished SNR in1.5T MRI System Achieva (Philips) (Tables 5 & 6).
Conclusion
This case illustrates the need for using standard protocols with optimal timing of sequence to obtain good quality images with high resolution within acceptable range of SNR for proper diagnosis of small pathologies and metastatic lesions of spine. Many MRI technologists shorten the scan time by decreasing resolution, SNR, signal averages (NSA or NEX) and by using the SENSE (IPAT) technique which leads to blurry or poor resolution images were acquired and information were lost which lead to misdiagnosis. Continuous CME for technologists is needed to keep them abreast of the latest guidelines and techniques to aware of MRI parameters benefits and trade-offs.
Conflicts of Interest
The authors have no conflicts of interest to disclose.
Consent for Publication
Informed consent was obtained from the patient to publish this case in a medical journal.
Ethical Approval
Ethical approval is not required at our institution for publishing a case report in a medical journal.
References
-
IAEA (2014) Diagnostic Radiology Physics. International Atomic Energy Agency, Vienna.
-
Hashemi RH, WG Bradley, CJ Lisanti (2010) MRI: The Basics. Lippincott Williams & Wilkins, Philadelphia.
-
McRobbie DW, Moore EA, Graves MJ, Prince MR (2006) MRI from Picture to Proton 2nd (Edn), Cambridge University Press, New York.
-
Li BS, Regal J, Gonen O (2001) SNR versus resolution in 3D 1H MRS of the human brain at high magnetic fields. Magn Reson Med 46(6): 1049-1053.
-
Murphy K, Bodurka J, Bandettini PA (2007) How long to scan? The relationship between fMRI temporal signal to noise and necessary scan duration. Neuro Image 34(2): 565-574.
- Ultrasound Guided Therapeutic Nerve Blocks
- Cyclops Lesion Without ACL Reconstruction: A Rare Case in a Patient with Intact Anterior Cruciate Ligament and Tibial Plateau Fracture
- Dosimetric Comparison between Two Dose Calculation Algorithms in SBRT Treatment of Lung Cancer in Ring-based and C-arm Radiation Therapy Equipment
- Adolescent Testicular Adrenal Rest Tumors: A Case Report and Review of the Literature
- Giant Intrathoracic Lipoma: A Rare Presentation
- Image of a Right Renal Angiomyolipoma Complicated by Hemorrhage