3DCT & MPR in Craniofacial Fractures
Aim: This study aimed to evaluate sensitivity of multi planer and 3D of CT image in patients with craniofacial bone fractures. Methodology: Descriptive analytical study was conducted. Patients referred for CT skull examination after trauma and diagnosed with fracture. Result: In this study sample size was (150 patients) and frequency of male was 105 with 70%, female was 45 with 30%. Most bone fracture appear in 3DCT was facial, parietal and temporal with frequency (31),(29),(21) respectively. Most bone fracture appear in axial cut in MPR was facial, parietal and temporal with frequency (30),(28),(22) respectively. Most bone fracture appear in sagittal cut in MPR was parietal, facial and temporal with frequency (32),(29),(11) respectively. Most bone fracture appear in coronal cut in MPR was parietal, facial and temporal with frequency (29),(23),(19) respectively. Conclusion: In evaluation the difference between MPR and 3D images to determining fractures in traumatic patients we found that any depressed fracture appeared in MPR will be clearly appeared in 3DCT,but linear fracture depend on MPR appearance. Recommendations: Specification of bone under study will ease up findings and data acquisition.
Introduction
A CT scan makes use of computer-processed combinations of many X-ray images taken from different angles to produce cross-sectional (tomographic) images (virtual "slices") of specific areas of a scanned object, allowing the user to see inside the object without cutting [1]. Digital geometry processing is used to generate a three-dimensional image of the inside of the object from a large series of two-dimensional radiographic images taken around a single axis of rotation. Medical imaging is the most common application of X-ray CT. Its cross- sectional images are used for diagnostic and therapeutic purposes in various medical disciplines. The rest of this article discusses medical-imaging X-ray CT; industrial applications of X-ray CT are discussed at industrial computed tomography scanning [2].
3D Imaging
Three-dimensional rendering could not have been developed without advances in computer hardware, software, and display technology. Progress has been incremental and often limited by the state of the art in any one of these technologies on which development depends. Despite these constraints, SSD and MIP have remained functional by making use of only about 10% of the available CT data and implementing very simple rendering schemes [3], although this compromise limits the accuracy of rendered images. Volume rendering incorporates the entire data set into a 3D image [4, 5]. Initially, image processing and display was very time consuming: Several hours were required to render an animation loop for viewing. However, recent advances in computer hardware have made volume rendering a practical, interactive technique that allows processing and display to occur in real time (minimum, 5-10 frames/sec) at relatively inexpensive workstations [6].
Literature Review
Imaging of Maxillofacial and Skull Base Trauma
In this study they consider explaining that CT is image of choice for suspected craniofacial fracture, and after they finished decided that analysis with MIPs is a useful addition to obligatory MPRs [7, 8, 9, 10]. A Study of Diagnostic Performance of CT, MPR and 3DCT Imaging in Maxillofacial Trauma In this study they elaborate that CT imaging of complex maxillofacial fractures is common practice now. Sensitivity and specificity were calculated to measure observer performance. It was found that 3D and CT had a similar performance in fracture detection and both were markedly better than MPR. It was concluded that CT and 3D are comparable in detecting midfacial fractures and both are superior to MPR. 3D reconstructions are superior for localization of complex fractures involving multiple planes [11]. A Study of Validity of Multislice Computerized Tomography for Diagnosis of Maxillofacial Fractures Using an Independent Workstation In this study they explain the CT images of 36 patients with maxillofacial fractures (symptomatic to orbit region). The images were interpreted based on 5 protocols, using an independent workstation. All methods evaluated in this study showed high specificity and sensitivity for the diagnosis of orbital fractures according to the proposed methodology. This protocol can add valuable information to the diagnosis of fractures using the association of axial/MPR/3D with multislice CT [12].
Material and Methods
Material
Study design Descriptive analytical study was conducted. Study area and duration: The study was conducted in Khartoum state, included hospitals: a) Ibrahim Malik Hospital b) Yastabshiroon Alkhartoum Hospital c) Al Tamayoz for Emergency Alzaytuona Hospital Study duration: From 2017-June2019 Study population: Patients referred for CT skull examination after trauma and diagnosed with fracture. Sample size and sampling: 150 patients admitted to all previous hospitals. Inclusion criteria: Traumatic patient with a diagnosed craniofacial fracture under CT scan. Exclusion criteria: Craniofacial CT scan diagnosed as normal. Variable under study: Gender, age Side of fracture, Area of fracture, Type of fracture, Visualization in MPR and 3D.
Methods
CT technique of craniofacial imaging Patient position The patient lies supine on the examination couch with their head within the head holder. The head is adjusted so that the enter-papillary line is parallel to the couch and the head is straight, the patient is positioned so that the longitudinal alignment light lies in the midline, and the horizontal alignment light passes through the nasion, straps and foam pads are used for immobilization.
Equipment a) Head holder b) Immobilization foam pads Data Collection Tools and Techniques All data was collected from traumatic patients referred for craniofacial CT examination, and then we used SPSS version 16 to analyze data and represented in tables, pie chart and graphs. Methods of measurements Fractures were visualized under (sagittal, axial and coronal) MPR and 3D images.
Results
| Statistics | |||||
|---|---|---|---|---|---|
| Age | |||||
| N | Valid | 150 | |||
| Missing | 0 | ||||
| Mean | 35.1267 | ||||
| Median | 32.0000 | ||||
| Standard Deviation | 1.58991 E1 | ||||
| Range | 83.00 | ||||
| Minimum | 6.00 | ||||
| Maximum | 89.00 |
Table 1: Shows frequency table for age.
| Gender | ||||||||||||||
|---|---|---|---|---|---|---|---|---|---|---|---|---|---|---|
| Frequency | Percent | Valid Percent | Cumulative Percent | |||||||||||
| Valid | Female | 45 | 30.0 | 30.0 | 30.0 | |||||||||
| Male | 105 | 70.0 | 70.0 | 100.0 | ||||||||||
| Total | 150 | 100.0 | 100.0 |
Table 2: Shows frequency table for gender.
| Bone | ||||||||||||||
|---|---|---|---|---|---|---|---|---|---|---|---|---|---|---|
| Frequency | Percent | Valid Percent | Cumulative Percent | |||||||||||
| Valid | Base of Skull | 12 | 8.0 | 8.0 | 8.0 | |||||||||
| Facial | 34 | 22.7 | 22.7 | 30.7 | ||||||||||
| Facial+Base of Skull | 2 | 1.3 | 1.3 | 32.0 | ||||||||||
| Frontal | 16 | 10.7 | 10.7 | 42.7 | ||||||||||
| Occipital | 16 | 10.7 | 10.7 | 53.3 | ||||||||||
| Parietal | 34 | 22.7 | 22.7 | 76.0 | ||||||||||
| Parietal+Frontal | 2 | 1.3 | 1.3 | 77.3 | ||||||||||
| Parietal+Frontal+Facial | 1 | 0.7 | 0.7 | 78.0 |
Table 3: Shows frequency table for fracture type distribution.
| Temporal | 22 | 14.7 | 14.7 | 92.7 | |
|---|---|---|---|---|---|
| Temporal+Frontal | 1 | 0.7 | 0.7 | 93.3 | |
| Temporal+Parietal | 1 | 0.7 | 0.7 | 94.0 | |
| Temporal+Parietal+Frontal | 9 | 6.0 | 6.0 | 100.0 | |
| Total | 150 | 100.0 | 100.0 |
Table 4: Shows frequency table for fracture type distribution.
| FxType | |||||||||||
|---|---|---|---|---|---|---|---|---|---|---|---|
| Frequency | Percent | Valid Percent | Cumulative Percent | ||||||||
| Valid | Depressed | 90 | 60.0 | 60.0 | 60.0 | ||||||
| Linear | 60 | 40.0 | 40.0 | 100.0 | |||||||
| Total | 150 | 100.0 | 100.0 |
Table 5: Shows frequency table for fracture type distribution.
| Axial | ||||||||||||||
|---|---|---|---|---|---|---|---|---|---|---|---|---|---|---|
| Frequency | Percent | Valid Percent | Cumulative Percent | |||||||||||
| Valid | No | 12 | 8.0 | 8.0 | 8.0 | |||||||||
| Yes | 138 | 92.0 | 92.0 | 100.0 | ||||||||||
| Total | 150 | 100.0 | 100.0 |
Table 6: Shows frequency of axial cut in MPR.
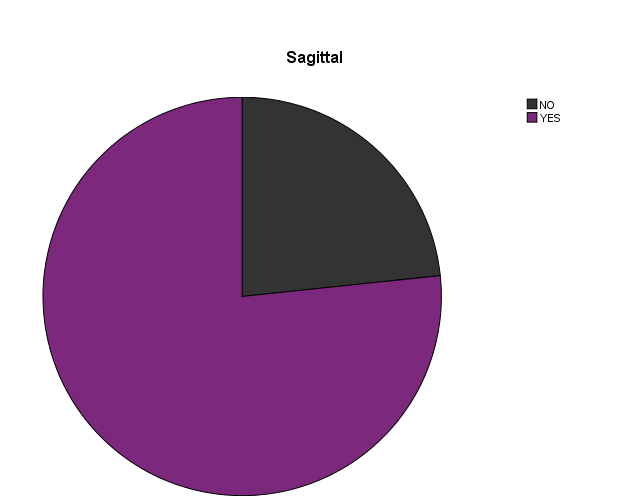
| Sagittal | ||||||||||||||
|---|---|---|---|---|---|---|---|---|---|---|---|---|---|---|
| Frequency | Percent | Valid Percent | Cumulative Percent | |||||||||||
| Valid | No | 35 | 23.3 | 23.3 | 23.3 | |||||||||
| Yes | 115 | 76.7 | 76.7 | 100.0 | ||||||||||
| Total | 150 | 100.0 | 100.0 |
Table 7: Shows frequency of axial cut in MPR.
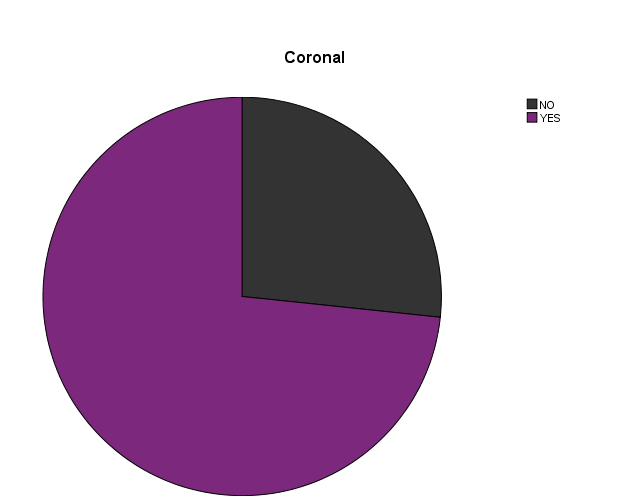
| Coronal | ||||||||||||||
|---|---|---|---|---|---|---|---|---|---|---|---|---|---|---|
| Frequency | Percent | Valid Percent | Cumulative Percent | |||||||||||
| Valid | No | 40 | 26.7 | 26.7 | 26.7 | |||||||||
| Yes | 110 | 73.3 | 73.3 | 100 | ||||||||||
| Total | 150 | 100 | 100 |
Table 8: Shows frequency of coronal cut in MPR.
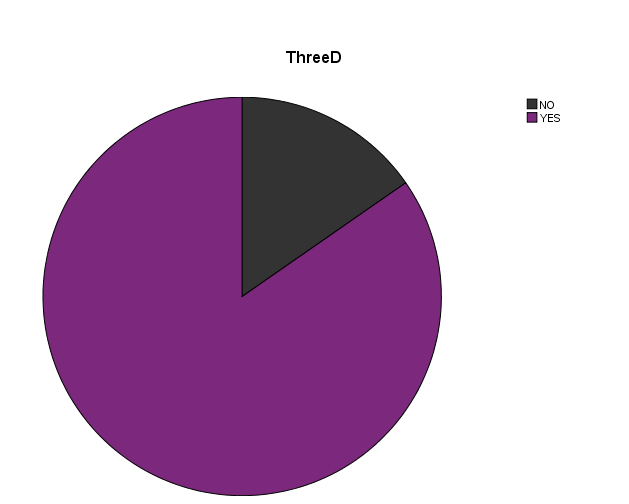
| Three D | ||||||||||||||
|---|---|---|---|---|---|---|---|---|---|---|---|---|---|---|
| Frequency | Percent | Valid Percent | Cumulative Percent | |||||||||||
| Valid | No | 23 | 15.3 | 15.3 | 15.3 | |||||||||
| Yes | 127 | 84.7 | 84.7 | 100 | ||||||||||
| Total | 150 | 100 | 100 |
Table 9: Shows frequency of three dimensions CT.
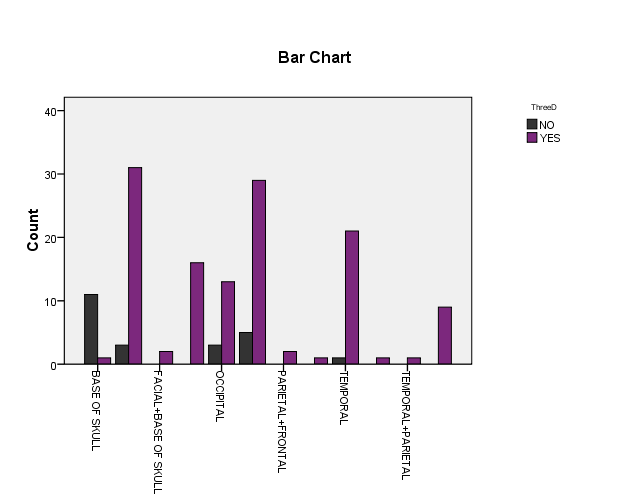
| Bone * Three D Crosstabulation | |||||||
|---|---|---|---|---|---|---|---|
| Count | |||||||
| Three D | Total | ||||||
| NO | YES | ||||||
| Bone | Base of Skull | 11 | 1 | 12 | |||
| Facial | 3 | 31 | 34 | ||||
| Facial+Base of Skull | 0 | 2 | 2 | ||||
| Frontal | 0 | 16 | 16 | ||||
| Occipital | 3 | 13 | 16 | ||||
| Parietal | 5 | 29 | 34 | ||||
| Parietal+Frontal | 0 | 2 | 2 | ||||
| Parietal+Frontal+Facial | 0 | 1 | 1 | ||||
| Temporal | 1 | 21 | 22 | ||||
| Temporal+Frontal | 0 | 1 | 1 | ||||
| Temporal+Parietal | 0 | 1 | 1 | ||||
| Temporal+Parietal+Frontal | 0 | 9 | 9 | ||||
| Total | 23 | 127 | 150 |
Table 10: l Relation between bone and three dimensions CT.
| FxType * Three D Crosstabulation | |||||||
|---|---|---|---|---|---|---|---|
| Count | |||||||
| Three D | Total | ||||||
| NO | YES | ||||||
| FxType | Depressed | 0 | 90 | 90 | |||
| Linear | 23 | 37 | 60 | ||||
| Total | 23 | 127 | 150 | ||||
| FxType * Axial Crosstabulation | |||||||
| Count | |||||||
| Axial | Total | ||||||
| NO | YES | ||||||
| FxType | Depressed | 9 | 81 | 90 | |||
| Linear | 3 | 57 | 60 | ||||
| Total | 12 | 138 | 150 |
Table 11: Relation between fracture type and three dimension CT.
| FxType * Sagittal Crosstabulation | |||||||
|---|---|---|---|---|---|---|---|
| Count | |||||||
| Sagittal | Total | ||||||
| NO | YES | ||||||
| FxType | Depressed | 9 | 81 | 90 | |||
| Linear | 26 | 34 | 60 | ||||
| Total | 35 | 115 | 150 |
Table 12: Relation between fracture type and sagittal cut in MPR.
| FxType * Coronal Crosstabulation | |||||||
|---|---|---|---|---|---|---|---|
| Count | |||||||
| Coronal | Total | ||||||
| NO | YES | ||||||
| FxType | Depressed | 11 | 79 | 90 | |||
| Linear | 29 | 31 | 60 | ||||
| Total | 40 | 110 | 150 |
Table 13: Relation between fracture type and coronal cut in MPR.
| Axial * Three D Crosstabulation | ||||||
|---|---|---|---|---|---|---|
| Count | ||||||
| Three D | Total | |||||
| NO | YES | |||||
| Axial | No | 2 | 10 | 12 | ||
| Yes | 21 | 117 | 138 | |||
| Total | 23 | 127 | 150 |
Table 14: Relation between axial cut in MPR and three dimension CT.
| Sagittal * Three D Crosstabulation | |||||||
|---|---|---|---|---|---|---|---|
| Count | |||||||
| Three D | Total | ||||||
| NO | YES | ||||||
| Sagittal | No | 17 | 18 | 35 | |||
| Yes | 6 | 109 | 115 | ||||
| Total | 23 | 127 | 150 |
Table 15: Relation between sagittal cut in MPR and three dimension CT.
| Coronal * Three D Crosstabulation | |||||||
|---|---|---|---|---|---|---|---|
| Count | |||||||
| Three D | Total | ||||||
| NO | YES | ||||||
| Coronal | No | 18 | 22 | 40 | |||
| Yes | 5 | 105 | 110 | ||||
| Total | 23 | 127 | 150 |
Table 16: Relation between coronal cut in MPR and three dimension CT.
| Bone * Three D Crosstabulation | |||||||
|---|---|---|---|---|---|---|---|
| Count | |||||||
| Three D | Total | ||||||
| NO | YES | ||||||
| Bone | Base of skull | 11 | 1 | 12 | |||
| Facial | 3 | 31 | 34 | ||||
| Facial+Base of skull | 0 | 2 | 2 | ||||
| Frontal | 0 | 16 | 16 | ||||
| Occipital | 3 | 13 | 16 | ||||
| Parietal | 5 | 29 | 34 | ||||
| Parietal+Frontal | 0 | 2 | 2 | ||||
| Parietal+Frontal+Facial | 0 | 1 | 1 | ||||
| Temporal | 1 | 21 | 22 | ||||
| Temporal+Frontal | 0 | 1 | 1 | ||||
| Temporal+Parietal | 0 | 1 | 1 | ||||
| Temporal+Parietal+Frontal | 0 | 9 | 9 | ||||
| Total | 23 | 127 | 150 |
Table 17: Relation between bone and three dimension CT.
| Bone * Axial Crosstabulation | |||||||
|---|---|---|---|---|---|---|---|
| Count | |||||||
| Axial | Total | ||||||
| NO | YES | ||||||
| Bone | Base of Skull | 0 | 12 | 12 | |||
| Facial | 4 | 30 | 34 | ||||
| Facial+Base of Skull | 0 | 2 | 2 | ||||
| Frontal | 2 | 14 | 16 | ||||
| Occipital | 0 | 16 | 16 | ||||
| Parietal | 6 | 28 | 34 | ||||
| Parietal+Frontal | 0 | 2 | 2 | ||||
| Parietal+Frontal+Facial | 0 | 1 | 1 | ||||
| Temporal | 0 | 22 | 22 | ||||
| Temporal+Frontal | 0 | 1 | 1 | ||||
| Temporal+Parietal | 0 | 1 | 1 | ||||
| Temporal+Parietal+Frontal | 0 | 9 | 9 | ||||
| Total | 12 | 138 | 150 | ||||
| Bone * Sagittal Crosstabulation | |||||||
| Count | |||||||
| Sagittal | Total | ||||||
| NO | YES | ||||||
| Bone | Base of Skull | 12 | 0 | 12 | |||
| Facial | 5 | 29 | 34 | ||||
| Facial+Base of Skull | 0 | 2 | 2 | ||||
| Frontal | 1 | 15 | 16 | ||||
| Occipital | 4 | 12 | 16 | ||||
| Parietal | 2 | 32 | 34 | ||||
| Parietal+Frontal | 0 | 2 | 2 | ||||
| Parietal+Frontal+Facial | 0 | 1 | 1 | ||||
| Temporal | 11 | 11 | 22 | ||||
| Temporal+Frontal | 0 | 1 | 1 | ||||
| Temporal+Parietal | 0 | 1 | 1 | ||||
| Temporal+Parietal+Frontal | 0 | 9 | 9 | ||||
| Total | 35 | 115 | 150 |
Table 18: Relation between bone and axial cut in MPR.
| Bone * Coronal Crosstabulation | |||||||
|---|---|---|---|---|---|---|---|
| Count | |||||||
| Coronal | Total | ||||||
| NO | YES | ||||||
| Bone | Base of Skull | 12 | 0 | 12 | |||
| Facial | 11 | 23 | 34 | ||||
| Facial+Base of Skull | 0 | 2 | 2 | ||||
| Frontal | 3 | 13 | 16 | ||||
| Occipital | 6 | 10 | 16 | ||||
| Parietal | 5 | 29 | 34 | ||||
| Parietal+Frontal | 0 | 2 | 2 | ||||
| Parietal+Frontal+Facial | 0 | 1 | 1 | ||||
| Temporal | 3 | 19 | 22 | ||||
| Temporal+Frontal | 0 | 1 | 1 | ||||
| Temporal+Parietal | 0 | 1 | 1 | ||||
| Temporal+Parietal+Frontal | 0 | 9 | 9 | ||||
| Total | 40 | 110 | 150 |
Table 19: Relation between bone and coronal cut in MPR.
Discussion
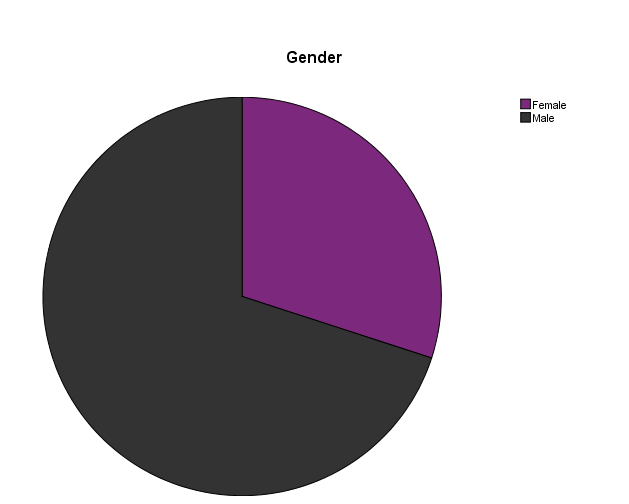
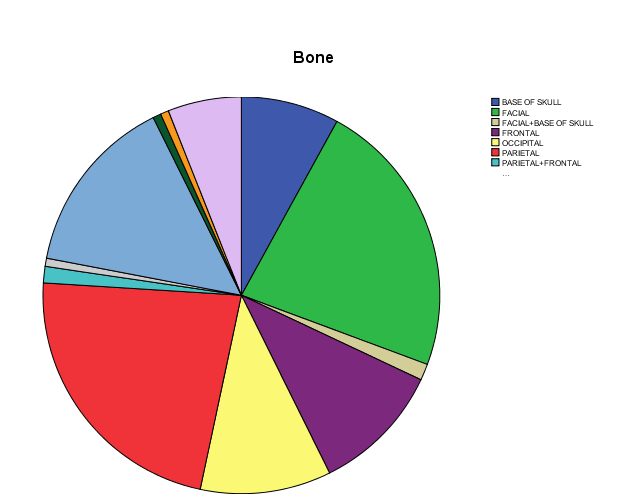
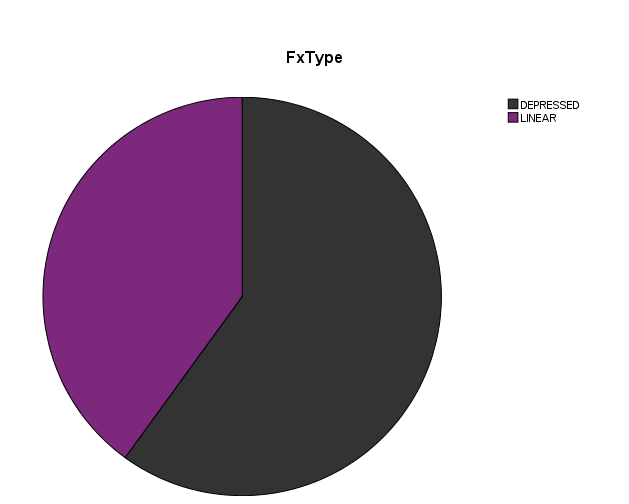
In this study sample size was (150 patients) and frequency of male was 105 with percent 70%, female was 45 with percent 30% (Table 2, Figure 1). In table 1 mean of age included in this study were 35 ranges of minimum and maximum respectively (6-89). Table 3 shows frequency of bone fracture and the most bone fractured was fracture of facial bone and parietal bone fracture with equal percent (22.7%) and then temporal bone (14.7%) frontal bone (10.7%), occipital bone (10.7%), base of skull (8%), temporal+parietal+frontal (6%), facial+base of skull (1.3%) parietal+frontal (1.3%), parietal+frontal+facial (0.7%), temporal+frontal (0.7%), temporal+parietal (0.7%). According to fracture type Table 4 we found that frequency of depressed fracture (90) with percent 60% and frequency of linear fracture (60) with percent 40%.
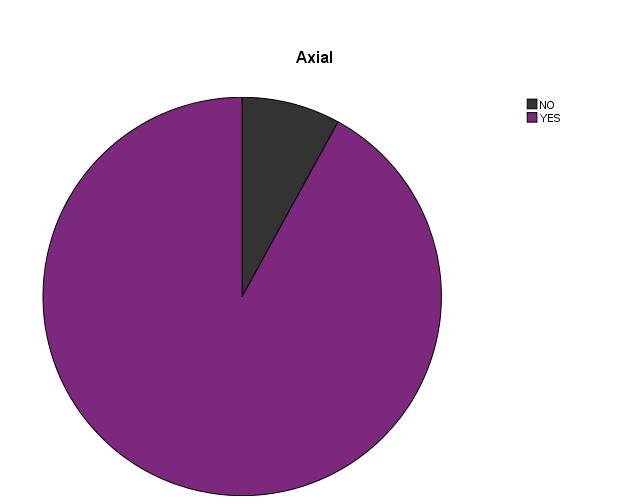
Table 9 shows fractures that appear in 3DCT from total of 150 patient s and the result show that there are 127 with percent 84.7 appear in CT. Frequency of most bone fractures that appear was Facial bone (31), parietal bone (29) and then temporal bone (21). Table 10 shows the relation between type of fracture and 3DCT and result was that total of 90 depressed fractures appear in 3DCT, but linear fracture with total (60) there was only 37
appear in 3DCT. When we compared MPR with 3DCT (Tables 11&12) the result was similar in depressed fracture appearance in axial and sagittal which was (81 out of 90) in both but in linear fracture type in axial (57 out of 60) and in sagittal (34 out of 60). In Tables 14,15&16 we compared MPR with 3DCT and result was there is (117out of 138) appear in axial and 3DCT, and (109 out of 115) appear in sagittal, and (105 out of 110) appear in Coronal. This results match with most literature.
Most bone fracture appear in 3DCT (Table 17) was facial, parietal and temporal with frequency (31),(29),(21) respectively. Most bone fracture appear in axial cut in MPR (Table 18) was facial, parietal and temporal with frequency (30),(28),(22) respectively. Most bone fracture appear in sagittal cut in MPR (Table 19) was facial, parietal and temporal with frequency (29),(32),(11) respectively. Most bone fracture appear in coronal cut in MPR (Table 20) was parietal, facial and temporal with frequency (29),(23),(19) respectively.
Conclusion
This Study concludes that the visible fractures under 3D images were facial, parietal and temporal respectively. In evaluation the difference between MPR and 3D images to determining fractures in traumatic patients we found that any depressed fracture appeared in MPR will be clearly appeared in 3DCT,but linear fracture depend on MPR appearance.
Recommendations
About 3DCT should be added as a routine imaging. Specification of bone under study will ease up findings and data acquisition.
References
-
Herman GT (2009) Fundamentals of computerized tomography: Image reconstruction from projection, 2nd (Edn.), Springer.
-
Heath DG, Soyer PA, Kuszyk BS, Bliss DF, Calhoun PS, et al. (1995) Three-dimensional spiral CT during arterial portography: comparison of three rendering techniques. Radiographics 15(4): 1001-1011.
-
Goh KY, Ahuja A, Walkden SB, Poon WS (1997) Is routine computed tomographic (CT) scanning necessary in suspected basal skull fractures? Injury 28(5-6): 353-357.
-
Connor SE, Flis C (2005) The contribution of high resolution multiplanar reformats of the skull base to the detection of skull-base fractures. Clin Radiol 60(8): 878-885.
-
Centers for Disease Control and Prevention (2013) Injury prevention and control: traumatic brain injury. Atlanta, GA.
-
Derkowski W, Kedzia A, Glonek M (2003) Clinical anatomy of the human anterior cranial fossa during the prenatal period. Folia Morphol 62(3): 271-273.
-
Schlossberg L, Zuidema GD (1997) The Johns Hopkins Atlas of Human Functional Anatomy. 4th (Edn.), The Johns Hopkins University Press, London, pp: 5.
-
Lang J (1999) Skull base and related structures: atlas of clinical anatomy. 2nd (Edn.), FK Schattauer, Germany, pp: 208.
-
Singh J, Stock A (2006) Head Trauma. Emedicine.
-
Altobelli DE, Kikinis R, Mulliken JB, Cline H, Lorensen W, et al. (1993) Computer-assisted three-dimensional planning in craniofacial surgery. Plast Reconstr Surg 92(4): 576-585.
-
Dos Santos DT, Costa e Silva AP, Vannier MW, Cavalcanti MG (2004) Validity of multislice computerized tomography for diagnosis of maxillofacial fractures using an independent workstation. Oral Surg Oral Med Oral Pathol Oral Radiol Endod 98(6): 715-720.
-
Fox LA, Vannier MW, West OC, Wilson AJ, Baran GA, et al. (1995) Diagnostic performance of CT, MPR and 3DCT imaging in maxillofacial trauma. Comput Med Imaging Graph 19(5): 385-395.
- Ultrasound Guided Therapeutic Nerve Blocks
- Cyclops Lesion Without ACL Reconstruction: A Rare Case in a Patient with Intact Anterior Cruciate Ligament and Tibial Plateau Fracture
- Dosimetric Comparison between Two Dose Calculation Algorithms in SBRT Treatment of Lung Cancer in Ring-based and C-arm Radiation Therapy Equipment
- Adolescent Testicular Adrenal Rest Tumors: A Case Report and Review of the Literature
- Giant Intrathoracic Lipoma: A Rare Presentation
- Image of a Right Renal Angiomyolipoma Complicated by Hemorrhage