Factors Affecting Depth-Dose Accuracy in Modern Diagnostic X-Ray Imaging
Purpose: Distribution of radiation in and through a patient is fundamental to image creation, radiation management, and evaluation of potential radiation risk to patients. While other investigators have generally demonstrated how beam factors such as kilovoltage (kV), half-value layer (HVL) and field size affect central axis depth dose, no one has demonstrated the relative importance each of these factors in characterizing the beam. Additionally, source-to-skin distance (SSD) affects depth dose due to beam divergence while radiation buildup depends on beam energy. Further, the relative effect on depth dose from the use of copper versus aluminum as filtration material has not been investigated. This research investigates the relative importance of these factors by measuring how central-axis depth dose independently depends on each factor when the others are held constant. Methods: A Philips Super 80 CP RF system and a cubic 30-cm 1D water tank (CIVCO, Orange City, Iowa) were used to assess depth dose. Ionization charge was collected using a 0.02-cm3 plane-parallel Advanced Markus chamber (PTW-Freiburg, Freiburg, Germany), a 0.62-cm3 Exradin A19 (Farmer type) waterproof ionization chamber (Standard Imaging, Middleton, WI, USA), and a PC Electrometer (Sun Nuclear Corp. Melbourne, FL, USA). Measurements at depths of 10 millimeters and less were made with the parallel plate chamber to assess effects of build-up and field size on dose at shallow depths. Measurements at 10-mm and deeper depths were made with a farmer-type chamber to improve the precision of those measurements. An independent free-in-air reference chamber / detector (either RadCal 6 cc ion chamber or Raysafe X2 RF detector) was placed in the periphery of the X-ray field and used to correct for any fluctuations in radiation output. The tank was filled with water to at least 25 cm and placed on a cart. Standard measurements were made with the following configuration: 100 cm source to water surface distance and 20-cm x 20-cm field size on water surface. Results: To assure accuracy in determining depth dose for modern diagnostic beams, the data demonstrate that HVL, field size and SSD should be carefully specified. Mayneord’s correction can be used to adequately adjust data for variances introduced by measurements at different SSDs. The kV for diagnostic beams need only be generally specified. The effects of scatter radiation and buildup at shallow depths contribute to the shoulder of the depth-dose curve at higher beam qualities but should not adversely affect the normalization of depth-dose measurements. For equal HVL, depth-dose has no discernable dependence on whether copper or aluminum is used to filter the beam.
Ching-Mei Feng* and Louis K Wagner
Abbreviations: kV: Kilovoltage; HVL: Half-Value Layer; SSD: Source-to-Skin Distance; Al: Aluminum; PDD: Percent Depth Dose.
Introduction
The distribution of radiation in and through a patient is fundamental to image creation, radiation management, and evaluation of potential radiation risk to patients. Harrison and others [1, 2, 3] have previously demonstrated how beam factors such as kilovoltage (kV), half-value layer (HVL), and beam area (field size) affect central-axis depth dose. An independent analysis of Harrison’s data by our group demonstrated that depth doses for the beam qualities investigated by Harrison depended most critically on specification of HVL, to a lesser extent on field size, and least critically on kV. The beam kV appears to be most important as a specification for beams of low kV (<80) and low HVL (<3mm). Even so, for any given field size and for constant HVL, the magnitude of changes to depth dose due to changes in kV for lower beam qualities are modest compared to the dependence of depth dose on HVL for a given kV. Similarly, when HVL is held constant, field size affects depth dose to a greater extent than does kV for clinically relevant beams. Fetterly KA, et al. [2] measured percent depth dose using an x-ray fluoroscopy machine. Their results agreed with Harrison’s findings. Both studies were limited to beams with HVL no greater than 4.1 mm aluminum (Al). Modern machines typically have HVL greater than 4 mm Al, especially for interventional fluoroscopic units. Wunderle KA, et al. [3] have published depth-dose data for beams with HVL greater than 4 mm Al. Their data presented percent depth dose measurement for variety of beam energies, field sizes and beam qualities up to 10.8 mm Al HVL using added copper filtration.
No independent analysis of the relative importance of these factors, when others are held constant, was performed. None of the authors investigated the effect of changing SSD on depth dose. Specification of kV for any diagnostic beam is problematic due to the wave form of the kV application which differs from machine to machine. The waveform also can change for any one machine, depending on the duration of the x-ray pulse and other factors in the performance of the applied voltage. Measurement of kV with non-invasive meters can only be surmised as an approximate assessment of beam energy with uncertain factors. Therefore, should depth- dose be strongly dependent on kV, it would be necessary to accurately specify the complete waveform as well as the kV. Should depth dose not be critically dependent on kV, then specification of waveform would be less important. HVL, on the other hand, can usually be measured with accuracy and precision, as long as the machine’s reproducibility is reliable, as it often is. HVL depends on the thickness of the beam filters and whether they are made from aluminum or copper. Field size can also be accurately specified, although the factor of beam divergence with changing SSD adds another variable to the depth-dose evaluation.
Based on Harrison’s data for well filtered beam qualities more characteristic of modern radiography, the dependence on kV is projected to be of lessening importance as beam hardening increases. In this paper we investigated how depth dose depends specifically on kV, HVL, field size, beam divergence and filtration material for beams up to 6-mm in HVL. Our focus was to extend the work of Harrison to understand what characteristics were most important in determining depth dose for beams greater than 4 mm of aluminum in HVL, which is more characteristic of modern radiographic machines. How absorbed dose changes with depth in water or tissue is a function of SSD due to beam divergence. In clinical imaging SSD might range from 50 cm or less for some mobile or fixed angiographic fluoroscopy procedures to about 160 cm for upright chest radiography. An SSD of about 70 cm is typical for abdominal imaging. Thus, it is important to understand the relative importance of depth dose on SSD. Mayneord WV, et al. [4] proposed a simple method to adjust depth-dose for various SSDs and noted that the technique works best for more penetrating beam qualities. While Mayneord’s method is known to have limitations for low beam qualities, the method should be more applicable to modern more penetrating beam qualities. We examined the applicability of Mayneord’s correction factor for a wide range of beam qualities to understand the applicability of this correction to modern machines.
For diagnostic beam qualities, build-up of electron density to equilibrium occurs in water- equivalent material at depths of less than 5 millimeters, which is the depth at which absorbed dose is maximum (Dmax) for 60Co therapy beams. Typically, depth-dose curves are normalized to the reading at Dmax. Readouts in “dose” at depths less than Dmax depend on the characteristics of the ionization chamber used in the assessment. Important characteristics include the volume, shape, and wall thickness of the chamber. In this study, we used a parallel-plate chamber for shallow depth measurement (up to 10 mm) and a farmer type chamber for deeper depths to take advantage of the larger sensitive volume of the chamber for heavily attenuated beams at deeper depths. Dmax is a property of the interaction of radiation in the medium and measurement of the depth for Dmax will involve systematic error due to characteristics of the ionization chamber. Dose at Dmax affects the normalization of the depth-dose curves when it is substantively greater than dose at zero depth.
Normalizing to zero depth introduces a systematic error in depth-dose measurements because measurements at zero depth depend on properties of the ionization chamber and are not strictly a property of the interactions of radiation in the medium. We also examined in this research whether or not electron buildup might affect the normalization of depth-dose curves for heavily filtered diagnostic x-ray spectra [5]. An additional factor that could affect depth dose is the metallic composition of the filters used to harden the beam. This might be due to changes in energy composition of the bremsstrahlung beam due to k-edge attenuation. To investigate this potential effect, we compared our depth dose results, which used aluminum filters, to the results of Wunderle KA, et al. [3], who used copper filters.
80 CP RF system was used in this study. Twenty-one different x-ray spectra were developed. The kV was restricted to one of five settings. For each kV, aluminum filtration was added to effect an HVL matching one of six discrete values. The available beam qualities and the required added filtrations in each case are provided in Table 1. In some cases, no beam could be practically developed to produce the HVL at a given kV. For example, the inherent (non-removable) filtration of the tube was sufficiently great that no HVL of 1.8 mm aluminum could be developed for beam energies of 100 kV or greater. Additionally, filtration for the 60 kV beam to produce an HVL greater than 2.8 mm aluminum was excessive and resulted in a beam output too low to be useful.
- Materials & Methods
- An overhead radiographic x-ray tube of a Philips Super
- Added Filtration in mm Al Applied to Achieve HVL in mm Al as a Function of kV kV
- HVL in mm 1100 Al
- 60
- 80
- 100
- 120
- 140
- 1.8
- 0.80
- 0.00
- 2.3
- 1.72
- 0.74
- 0.00
- 2.8
- 3.50
- 1.47
- 0.59
- 0.00
- 3.4
- 2.50
- 1.25
- 0.53
- 0.19
- 4.6
- 4.93
- 3.00
- 1.85
- 1.15
- 6.0
- 11.9
- 6.54
- 4.01
- 2.92
Table 1: Millimeters of added aluminum filtration necessary to obtain the half-value layers specified in column 1 for each kV
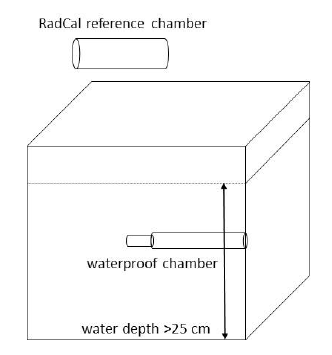
The manufacturer’s added filtration at the tube port was removed to produce the softest beam possible before establishing the filtration necessary to produce specific HVLs. The added aluminum filtration necessary to produce the specific HVL at each kV (Table 1) was determined empirically using a Radcal 6-cc ionization chamber (Radcal, Monrovia, CA, USA), 1100 aluminum plates with various thicknesses and narrow beam geometry. A cubic 30-cm 1D water tank (CIVCO, Orange City, IA, USA) was used to acquire the depth dose. The ionization charge was collected using a 0.02-cm3 plane-parallel Advanced Markus chamber (PTW- Freiburg, Freiburg, Germany) for depths less than and equal to 10 mm, a 0.62-cc Exradin A19 (Farmer type) waterproof ionization chamber (Standard Imaging, Middleton, WI, USA) for depths of 10 mm and greater, and a PC Electrometer (Sun Nuclear Corp. Melbourne, FL, USA). An independent free- in-air reference chamber / detector (either Radcal 6 cc ion chamber (Radcal, Monrovia, CA) or Raysafe X2 RF detector (RaySafe, Billdal, Sweden)) was placed in the periphery of the X-ray field and used to correct for any fluctuations in radiation output [6]. The tank was filled with water to at least 25 cm and placed on a cart. Standard measurements were made with the following configuration: 100 cm source to water surface distance and 20 centimeter square field size (400 cm2) on water surface. The setup is shown in Figure 1.
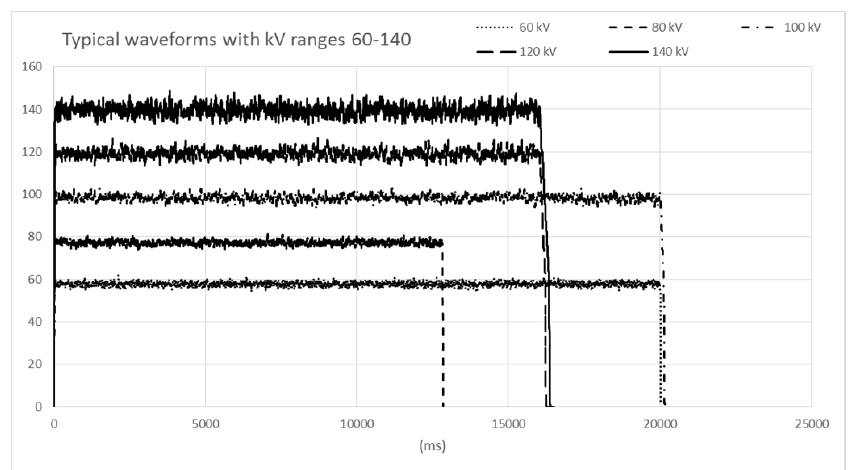
Central-axis percent depth dose (PDD) was measured from the water surface (effective depth of 1 millimeter) to a depth of 200 mm. To estimate the effects of electron buildup at shallow depths, measurements were taken at 5-mm and 10-mm depths in addition to the coarser depth increments for deeper measurements. Field size dependence was examined by acquiring additional data using a 10-cm x 10- cm and a 35-cm x 35-cm field size at water surface for two beam qualities of 100 kV with HVL of 3.4 mm Al and 100 kV with HVL of 6.0- mm Al. PDD was also collected for a 60-cm source to water surface distance and two beam qualities: 80 kV /2.8-mm HVL and 120 kV / 6.0-mm HVL. This set of data was then compared to the initial measurements made at 100- cm source-to-surface distance to assess the relationship between percent depth dose and source-to-water-surface distance. The kV of the beam was assessed using a recently calibrated Raysafe X2 noninvasive solid-state detector. The kV was found to be reliably reproducible to within less than 1 kV. Figure 2 shows typical waveforms that were reproducible throughout the experiment.
The Mayneord f-factor [4] for the special case where Dmax is small compared to the SSD can be applied to approximate the depth dose for geometry different from that of the measured depth dose data. For the new geometry the percent depth dose, P′(D), at depth D is approximated as:
2 2 SSD' SSD+D P'D=P(D)X X SSD SSD'+D
where P(D) is the percentage depth dose for the original geometry, and SSD and SSD′ are the original and new source- to-surface distances.
Results
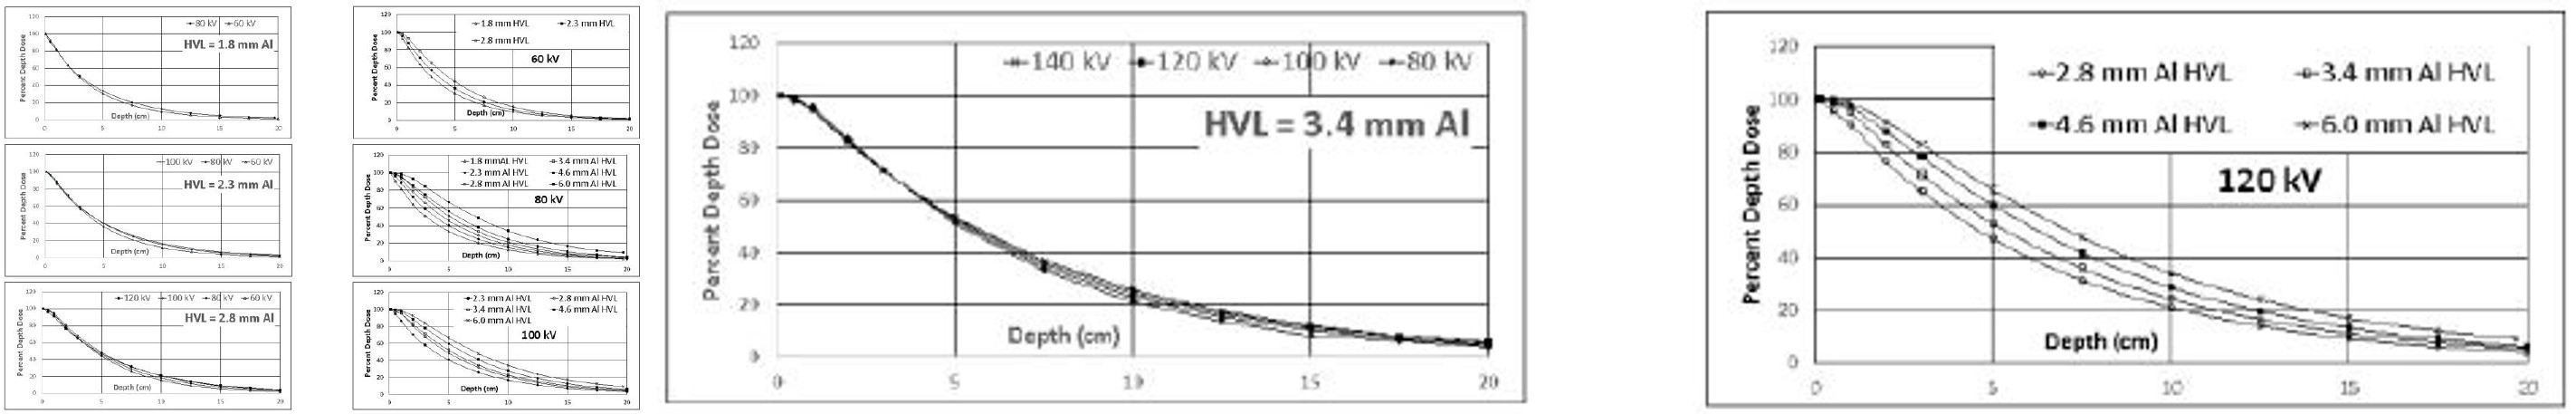
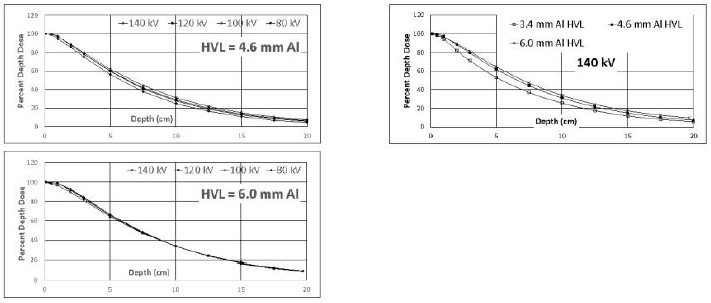
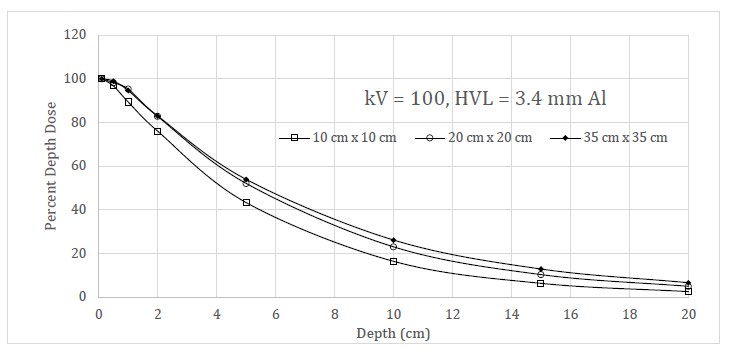
Depth dose curves as a function of kV and HVL are shown in the graphs of Figure 3. The dependence of depth dose as a function of field size is shown in Figure 4. Table 2 provide data on differences in depth dose for the same beam qualities at two SSDs.
| 120 kV 2.8-mm HVL | |||||
|---|---|---|---|---|---|
| 100-cm SSD | 60-cm SSD | 100-cm corrected to 60-cm | Difference before correction | Difference after correction | |
| Depth (cm) | %DD | %DD | |||
| 0.1 | 100.0 | 100.0 | 100.0 | 0.0 | 0.0 |
| 0.5 | 95.8 | 93.9 | 95.2 | 2.0 | 1.3 |
| 5 | 47.1 | 43.0 | 44.2 | 4.1 | 1.2 |
| 10 | 21.1 | 16.7 | 18.8 | 4.4 | 2.1 |
| 15 | 9.4 | 6.6 | 8.0 | 2.8 | 1.4 |
| 120 kV 6.0-mm HVL | |||||
| 100-cm SSD | 60-cm SSD | 100-cm corrected to 60-cm | Difference before correction | Difference after correction | |
| Depth (cm) | %DD | %DD | |||
| 0.1 | 100.0 | 100.0 | 100 | 0.0 | 0.0 |
| 0.5 | 99.3 | 98.1 | 98.7 | 1.2 | 0.6 |
| 5 | 65.7 | 62.8 | 61.8 | 2.9 | -1.0 |
| 10 | 34.1 | 30.6 | 30.3 | 3.5 | -0.3 |
| 15 | 17.0 | 14.3 | 14.4 | 2.7 | 0.1 |
Tables 2: Differences in depth dose for two beam qualities at two SSDs. The effect of using Mayneord’s correction for different SSDs is shown.
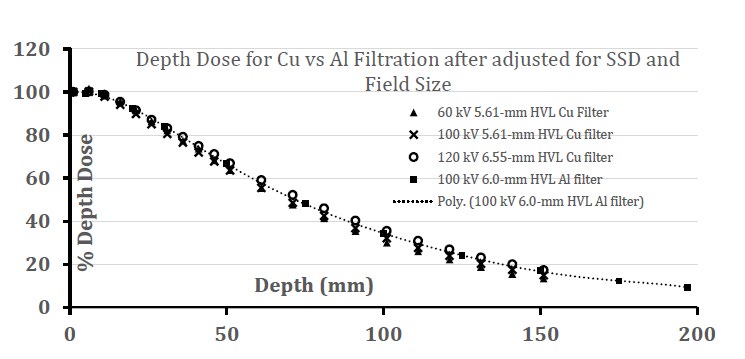
To test the effect of filtration material on depth dose, we compared the attenuation curves generated by Wunderle KA, et al. [3] who used copper filters for 60 kV and 5.61-mm HVL, 100 kV and 5.61-mm HVL, and 120 kV and 6.55-mm HVL to the curve generated in this study for the aluminum filtered beam of 100 kV and 6.0-mm HVL. Two comparisons are provided. The comparison in Figure 5a shows the raw data for each curve. The comparison in Figure 5b shows the data after adjustment of the copper-filtered data to match the SSD and field size used for the aluminum-filtered data.
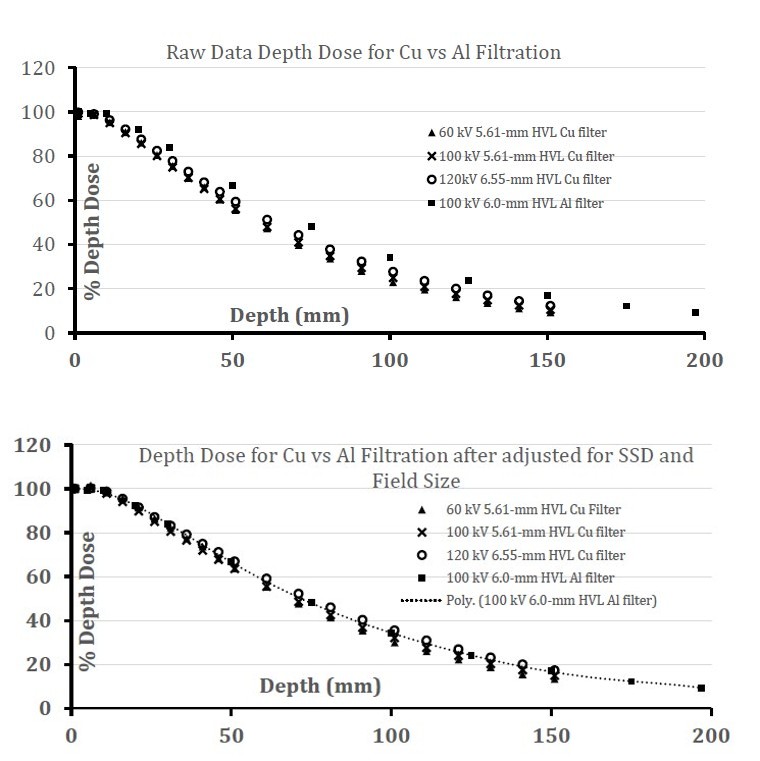
Figure 5a: Depth dose data as reported in reference 3 for copper-filtered beams of 5.61- and 6.55-mm HVL compared to depth dose for the beam of 6.0-mm HVL and aluminum filters in this work.
Figure 5b: Depth dose data as reported in reference 3 for copper-filtered beams of 5.61- and 6.55-mm HVL after adjustment for SSD and field size compared to depth dose for the beam of 6.0-mm HVL and aluminum filters in this work. The 6th-order polynomial curve was fitted to the aluminum-filtered data solely as a visual aid and has no physical meaning.
Discussion
Percent depth dose is widely used in radiation oncology treatment planning to determine the organ dose and evaluating the harm to normal tissues inside the patient’s body. Percent depth dose from modern diagnostic imaging machines is beneficial in determining radiation damage to the tissue during high radiation used interventional procedures. The results shown in this study can also help to determine the fetal dose in various settings. Since there are so many factors affecting the percent depth dose in diagnostic x-ray settings, the discussion will be based on each variable independently [7].
Dependence on kV
Data on the measured tube voltages (Table 3) were within 5% of the nominal tube voltage on the console. The central axis depth dose data (Figure 3) demonstrate that when HVL remains constant, changes in kV across the entire practical range have a relatively weak effect on the shape of the depth-dose curve. At 6-mm HVL the shape of the central- axis depth dose is nearly independent of kV. The maximum deviation at this HVL occurs for 80 kV at shallow depths, but the curves for 100, 120, and 140 kV are nearly congruent. Thus, for practical purposes using modern diagnostic x-ray beams, accurate specification of kV is unnecessary [8].
| Average measured kV | Set kV | ||||
|---|---|---|---|---|---|
| Nominal mm 1100 Al HVL | 60 | 80 | 100 | 120 | 140 |
| 1.8 | 58.61±0.15 | 78.91±0.21 | |||
| 2.3 | 58.39±0.10 | 79.35±0.15 | 98.00±0.39 | ||
| 2.8 | 57.15±0.26 | 78.84±0.16 | 98.19±0.26 | 118.27±0.33 | |
| 3.4 | 78.49±0.17 | 98.90±0.12 | 118.93±0.15 | 139.66±0.29 | |
| 4.6 | 76.76±0.11 | 97.76±0.15 | 117.83±0.07 | 137.85±0.14 | |
| 6.0 | 77.33±0.09 | 97.44±0.17 | 118.59±0.70 | 137.00±0.20 |
Table 3: Average measured kV vs. set kV.
Dependence on HVL
The relationship between central axis depth dose and HVL is shown in Figure 3. For each kV setting, the slopes and shapes of central axis depth dose curves differed when half-value-layer changed. While only three beam qualities were studied for 60 and 140 kV beams, the different slopes and shapes of each curve are easily distinguished. These data imply that accurate specification of HVL accounts for the overall penetrating properties of a diagnostic-quality Bremsstrahlung beam more critically than does kV. The specification of kV allows for relatively minor adjustments in depth dose accuracy. The results of this study were compared with the results of Wunderle KA, et al. [3] when the percent depth dose curves using different tube voltages with similar HVL are examined using Wunderle’s depth-dose measurements, the same phenomenon can be observed. That is, data from both studies demonstrate that the percent depth dose depends more prominently on HVL when kV remains constant than on tube voltage when HVL remains constant [9].
Dependence on Field Size
Depth-dose was measured for three clinically applied field sizes. As expected, Figure 4 showed significant difference between field sizes 10 cm x 10 cm and 35 cm x 35 cm. Also as expected, depth dose for the 20 cm x 20 cm field fit between the two curves. Harrison1 and Wunderle KA, et al. [3] demonstrated similar changes. However, of note is the change in the shoulder of the depth-dose curves as field size changes. At lower beam quality as field size diminishes, the shoulder approaches a shape with no shoulder. The shoulder for the more penetrating beam quality demonstrates much less change as field size diminishes.
Dependence on and Correction for SSD
The data of Tables 2 provide depth-dose measurements at SSDs of 60-cm versus 100-cm. Measurements were made for 120 kV beams with HVLs of 2.8- and 6.0-mm of aluminum. The data suggest that the change in percent-depth-dose at 5-cm depth due to the change in SSD was 4.1 percent for the lesser beam quality and 2.9 percent for the higher beam quality. At 10-cm depth the corresponding changes were 4.4 percent and 3.5 percent. Since clinical SSDs can range from less than 50 cm to more than 150 cm, it is desirable to account for this difference to avoid a systematic error for any given SSD. Mayneord’s correction can be applied to markedly adjust data for different SSDs. For the soft beam of 2.8-mm HVL, the correction provides an improvement in the correct direction, leaving a small systematic error of about 1-2 percentage points while the systematic error after correction for the 6-mm HVL spectra is -1.0 and -0.3 percent. Thus, Mayneord’s correction for diagnostic beams appears to work well.
General Form of DD: Buildup and Shape of Curve
All curves show the classic exponential-like decrease in percent dose with increasing depth. The shoulders of all curves increase systematically as HVL increases. This can be due to two factors: changes in scattered radiation at shallow depths as the effective energy of the beam increases and electron build-up at shallow depths. Figure 4 for a beam quality of 3.4-mm aluminum HVL demonstrates how the shoulder is strongly dependent on field size, suggesting that scattered radiation from off-central-axis water is the major contributor to this shoulder. The more penetrating beam quality of 6.0-mm aluminum HVL demonstrates a much reduced change in the shoulder as field size decreases, suggesting a possible additional factor contributing to the shoulder. Buildup is a contributing factor to the initial aspects of the shoulder, but its relative contribution cannot be distinguished from that due to scattered radiation. The effect of buildup was not sufficient to alter the normalization of the depth-dose curves for the beams tested in this study [10].
Comparisons of Results for Copper Versus Aluminum Filtration
The raw data comparison of copper versus aluminum in Figure 5a demonstrates significant deviations of the unadjusted copper-filtered data versus the depth dose measurements for the aluminum-filtered data. As demonstrated in this work, adjustments must be applied for differences in field sizes and source-to-surface distances used for the depth-dose measurements. When an adjustment is applied to the copper-filtered data to match the SSD and field size of the aluminum- filtered data, the aluminum data points representing 6.0-mm HVL fall between the copper data sets of 5.61-mm HVL and 6.55-mm HVL. The data demonstrate that there is no difference in depth dose that can be attributed to the different types of filtration used. The only discernable difference is due to the slight differences in HVLs. The graphs also demonstrate the importance of corrections for both SSD and field size. For the corrections of these data sets, the correction to the percent depth-dose was 12% at 5-cm depth (%-depth-dose changed from 59.3 to 66.7%) and 28% at 10- cm depth (%-depth-dose changed from 27.7 to 35.4%). The corrections for SSD and for field size were essentially the same magnitude. The adjustments clearly demonstrate that SSD and field size must both be considered in order to accurately specify depth dose.
Conclusions
a. To accurately assess central-axis depth dose for diagnostic-type beam qualities, HVL, field size, and SSD should be carefully assessed. b. The dependence of depth dose on SSD can be reasonably accounted for by an application of Mayneord’s f-factor and should be applied for accurate results. c. Depth dose is mildly dependent on specifications of kV and a general specification of kV is recommended to achieve reasonable accuracy. d. The shoulder of the depth dose curve for the beam qualities studied is due to scattered radiation and for the highest beam qualities buildup is a likely contributing factor but its relative significance is not measureable. e. Depth dose for a given HVL does not depend on whether the material used to filter the bremsstrahlung beam is made of copper or aluminum.
Acknowledgement
The authors wish to thank Luong Thai whose technical assistance greatly contributed to the accuracy and expediency of data collection, Margie Kulakofsky who coordinated experimental sessions, and Khoa Vu who provided maintenance for the x-ray equipment.
References
-
Harrison RM (1981) Central-axis depth-dose data for diagnostic radiology. Phys Med Biol 26(4): 657-670.
-
Fetterly KA, Gerbi BJ, Alaei P, Geise RA (2001) Measurement of the dose deposition characteristics of x-ray fluoroscopy beams in water. Med Phys 28(2): 205- 209.
-
Wunderle KA, Godley AR, Shen ZL, Rakowski JT, Done FF (2017) Percent depth doses and X-ray beam characterizations of a fluoroscopic system incorporating copper filtration. Med Phys 44(4): 1275-1286.
-
Mayneord WV, Lamerton LF (2014) A survey of depth dose data. Br J Radiol 14(164): 255.
-
Li XA, Ma CM, Salhani D (1997) Measurement of percentage depth dose and lateral beam profile for kilovoltage x-ray therapy beams. Phys Med Biol 42(12): 2561-2568.
-
Balter S, Hopewell JW, Miller DL, Wagner LK, Zelefsky MJ (2010) Fluoroscopically guided interventional procedures: a review of radiation effects on patients’ skin and hair. Radiol 254(2): 326-341.
-
Miller DL, Balter S, Schueler BA, Wagner LK, Strauss KJ, et al. (2010) Clinical radiation management for fluoroscopically guided interventional procedures. Radiol 257(2): 321-332.
-
Harrison RM, Moretti C, Nahum AE, Rosser KE (1996) The IPEMB code of practice for the determination of absorbed dose for x-rays below 300 kV generating potential (0.035mm Al-4mm Cu HVL; 10–300kV generating potential). Phys Med Biol 41(12): 2605-2625.
-
Khan FM, Gibbons JP (2014) Khan’s The Physics of Radiation Therapy. 5th (Edn.), Wolters Kluwer.
-
Shrimpton PC, Jones DG, Wall BF (1988) The influence of tube filtration and potential on patient dose during x-ray examinations. Phys Med Biol 33(10): 1205-1212.
- Ultrasound Guided Therapeutic Nerve Blocks
- Cyclops Lesion Without ACL Reconstruction: A Rare Case in a Patient with Intact Anterior Cruciate Ligament and Tibial Plateau Fracture
- Dosimetric Comparison between Two Dose Calculation Algorithms in SBRT Treatment of Lung Cancer in Ring-based and C-arm Radiation Therapy Equipment
- Adolescent Testicular Adrenal Rest Tumors: A Case Report and Review of the Literature
- Giant Intrathoracic Lipoma: A Rare Presentation
- Image of a Right Renal Angiomyolipoma Complicated by Hemorrhage