Association of SOD1 Gene Promotor 50 bp Indel Polymorphism with Susceptibility of Type 2 Diabetes Mellitus
Introduction: Oxidative stress plays an essential role in the pathogenesis of type 2 diabetes mellitus (T2DM). An antioxidant enzyme superoxide dismutase 1 (SOD1) dissociates free superoxide radicals and provides protection against oxidative damage. The aim of this study was to investigate the role of promotor region 50 bp Indel SOD1 polymorphism with the pathogenesis of type 2 diabetic mellitus among Pakistani population. Materials and Methods: This was a case-control study comprised of n=359 subjects, divided into n=178 type 2 diabetic patients and n=181 controls. Screening of SOD1 promotor 50 bp Indel polymorphism was carried out by conventional polymerase chain reaction (PCR). Statistical interpretations were done by software SPSS® version 20.0 and SNPStats©. Results: Genotype distribution pattern of SOD1 polymorphism indicated that homozygous mutant D/D genotype frequency was two folds reduced in T2DM (0.01) in comparison to controls population (0.02). Heterozygous I/D genotype frequency was higher in T2DM subjects (0.22) as compared to controls (0.17). An insignificant association of SOD1 polymorphism was detected with predisposition of T2DM (OR=1.14, Fisher’s exact=2.0, p=0.325). Genetic analysis further revealed that dominant model showed significant association against the pathogenicity of disease (OR=0.45, p
Introduction
Type 2 diabetes mellitus is one of the most prevalent and complicated metabolic disorders that occurs due to a defective mechanism of insulin secretion [1]. According to the international diabetes federation (IDF) atlas 2019, the incidence of diabetes mellitus is approximately 463 million, which may rise up to 700 million worldwide by 2045. In addition, the prevalence of type 2 diabetes mellitus is around 19.9% in Pakistan [2]. Studies related to oxidative stress in diabetes are becoming a focus of attention [3, 4]. SOD1, an antioxidant enzyme gene translates the superoxide dismutase1 enzyme in the cytoplasm that requires cofactors of copper and zinc ions for its efficient function in the cell [5]. SOD1 enzyme is a crucial antioxidant enzyme that identifies free superoxide radicals and elicits an immediate defense that causes deterioration of superoxide into a less toxic form (H2O2). Hydrogen peroxide molecule further metabolizes by the combined action of catalase and glutathione peroxidase into the water and molecular oxygen [6]. The activity of the SOD1 enzyme accounts for about 50-80% of the total SOD activity in a cell [7]. Thus, SOD1 serves as a major enzyme that plays a crucial role in the first line of defense mechanism inside the cells. An imbalance in the production of antioxidants and free radicals leads to develop oxidative stress which induces the production of many multifactorial complex traits [8]. In patients suffering from type 2 diabetes, several genetic variations have been identified in antioxidant enzyme genes emphasizing its possible risk associated with variable results in different geographic populations [9, 10, 11].
On chromosome 21q22.11 antioxidant enzyme SOD1 gene, contains a total of 5 exons with 9.3 Kb size (Entrez Gene ID 6647). SOD1 enzyme encoded by this gene is a homodimer structured protein of 32kDa size (UniProt KB - P00441 SODC_HUMAN). SOD1 indel polymorphism located in the promotor of SOD1 gene 1684bp upstream of the ATG start codon has been associated with reduced SOD1 activity in many diseases [5, 12, 13, 14, 15]. SOD1 variant of 50 bp deletion has not been studied extensively in patients of type 2 diabetes. Hence, the objective of this study was to examine the association of 50 bp deletion in SOD1 gene promotor region with type 2 diabetes mellitus.
Materials and Methods
Study Design and Ethical Approval
It was a case-control study comprised of n=359 subjects divided into n=178 patients of type 2 diabetes (T2DM) and n=181 controls enrolled from of Baqai Institute of Diabetology and Endocrinology (BIDE), Karachi, Pakistan from January to May, 2020. Clinical diagnosis of type 2 diabetic patients was done in accordance with standard criteria of the World Health Organization.
Screening of Participants
Patients diagnosed with type 2 diabetes (Age 40-65years, HbA1c > 6.5% or 48mmol/mol, no signs of complication) were included for screening of SOD1 50 bp Indel polymorphism. Patients with diabetic complications, less than 5 years of duration and age >65 years were excluded from the study. Written informed consent was obtained for the assurance of volunteer participation in accordance with the Declaration of Helsinki guidelines.
Sample Collection
Blood samples of 2ml were collected in EDTA vacutainers for the screening of genomic polymorphism and 2ml in gel vacutainers for the assessment of serum lipid parameters. While, 2ml blood was collected in fluoride vacutainers for glucose estimations from all subjects. Baseline data was also collected from each study participant in a pre-designed questionnaire for recording the demographic data. The research study was approved by the Institutional Ethical Committee of The Karachi Institute of Biotechnology and Genetic Engineering (KIBGE), the University of Karachi [Ref No. KIBGE/ICE/080/2016].
DNA Isolation
Blood samples were processed for DNA isolation by following the standard protocol of salting-out [16]. Concentration and purity of isolated DNA samples were interpreted by Nanodrop (IMPLEN NanoPhotometer®, Germany).
Genotyping of SOD1 Polymorphism
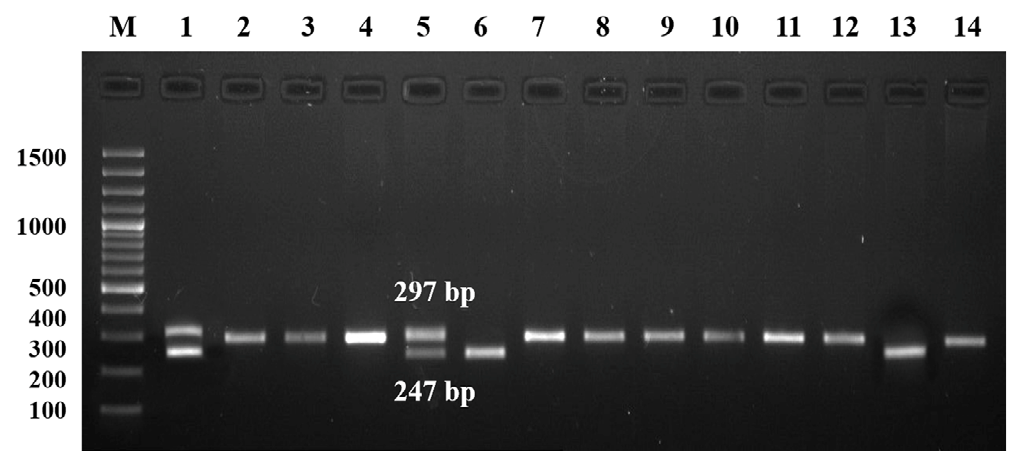
Genotyping of SOD1 50 bp Indel genetic variant was carried out by conventional polymerase chain reaction (PCR) using the set of forward and reverse primers: 5’- AATTCCTTACCCCTGTTCTA-3’ and 5’-GGCAGATTTCAGTTCATTGT-3’ respectively [15]. Following are the optimized PCR conditions of the polymorphism: a total per reaction volume of 25 µl was prepared which contains 1µl of 0.5mM forward and reverse primers, 2 µl of 150ng genomic DNA, 8 µl of Thermo Scientific Dream Taq Green PCR Master Mix (2X) and 8 µl of nuclease-free water. Thermal cycler (T100 Bio-Rad®, California, USA) was used for the screening of SOD1 indel polymorphism with following PCR conditions: initiation at 94°C for 5 minutes followed by 35 cycles of denaturation at 95°C for 60 seconds, annealing of 45 seconds at 61°C and extension of 45 seconds at 72°C then for 7 minutes for the final extension. PCR products of 297 and 247 bp fragments for the insertion (I) and deletion (D) alleles were analyzed by their appropriate separation on 2% agarose gel in electrophoresis unit (Bio-Rad®, California, USA). Bands were visualized on gel documentation system FastGene® FAS V, Nippon genetics Germany (Figure 1).
Statistical Analysis
SPSS version 20.0 was used for analysis of experimental data. Cases and controls were age and gender matched. Independent sample t-test was performed to compare the baseline and clinical variables between two groups represented as mean ± standard error of the mean (SEM) in Table 1. Fisher’s exact test was performed to assess the association of genotype frequencies with the pathogenesis of type 2 diabetes. Hardy Weinberg Equilibrium (HWE) was also tested in both groups. Risk ratio of type 2 diabetes mellitus with incidence of SOD1 50 bp Indel polymorphism was estimated by odds ratio (OR) with 95% confidence interval (CI). Genetic models were assessed by SNPStats© online software to interpret the distribution of SOD1 genotypes in dominant, recessive, co-dominant, and over dominant states [17]. The relationship of clinical parameters was also investigated with distinctive patterns of SOD1 genotypes using logistic regression statistics in SPSS. P-value of <0.05 was used to depict the statistical significance.
Results
Baseline and Clinical Estimations
Age and sex-matched data were used for the analysis. SOD1 50bp Indel variant showed no significant deviation under Hardy Weinberg Equilibrium (HWE) in the control group (p=0.25). Baseline principle characteristics and clinical data of n=178 type 2 diabetes mellitus subjects and n=178 controls were compared in Table 1. Study revealed that systolic blood pressure (SBP) and diastolic blood pressure (DBP) were significantly higher in type 2 diabetic group. Body mass index (BMI) showed slight deviation and depicted no significant difference between the groups. Higher levels of Fasting blood glucose (FBG), random blood glucose (RBG), low-density lipoproteins (LDL) cholesterol, high-density lipoproteins (HDL) cholesterol, total cholesterol (TC) levels, and glycated hemoglobin HbA1c in type 2 diabetic subjects demonstrated significant association with higher susceptibility of disease in comparison control group (p<0.001). However, triglyceride (TG) levels in the lipid profile showed no significant difference between the diseased and controls.
| Parameters | T2DM | Controls | p value |
| No of patients | n= 178 | n= 178 | - |
| Age (years) | 58.0 ± 7.10 | 51.0 ± 3.21 | 0.45 |
| BMI (kg m-2) | 26.7 ± 0.49 | 27.9 ± 0.30 | 0.21 |
| SBP (mmHg) | 126.7 ± 0.73 | 133.6 ± 1.17 | 0.00*** |
| DBP (mmHg) | 87.4 ± 0.46 | 74.3 ± 0.79 | 0.00*** |
| FBG (mg dl-1) | 167.3 ± 2.56 | 91.7 ± 0.77 | 0.00*** |
| RBG (mg dl-1) | 290.3 ± 8.34 | 117.3 ± 1.44 | 0.00*** |
| LDL (mg dl-1) | 136.2 ± 2.58 | 98.64 ± 1.20 | 0.01** |
| HDL (mg dl-1) | 37.28 ± 0.71 | 52.05 ± 0.47 | 0.00*** |
| TG (mg dl-1) | 160.68 ± 7.72 | 154.53 ± 1.12 | 0.99 |
| TC (mg dl-1) | 187.56 ± 2.64 | 121.17 ± 1.59 | 0.00*** |
| HbA1c (%) | 9.28 ± 0.12 | 5.38 ± 0.06 | 0.00*** |
Table 1: Assessment of baseline data and clinical profile between T2DM and controls.
Mean ± standard deviation (SD), p< 0.01, * p< 0.001. Table 1: Assessment of baseline data and clinical profile between T2DM and controls.
Association Analysis of SOD1 Genotypes
The association analysis of SOD1 50 bp Indel polymorphism with type 2 diabetes among n=178 diabetic subjects and n=181 controls was represented in Table 2. No statistical significance was observed in the comparison of genotypic and allelic distribution of SOD1 50 bp Indel polymorphism between cases and controls. Higher frequency of I/I (0.77) and I/D genotype (0.22) was observed in type
2 diabetic group. This study reflected a weak insignificant association of SOD1 50 bp Indel polymorphism to the susceptibility of type 2 diabetes (OR=1.14 & 95% CI= 0.59- 2.2, Fisher’s exact=2.0, p=0.325). Strength of association with alleles tested by odds ratio demonstrated that the risk of type 2 diabetes mellitus was 1.14 folds higher with the presence of mutant allele D. However, the risk ratio was not supported by statistical significance.
| Genotypes (n=359) | T2DM (n=178) | Controls (n=181) | Fisher’s Exact Test |
| I/I | 137 (0.77) | 146 (0.81) | 2.0 |
| I/D | 40 (0.22) | 32 (0.17) | p=0.32 |
| D/D | 1 (0.01) | 3 (0.02) | |
| Alleles (n=718) | T2DM (n=356) | Controls (n=362) | OR (95% C.I.) |
| I | 314 (0.88) | 324 (0.90) | 1.14 (0.59-2.21) |
| D | 42 (0.12) | 38 (0.10) | p=0.69 |
Table 2: Frequencies of SOD1 50 bp Indel polymorphism and their association with T2DM.
p<0.05, OR=odds ratio, C.I.= confidence interval, HWE =0.25 (controls), OR<1.0 protective, OR>1.0 risk. Table 2: Frequencies of SOD1 50 bp Indel polymorphism and their association with T2DM.
Genetic Models of SOD1 Polymorphism
Four genetic models established to investigate their relationship with the progression of disease were also illustrated in Table 3. Dominant (OR=0.45) and over dominant models (OR=0.43) showed a significant association with a defensive response against the pathogenicity of type 2 diabetes (p<0.05). The recessive model showed an insignificant role in the formation of risk for type 2 diabetes (OR=0.98). Co-dominant model described no significant association with higher disease susceptibility. Above outcomes suggested that the D allele might confer a risk effect and I allele pronounced a protective effect for type 2 diabetes mellitus.
| Genetic Models | Genotypes | OR (95% CI) | p value | |
|---|---|---|---|---|
| Codominant | I/I | 1.00 | Ref | |
| Codominant | I/D | 0.43 (0.19-0.96) | 0.11 | |
| Codominant | D/D | 0.81 (0.06-11.83) | ||
| Dominant | I/I | 1.00 | Ref | |
| Dominant | I/D-D/D | 0.45 (0.21-0.98) | 0.042* | |
| Recessive | I/I-I/D | 1.00 | Ref | |
| Recessive | D/D | 0.97 (0.07-13.90) | 0.98 | |
| Over dominant | I/I-D/D | 1.00 | Ref | |
| Over dominant | I/D | 0.43 (0.20-0.96) | 0.037* |
Table 3: Role of genetic models of SOD1 50 bp Indel polymorphism in developing the risk for T2DM.
Four hypothetical models of genotypes, Ref: reference value, *p<0.05, OR=odds ratio, 95% C.I.=confidence interval, OR<1.0 protective, OR>1.0 risk. Table 3: Role of genetic models of SOD1 50 bp Indel polymorphism in developing the risk for T2DM.
Clinical Associations with SOD1 Genotypes
Relationship of clinical profile with genotypes of SOD1 polymorphism was analysed by regression analysis described in Table 4. Statistical odds ratio estimated between T2DM and control groups was used for testing the impact of clinical profile on the genotypes of SOD1 Indel polymorphism. Significant association of BMI (p<0.05), LDL (p<0.05), HDL (p<0.001), TC (p<0.01), FBG, RBG, and HbA1c (p<0.001) was observed with wild type I/I genotype of SOD1 polymorphism. Furthermore, BMI, SBP (p<0.05), FBG, RBG, and HbA1c (p<0.001) parameters demonstrated significantly higher levels in the carriers of heterozygous I/D genotype. Clinical parameters showed significant association in mutant D/D genotype with respect to the susceptibility of T2DM. The higher HbA1c levels in T2DM patients of wild- type homozygous and heterozygous genotypes of SOD1 polymorphism reflected the presence of a significant strong association with the pathogenicity of T2DM.
| Parameters | Groups | SOD1 I/I Genotype | SOD1 I/D Genotype | SOD1 D/D Genotype |
|---|---|---|---|---|
| BMI kg m-2 | OR (95%CI) p value | 1.02 (1.08-1.44) p<0.05* | 1.0 (0.39-0.84) p<0.05* | 1.11 (1.05-1.16) p=0.29 |
| SBP mmHg | OR (95%CI) p value | 0.97 (0.29-0.98) p=0.77 | 1.0 (1.05-1.01) p<0.05* | 0.99 (0.47-0.99) p=0.45 |
| DBP mmHg | OR (95%CI) p value | 0.98 (1.02-1.17) p=0.44 | 0.92 (0.15-0.60) p=0.65 | 0.98 (0.88-0.97) p=0.32 |
| LDL mg dl-1 | OR (95%CI) p value | 1.00 (0.90-1.12) p<0.05* | 0.99 (1.06 × 0.87) p=0.51 | 0.96 (0.32-0.36) p=0.31 |
| HDL mg dl-1 | OR (95%CI) p value | 0.88 (0.01-1.14) p<0.001*** | 0.96 (0.08-1.44) p=0.78 | 1.01 (1.0-1.14) p=0.99 |
| TG mg dl-1 | OR (95%CI) p value | 1.00 (0.12-1.27) p=0.66 | 0.99 (0.10-1.87) p=0.43 | 0.99 (0.13-1.07) p=0.06 |
| TC mg dl-1 | OR (95%CI) p value | 0.99 (0.44-1.96) p<0.01** | 1.01 (0.12-1.11) p=0.08 | 1.03 (0.24-1.06) p=0.12 |
| FBG mg dl-1 | OR (95%CI) p value | 1.06 (0.29-1.82) p<0.001*** | 1.04 (0.19-1.17) p<0.001*** | 1.00 (0.22-1.94) p=0.57 |
| RBG mg dl-1 | OR (95%CI) p value | 1.01 (0.10-1.12) p<0.001*** | 1.01 (0.92-1.33) p<0.001*** | 1.00 (0.88-1.02) p=0.09 |
| HbA1c % | OR (95%CI) p value | 1.79 (0.11-1.14) p<0.001*** | 1.42 (0.16-1.08) p<0.001*** | 1.00 (0.01-1.11) p=0.11 |
Table 4: Clinical profile relationship with genotypes of SOD1 50 bp Indel polymorphism.
OR=odds ratio, 95% confidence interval, *p < 0.05, p< 0.01, *p< 0.001. Table 4: Clinical profile relationship with genotypes of SOD1 50 bp Indel polymorphism.
Discussion
This study presented the data of SOD1 50bp Indel polymorphism in association with T2DM disease. Findings suggested an insignificant association with higher susceptibility of type 2 diabetes mellitus (T2DM) in a local population. However, this polymorphism of SOD1 50 bp deletion has previously been investigated in several studies which link its association with the risk of multiple diseases such as sporadic amyotrophic lateral sclerosis, cardiovascular disorder, heroin dependency, and type 1 bipolar disorder [18, 13, 14, 15]. Earlier studies revealed that among the heterozygous population, the D allele played a vital role in reducing the expression level of the SOD1 enzyme up to 33% [12]. It has been reported that the D allele is also involved in the reduction of SOD1 enzyme activity [19]. As an antioxidant enzyme, SOD1 plays a crucial role in the etiology of various complicated disorders which show a direct or indirect association with the development of oxidative stress [20, 21, 22, 23]. This 50 bp Indel polymorphism was known to be involved in the down-regulation of SOD1 activity which in turn reduces the detoxification of reactive oxygen species (ROS) [24]. Thus, the integrity of the whole-genome withstands because of inter-individual differences which develop due to the interaction of DNA with ROS [15]. The presence of high ROS levels is responsible to develop oxidative stress, which was recognized to play a significant role in the pathophysiology of diabetes mellitus [25].
In the present study, dominant and over dominant states of SOD1 50 bp polymorphism may develops risk effect with the pathogenicity of type 2 diabetes mellitus (Table 2). Present analysis of SOD1 polymorphism recommended that the SOD1 I/D genotype was more prevalent in type 2 diabetes patients and wild type I/I genotype was frequent in controls population. A study conducted in 2014, reported that among two genotypes (I/D, D/D) of SOD1 50 bp Indel polymorphism, D allele conferred a higher effect of risk with enhanced susceptibility of cardiovascular disorder (CVD) in the south-east Iranian population [13]. No
significant association between the genetic variant of 50 bp deletion in the promotor of SOD1 locus with the phenotype of sporadic amyotrophic lateral sclerosis (SALS) was identified. Nonetheless, outcomes revealed an association of female SALS subjects with the wild-type homozygosity [18]. In another study, heterozygous I/D genotype showed insignificant association with the risk factor of heroin dependency. Furthermore, the study reflected a negative impact on the mRNA level [15]. Though, SOD1 mutation was also reported in association with a psychiatric illness of type1 bipolar disorder in the Iranian population. Data revealed no signs of a positive relationship with disease risk, but it showed a significant association with the age of type1 bipolar disorder patients at the time of diagnosis [14]. Genotypes of I/D and D/D of SOD1 50 bp polymorphism were reported to be more frequent in CVD patients with a positive history of hypertension [13]. In diabetes mellitus, obesity, and kidney disorders activity of SOD1 was found to be increased in the presence of hypertension [26, 27, 28].
In the present research, statistical analysis inferred that SOD1 50 bp Indel polymorphism was associated with dominant and over dominant genotypic models. Thus, it suggested the involvement of the D allele in the dominant state in developing the protection against the pathogenicity of T2DM (Table 3). The present analysis of SOD1 polymorphism recommended that the SOD1 I/D genotype was more prevalent in T2DM patients, whereas the controls carried wild type I/I genotype in most of their population. Though, the results are not supported by statistical significance. Besides that, the frequency of D/D genotype was found to be very low in the disease group (1 out of 178 patients). But it is important to know that the frequency of the D allele was higher in cases than controls, due to the higher prevalence of the I/D genotype in T2DM patients. The clinical profile was also analyzed in this study, which revealed a significant association of glycated hemoglobin levels with T2DM in the carriers of I/I and I/D genotypes (Table 4). This limitation could be overcome by considering that the ethnicity of every population plays a major role in the distribution of genotypes. Distribution could be altered from population to population and the number of participants included in the research. Statistical outcomes of the study can be improved by increasing the sample size of study groups. Furthermore, mRNA and protein expression of SOD1 associated with SOD1 50 bp indel polymorphism would be beneficial and will give the insight to understand the association of indel polymorphism with type 2 diabetes mellitus. Restricted sample size and insignificant distribution of alleles in comparison with other population are the considered as the limitations of this study. However, a dominant state of this polymorphism regarded as a significant biomarker to predict the susceptibility of the disease considered as the potential strength of this study.
Conclusion
Comprehensive analysis of antioxidant enzyme SOD1 gene 50bp Indel polymorphism may assist to identify the potential genetic biomarkers for the type 2 diabetes mellitus. Our study revealed the genetic distribution pattern of this polymorphism and estimated the risk associated with the susceptibility of type 2 diabetes mellitus. Dominant I/I genotype of SOD1 50 bp Indel polymorphism inferred a protective role against the pathogenesis of T2DM. Current research has provided the data regarding the genotypic distribution of this polymorphism among the Pakistani population. In future, expressional variability data in association with SOD1 50 bp indel polymorphism could be explored to give a better insight in pathophysiology of type 2 diabetes mellitus.
Conflict of Interest
Authors declared no conflict of interest.
Funding
This study was conducted by the financial support of higher education commission (HEC) under research grant Ref No. 6575/SINDH/NRPU/R&D/HEC/2015.
Ethical Approval
This study was performed in line with the principles of the Declaration of Helsinki. Approval was granted by the Institutional Ethical Committee of The Karachi Institute of Biotechnology and Genetic Engineering (KIBGE), the University of Karachi [Ref No. KIBGE/ICE/080/2016].
Data Availability
Related genotyping data is available upon request from corresponding author.
Authors Contributions
Sanober Kafeel completed sampling, practical performance, data analysis and written original manuscript. Asher Fawwad provided support in hospital approval, collection of blood samples and patients’ history, and critically reviewed the manuscript. Zehra Hashim provided assistance in experimental work, draft writing and editing of the manuscript. Syeda Nuzhat Nawab designed the study, involved in laboratory work, provided materials, performed statistics, and reviewed the manuscript.
References
-
Garcia GU, Vicente AB, Jebari S, Sebal AL, Siddiqi H, et al. (2020) Pathophysiology of type 2 diabetes mellitus. Int J Mol Sci 21(17): 6275.
-
Saeedi P, Petersohn I, Salpea P, Malanda B, Karuranga S, et al. (2019) Global and regional diabetes prevalence estimates for 2019 and projections for 2030 and 2045: results from the international diabetes federation diabetes atlas. Diabetes Res Clin Pract 157: 107843.
-
Takayanagi R, Inoguchi T, Ohnaka K (2010) Clinical and experimental evidence for oxidative stress as an exacerbating factor of diabetes mellitus. J Clin Biochem Nutr 48(1): 72-77.
-
Tangvarasittichai S (2015) Oxidative stress, insulin resistance, dyslipidemia and type 2 diabetes mellitus. World J Diabetes 6(3): 456-480.
-
Sherman L, Dafni N, Hurwitz JL, Groner Y (1983) Nucleotide sequence and expression of human chromosome 21-encoded superoxide dismutase mRNA. Proc Natl Acad Sci USA 80: 5465-5469.
-
Masser DR, Clark NW, Van Remmen H, Freeman WM (2016) Loss of the antioxidant enzyme CuZnSOD (_SOD1_) mimics an age-related increase in absolute mitochondrial DNA copy number in the skeletal muscle. Age 38(4): 323-333.
-
Mondola P, Damiano S, Sasso A, Santillo M (2016) The Cu, Zn superoxide dismutase: not only a dismutase enzyme. Front Physiol 7: 594.
-
Banerjee M, Vats P (2014) Reactive metabolites and antioxidant gene polymorphisms in type 2 diabetes mellitus. Redox Biol 2: 170-177.
-
Vats P, Sagar N, Singh TP, Banerjee M (2015) Association of superoxide dismutases (_SOD1_ and _SOD2_) and glutathione peroxidase 1 (_GPX1_) gene polymorphisms with type 2 diabetes mellitus. Free Radic Res 49(1): 17- 24.
-
Kasznicki J, Sliwinska A, Kosmalski M, Merecz A, Majsterek I, et al. (2016) Genetic polymorphisms (Pro197Leu of GPX1,+ 35A/C of _SOD1_,− 262C/T of CAT), the level of antioxidant proteins (GPX1, _SOD1_, CAT) and the risk of distal symmetric polyneuropathy in Polish patients with type 2 diabetes mellitus. Adv Med Sci 61(1): 123-129.
-
Gusti AM, Qusti SY, Alshammari EM, Toraih EA, Fawzy MS (2021) Antioxidants-related superoxide dismutase (_SOD_), catalase (_CAT_), glutathione peroxidase (_GPX_), glutathione-s-transferase (_GST_), and nitric oxide synthase (_NOS_) gene variants analysis in an obese population: a preliminary case-control study. Antioxidants 10(4): 595.
-
Broom WJ, Greenway M, Vakili GS, Russ C, Auwarter KE, et al. (2008) 50bp deletion in the promoter for superoxide dismutase 1 (_SOD1_) reduces _SOD1_ expression in vitro and may correlate with increased age of onset of sporadic amyotrophic lateral sclerosis. Amyotroph Lateral Scler 9(4): 229-237.
-
Nasab EE, Nejad EK, Nakhaee A, Afzali M, Tabatabaei SP, et al. (2014) 50 bp I/D polymorphism of _SOD1_ is associated with increased risk of cardiovascular disease. Acta Medica Iranica 52(8): 591-595.
-
Kordestanian N, Saadat M (2017) A 50-bp I/D polymorphism at the promoter region of the superoxide dismutase-1 and bipolar disorder type 1. Nord J Psychiatry 71(8): 570-573.
-
Saify K, Saadat M (2017) Influence of a 50 bp I/D polymorphism at promoter of the superoxide dismutase-1 on gene expression and risk of heroin dependency. Environ Health Prev Med 22: 4.
-
Miller SA, Dykes DD, Polesky HF (1988) A simple salting out procedure for extracting DNA from human nucleated cells. Nucleic Acids Res 16(3): 1215.
-
Solé X, Guinó E, Valls J, Iniesta R, Moreno V (2006) SNPStats: a web tool for the analysis of association studies. Bioinformatics 22(15): 1928-1929.
-
Broom WJ, Parton MJ, Vance CA, Russ C, Andersen PM, et al. (2004) No association of the _SOD1_ locus and disease susceptibility or phenotype in sporadic ALS. Neurology 63(12): 2419-2422.
-
Ingre C, Wuolikainen A, Marklund SL, Birve A, Press R, et al. (2016) A 50 bp deletion in the _SOD1_ promoter lowers enzyme expression but is not associated with ALS in Sweden. Amyotroph Lateral Scler Frontotemporal Degener 17(5-6): 452-457.
-
Beebe DC, Holekamp NM, Shui YB (2010) Oxidative damage and the prevention of age-related cataracts. Ophthalmic Res 44(3): 155-165.
-
He F, Zuo L (2015) Redox roles of reactive oxygen species in cardiovascular diseases_._ Int J Mol Sci 16(11): 27770- 27780.
-
Smaga I, Niedzielska E, Gawlik M, Moniczewski A, Krzek J, et al. (2015) Oxidative stress as an etiological factor and a potential treatment target of psychiatric disorders part 2. depression, anxiety, schizophrenia and autism. Pharmacol Rep 67(3): 569-580.
-
Mrowicka M, Mrowicki J, Kucharska E, Smigielska B, Szaflik JP, et al. (2021) The role of oxidative stress and the importance of miRNAs as potential biomarkers in the development of age-related macular degeneration. Processes 9(8): 1328.
-
Lin ZF, Xu HB, Wang JY, Lin Q, Ruan Z, et al. (2013) SIRT5 desuccinylates and activates _SOD1_ to eliminate ROS. Biochem Biophys Res Commun 441(1): 191-195.
-
Luc K, Luc AS, Guzik TJ, Mikolajczyk TP (2019) Oxidative stress and inflammatory markers in prediabetes and diabetes. J Physiol Pharmacol 70(6): 809-824.
-
Nishi EE, Sales EBO, Bergamaschi CT, Oliveira TG, Boim MA, et al. (2010) Chronic antioxidant treatment improves arterial renovascular hypertension and oxidative stress markers in the kidney in wistar rats. Am J Hypertens 23(5): 473-480.
-
Lans VG, Ruiz MER, Torres IP, de Maccarthy GB (2011) Relation of aging and sex hormones to metabolic syndrome and cardiovascular disease. Exp Gerontol 46(7): 517-523.
-
Konno S, Hirooka Y, Kishi T (2012) Sympathoinhibitory effects of telmisartan through the reduction of oxidative stress in the rostral ventrolateral medulla of obesity- induced hypertensive rats_._ J Hypertens 30(10): 1992- 1999.
- Investigation of Polymorphisms in PPAR-Ɣ and TRHR Genes and their Impact on Turkish Diabetic and Obese Individuals
- The Impact of Aircraft Noise Exposure on the Efficacy of Empagliflozin Therapy in an Animal Model of Obesity
- Rooibos Mitigates Metabolic and Inflammatory Dysfunctions in Mice Fed a High-Carbohydrate Diet
- Synergistic Effect of Combined Leaf Extract of Vernonia amygdalina, Ocimum gratissimum, and Zingiber officinale Tuber on Phytochemical Profile, Antioxidant Activity, Serum Insulin, and Biochemical Parameters in Streptozotocin-Induced Diabetic Rats
- Investigation of Cardiovascular Responses to Aerobic Exercise in Obese University Students
- A Look at the Phase Angle Obtained by Electrical Bioimpedance