Applying Numerical Optimization Technique in the Development of Valueadded Powdered Custard
Custard powder is a relatively shelf-stable, fine textured, dry-formulated, carbohydrate-rich breakfast food product primarily made from corn starch with the addition of salt, flavoring, and coloring agents and with or without the inclusion of egg yolk solids, vitamins, and minerals. The aim of this study was to formulate, characterize, and optimize value-added custard from millet, soybean, and tigernut. A three-component constrained optimal (custom) mixture experimental design, with 69 randomized experimental runs, was employed. The formulation design constraints were: millet (10% - 70%), soybean (10% - 70%), and tigernut (10% - 70%). Other constant components of the formulation were sweet potato extract (3%), date (2 %), clove (1%), cinnamon (1%), turmeric (1%), and ginger (2%). The formulated samples were analyzed and evaluated for quality and sensory characteristics using standard procedures. The result of the optimization gave optimized custard with an overall desirability index of 0.535, based on the set optimization goals and individual quality desirability indices. The optimal formulated value-added custard was obtained from 10.0 % millet flour, 49.3 % soybean meal, and 30.7 % tigernut. The quality properties of this optimal custard are 3.78 % ash content, 28.5 % crude protein, 10.1 % moisture content, 20.1 % fat content, 4.43 % crude fibre, 33.9 % carbohydrate, and 5.79 overall acceptability. The result of the study showed that the formulated value-added custard was found to be of higher quality than the traditional custard which is produced from monocereals. Improving the nutritional quality of food and tackling nutrient deficiencies, particularly protein energy malnutrition in populations, is possible through the application of numerical optimization technique in development new, dietary-based food products.
Introduction
Custard is a breakfast cereals meal, primarily, made from grains such as Corn (Zea mays), millet (Pennisetum glaucum), sorghum, wheat (Triticum), rice (Oryza sativa), or oats (Avena sativa); processed with added flavour and fortified with vitamins and minerals. It is convenient, relatively shelf stable and typically consumed with milk and fruit as the first meal of the day [1, 2, 3, 4]. The global breakfast cereals market was estimated to be US$ 37 billion in 2016 and is expected to grow to US$ 50 billion by 2023 [5, 6]. The largest market of breakfast cereals is in North America, with Europe being the second largest. In 2016, North America had 59% of the breakfast cereals market, while Europe/Middle East/Africa and Asia Pacific had 30% and 11%, respectively [7]. In United Kingdom, the average daily purchase of breakfast cereals in 2006 - 2015 was 130 g per day [1, 8]. Consumption of custard is increasing especially in developing countries. The current custard market is driven by changing food habits, lifestyle, convenience, and rising trend in consuming low-calorie food. Nutritional properties and health relevance are also part of the key driving force.
Most traditional custard is produced from mono-cereals and consists essentially of carbohydrate. Consumers are increasingly looking for healthier custard from multigrain that are high in fiber or protein, low in carbohydrates, and free of artificial colours and flavours. The breakfast cereals business needs to meet consumer expectations in terms of nutrition, health, and taste. Protein-energy malnutrition and micronutrient deficiencies constitute the most dreaded nutritional problems faced in developing countries. There is need the to improve the nutritional quality of locally available breakfast cereal meals. Food with high protein and fibre content are now mostly preferred by consumers to maintain health and keep away from many types of diseases. So, there is the need to develop and optimize value added, multi-cereal custard that combines health benefits with good sensory properties so as to eliminate the issue of nutrient imbalance in the traditional custard.
Multi-cereal meals are a rich source of nutrition and phytochemical compounds which make them a good source of antioxidants. These phytochemicals have potential impact on human health. Millet is rich in dietary fiber, both soluble and insoluble. The outstanding nutrients in millets include protein, ash, minerals (Ca, Fe, K, Mg and Zn) and B vitamins (B6 and folic acid). Millets are non-glutinous and non-acid forming foods. They have many nutraceuticals and health promoting properties especially the high fibre content.
The insoluble fiber in millet supports good bacteria in the digestive system (prebiotic). This type of fiber is also and reduces the risk of colon cancer. Soybeans are high in protein and a decent source of both carbs and fat. They are a rich source of various vitamins, minerals, and beneficial plant compounds, such as is flavones. They reduce the risk of prostate and breast cancer. Sweet potato is rich in vitamin and helps to keep the eyes healthy as well as the immune system, of the body. It’s also good for the reproductive system and organs like the heart and kidneys. Dates are very nutritious, rich in Fiber, high in disease-fighting antioxidants, promote brain health and are excellent natural sweeteners. Cloves are full of antioxidants, compounds which prevents the damage of body cells. Cinnamon is well known for its blood-sugar- lowering properties. Turmeric’s active ingredient curcumin is an anti-inflammatory. It is also rich in vitamin C, vitamin B6, and other antioxidants that reduce the risk of serious health conditions like heart disease and diabetes. Ginger is loaded with antioxidants, compounds that prevent stress and damage to the body’s DNA. They help your body fight off chronic diseases like high blood pressure, heart disease, diseases of the lungs, and also promote healthy aging. The aim of this study is to formulate, characterize, and optimize value added custard from three major variable blends (millet, soybean, tigernut) and other minor, constant components (sweet potato extract, date, clove, cinnamon, turmeric, and ginger), using constrained optimal (custom) mixture experimental design.
Materials and Methods
Materials
Custard can be developed from different grains. The raw materials used for this study were millet, Tiger Nuts, soybean (Glycine max), sweet potato (Ipomoea batatas) extract, date (Phoenix dactylifera), clove (Syzygium aromaticum), cinnamon (Cinnamomum verum), turmeric, and ginger (Zingiber officinale). These materials were purchased in Kure market in Minna, Niger State, Nigeria.
Processing of Millet Flour, Soybean, and Tigernut Meals
Properly cleaned, dry millet grains, soybean and tigernut were milled into fine powder and stored under room temperature prior to use.
Methods
Experimental Design for the Formulation of Value- Added Breakfast Cereal Meals: The formulations of value-added custard were carried out using constrained optimal (custom) mixture experimental design and response surface methodology, employing Design-Expert software (version 11, Stat-Ease Inc., Minneapolis, U.S.A), which gave 69 randomized experimental runs. D-optimal designs are one form of design provided by a computer algorithm. They are often used in researches where classical designs do not apply. Unlike standard classical designs such as factorials and fractional factorials, D-optimal design matrices are usually not orthogonal and effect estimates are correlated. These types of designs are always an option regardless of the type of model the experimenter wishes to fit (for example, first order, first order plus some interactions, full quadratic, cubic, etc.) or the objective specified for the experiment (for example, screening, response surface, etc.). D-optimal designs are straight optimizations based on a chosen optimality criterion and the model that will be fit. The
optimality criterion used in generating D-optimal designs is one of maximizing |X’X|, the determinant of the information matrix X’X. This ‘optimality’ of a given D-optimal design is model dependent.
The formulation design constraints were: millet flour ( ) 1 10% 70% , x ≤ ≤ soybean ( ) 2 10% 70% , x ≤ ≤ and tigernut ( ) 3 10% 70% . x ≤ ≤ Other constant components of the formulation were sweet potato extract (3%), date (2 %), clove (1%), cinnamon (1%), turmeric (1%), and ginger (2%). The design matrix used for the formulation experiment was presented in Table 1. The samples were prepared based on the design matrix. The other minor components were added to each of the sixty-nine samples and mixed together thoroughly, to obtained homogeneous mixture.
Proximate Analysis and Sensory Evaluations: The quality characteristic of custard which was measured using the method described by the Association of Analytical Chemist [9]; include ash, crude protein, moisture content, fat, crude fibre, and carbohydrate. The sensory evaluation of the samples was conducted using thirty trained panelists. The samples were evaluated for taste, flavour, sweetness, colour, texture and overall acceptability. A 9-point hedonic scale ranging from 9 = like extremely and 1= dislike extremely was used to evaluate the samples.
Statistical Analysis
The experimental data were analyzed and appropriate Scheffe canonical models were fitted to the mean proximate property data. The statistical significance of the terms in the Scheffe canonical regression models were tested using analysis of variance (ANOVA) for each response, and the adequacy of the models were evaluated by coefficient of determination, F-value, and model p-values at the 5% level of significance. The models were also subjected to lack- of-fit and adequacy tests. The fitted models for each of the response were used to generate 3-D response surface as well as the contour plots for the proximate properties using the DESIGN EXPERT 11.0 statistical software.
Numerical Optimization: A Numerical optimization approach, exploiting the desirability function technique, was utilized to generate the optimal formulation with the anticipated responses. Numerical optimization becomes essential when investigating many components with many responses. Numerical optimization maximizes, minimizes, or targets desired response based on set criteria for all variables, including components proportions. Components can be allowed to range within their pre-established constraints in the design or they can be set to desired goals. Also, components can be set equal to specified levels. Optimization goals are assigned to parameters and these goals were used to construct desirability indices (di). Desirability index range from zero to one for any given response and individual desirability for all the responses, in the case of multi-response optimization, are combined into a single number known as overall desirability index. A value of one represents the case where all goals are met perfectly. A zero indicates that one or more responses fall outside the set desirable limits.
Under this approach, each ith response is assigned a desirability function, id , where the value of id varies between 0 and 1. The function is defined differently based on the objective of the response. If the response is to be maximized, then id is defined as follows:
0 y L < − = ≤ ≤ − >
i w i i i y L d L y T T L y T
( )
1
1 i Where T represents the target value of the ith response, iy , L represents the acceptable lower limit value for this response and w represents the weight. When 1 w = the function is linear. If 1 w > then more importance is placed on achieving the target for the response, iy . When 1 w < , less weight is assigned to achieving the target for the response, iy . If the response is to be minimized, as in the case when the response is cost, is then id is defined as follows:
1 y T < − = ≤ ≤ − >
i w i i i U y d T y U U T y U
( )
2
0 i Where U represents the acceptable upper limit for the response. There may be times when the experimenter wants the response to be neither maximized nor minimized, but instead stay as close to a specified target as possible. In such cases, the desirability function is defined as follows:
0 L
y < − ≤ ≤ − = − ≤ ≤ − > i w i i y L y T T L d U y T y U U T y U
1 L 3
( ) i w i i
2
0 i
Once a desirability function is defined for each of the responses, assuming that there are m responses, an overall desirability function is obtained as follows:
( ) ( ) ( ) 3 1 2 1 2 3 ........ 1 1 2 3 . . ......... 4 m m r r r r r r r r m D d d d d + + + + = Where the ir s represent the importance of each response. The greater the value of ir , the more important the response with respect to the other responses. The objective is to now find the settings that return the maximum value of . D the rationale for using a geometric rather than an arithmetic mean is that if any individual desirability di is equal to zero, then the overall desirability will also be equal to zero.
Numerical optimization solutions are given as a list, in their order of desirability, detailing the components Run 1_x_ %
2_x_ %
3_x_ %
3_x_ %
3_x_ %
3_x_ %
3_x_ %
3_x_ %
3_x_ % ycp yac % %
proportions and process variables values that satisfies the set criteria and the overall desirability. The numerical solution can be presented in the form of desirability contour and 3-D Surface plots, optimal bar graph and graphical optimization overlay contour plot; showing the optimized formulation compositions and/or regions that meet specifications [10, 11, 12, 13].
Experimental Results and Results of Statistical Analyses
The design matrix for the formulation of the value-added custard and the results of proximate analysis and sensory evaluations of the formulated custard were presented in Table 1.
ycf ymc ycho y fat yta y fl ysw ycl ytx yoa
% % % %
| 23 | 30 | 30 | 30 | 3 | 2 | 1 | 1 | 1 | 2 | 3.51 | 28.3 | 10.2 | 23.2 | 6.1 | 28.3 | 7.1 | 6.8 | 6.3 | 5.5 | 4.9 | 7 |
|---|---|---|---|---|---|---|---|---|---|---|---|---|---|---|---|---|---|---|---|---|---|
| 24 | 29 | 31 | 30 | 3 | 2 | 1 | 1 | 1 | 2 | 3.39 | 26.4 | 13 | 18.5 | 5.5 | 33.4 | 6.8 | 6.1 | 5.5 | 4 | 3.9 | 5.2 |
| 25 | 30 | 30 | 30 | 3 | 2 | 1 | 1 | 1 | 2 | 3.42 | 28.4 | 14.3 | 12.6 | 4.4 | 36.9 | 7 | 7.2 | 6.3 | 5.4 | 5.2 | 5.7 |
| 26 | 30 | 30 | 30 | 3 | 2 | 1 | 1 | 1 | 2 | 3.04 | 33.5 | 13.8 | 12.6 | 4.9 | 32.1 | 8 | 7.2 | 7.4 | 6.9 | 5 | 7 |
| 27 | 29 | 30 | 31 | 3 | 2 | 1 | 1 | 1 | 2 | 5.19 | 22.7 | 10.4 | 18.4 | 5.2 | 38.1 | 4.9 | 5.1 | 6.2 | 6.1 | 5.9 | 5.7 |
| 28 | 70 | 10 | 10 | 3 | 2 | 1 | 1 | 1 | 2 | 4.48 | 24.1 | 5.23 | 15.7 | 3.8 | 46.7 | 7.1 | 7.2 | 7.9 | 6.1 | 5.9 | 7.1 |
| 29 | 29 | 30 | 31 | 3 | 2 | 1 | 1 | 1 | 2 | 3.66 | 24.7 | 10.7 | 26.1 | 3.9 | 37.1 | 7.2 | 6.1 | 5.4 | 4.4 | 4 | 5.3 |
| 30 | 10 | 70 | 10 | 3 | 2 | 1 | 1 | 1 | 2 | 4.85 | 23.9 | 6.14 | 15 | 3.3 | 46.8 | 6.1 | 7.1 | 7.5 | 7.9 | 5.2 | 7.8 |
| 31 | 30 | 30 | 30 | 3 | 2 | 1 | 1 | 1 | 2 | 3.68 | 27.3 | 8.98 | 23.6 | 4.4 | 32 | 6.1 | 6.2 | 6.9 | 6.5 | 4.4 | 5.8 |
| 32 | 10 | 10 | 70 | 3 | 2 | 1 | 1 | 1 | 2 | 3 | 24.3 | 6.74 | 23.7 | 4.7 | 37.5 | 7.1 | 7.8 | 4.8 | 4.4 | 4.3 | 5.03 |
| 33 | 30 | 31 | 29 | 3 | 2 | 1 | 1 | 1 | 2 | 3.43 | 21.7 | 12.4 | 21.5 | 4.26 | 36.8 | 8 | 4.1 | 5.8 | 7.2 | 4.9 | 6.9 |
| 34 | 70 | 10 | 10 | 3 | 2 | 1 | 1 | 1 | 2 | 2.65 | 19.4 | 11.8 | 15.6 | 3.8 | 46.8 | 7.4 | 6.4 | 8.1 | 8.2 | 5.9 | 7.05 |
| 35 | 29 | 31 | 30 | 3 | 2 | 1 | 1 | 1 | 2 | 3.2 | 35.2 | 10.3 | 20.6 | 4.9 | 25.7 | 7.1 | 6.2 | 6.3 | 6.5 | 7.1 | 6.8 |
| 36 | 30 | 30 | 30 | 3 | 2 | 1 | 1 | 1 | 2 | 3.58 | 25.5 | 13.3 | 14.3 | 5.36 | 38 | 5.2 | 6.1 | 4.9 | 7.5 | 6.1 | 6.02 |
| 37 | 29 | 30 | 31 | 3 | 2 | 1 | 1 | 1 | 2 | 3.86 | 25.9 | 12.6 | 11.9 | 4.1 | 41.6 | 5 | 5.01 | 5.03 | 5.08 | 4.08 | 4.05 |
| 38 | 10 | 70 | 10 | 3 | 2 | 1 | 1 | 1 | 2 | 3.88 | 26.1 | 7.27 | 19.8 | 3.9 | 39.1 | 6.02 | 6.5 | 6.1 | 6.3 | 4.09 | 6 |
| 39 | 31 | 30 | 29 | 3 | 2 | 1 | 1 | 1 | 2 | 3.69 | 24.5 | 3.69 | 22.4 | 3.7 | 42.1 | 7 | 6.8 | 6.2 | 6.5 | 5.5 | 7 |
| 40 | 70 | 10 | 10 | 3 | 2 | 1 | 1 | 1 | 2 | 2.39 | 20.2 | 7.87 | 19.1 | 3.8 | 46.6 | 4.9 | 5.2 | 7.1 | 6.5 | 5.2 | 6.02 |
| 41 | 10 | 70 | 10 | 3 | 2 | 1 | 1 | 1 | 2 | 3.84 | 25.7 | 9.12 | 19.2 | 3.5 | 38.6 | 7.05 | 6.25 | 7.15 | 6.8 | 5.5 | 5.7 |
| 42 | 29 | 31 | 30 | 3 | 2 | 1 | 1 | 1 | 2 | 5.18 | 26.2 | 6.11 | 16.9 | 4.4 | 41.3 | 6.02 | 5.91 | 6.02 | 6.1 | 5.02 | 6.01 |
| 43 | 30 | 31 | 29 | 3 | 2 | 1 | 1 | 1 | 2 | 3.38 | 23.9 | 9.59 | 24.6 | 4.2 | 33.2 | 7.1 | 6.5 | 6.5 | 6.4 | 6.8 | 5.5 |
| 44 | 10 | 10 | 70 | 3 | 2 | 1 | 1 | 1 | 2 | 4.35 | 21.7 | 6.88 | 18.6 | 3.9 | 44.7 | 6.5 | 6.3 | 6.4 | 5.5 | 5.01 | 5.05 |
| 45 | 31 | 29 | 30 | 3 | 2 | 1 | 1 | 1 | 2 | 3.28 | 28 | 8.1 | 20.4 | 3.9 | 36.3 | 4.8 | 5.1 | 5.04 | 5.05 | 6.01 | 5.06 |
| 46 | 31 | 30 | 29 | 3 | 2 | 1 | 1 | 1 | 2 | 3 | 28 | 8.48 | 26.4 | 3.7 | 30.4 | 5.02 | 5.3 | 5.4 | 5.3 | 4.8 | 5.01 |
| 47 | 30 | 30 | 30 | 3 | 2 | 1 | 1 | 1 | 2 | 3.3 | 23.1 | 8.58 | 24.3 | 4.2 | 36.5 | 6.01 | 5.8 | 5.6 | 5.3 | 4.4 | 4.9 |
| 48 | 30 | 30 | 30 | 3 | 2 | 1 | 1 | 1 | 2 | 3.51 | 26.6 | 8.54 | 21 | 4.1 | 35.9 | 6.1 | 5.7 | 7.2 | 7.3 | 4.8 | 6.8 |
| 49 | 30 | 30 | 30 | 3 | 2 | 1 | 1 | 1 | 2 | 3.29 | 25.5 | 10.7 | 24.4 | 3.7 | 32.5 | 7.05 | 7.2 | 7.5 | 7.5 | 6 | 7.02 |
| 50 | 54 | 10 | 26 | 3 | 2 | 1 | 1 | 1 | 2 | 2.98 | 22.6 | 8.85 | 23 | 4.6 | 37.9 | 5.6 | 5.3 | 5.1 | 6.2 | 5 | 5 |
| 51 | 30 | 30 | 30 | 3 | 2 | 1 | 1 | 1 | 2 | 3.39 | 24.1 | 9.08 | 26.1 | 3.9 | 33.4 | 7.2 | 7.1 | 6.8 | 6.2 | 5.1 | 6.9 |
| 52 | 30 | 30 | 30 | 3 | 2 | 1 | 1 | 1 | 2 | 2.6 | 20.3 | 6.92 | 22.4 | 4.1 | 43.7 | 5.2 | 5.1 | 5.3 | 6.1 | 6.1 | 5.4 |
| 53 | 30 | 31 | 29 | 3 | 2 | 1 | 1 | 1 | 2 | 5.18 | 26 | 13.3 | 24.6 | 3.6 | 27.2 | 5.4 | 6.1 | 6.5 | 5.5 | 5.2 | 5.6 |
| 54 | 10 | 10 | 70 | 3 | 2 | 1 | 1 | 1 | 2 | 2.89 | 23.4 | 9.25 | 22 | 4.4 | 38.1 | 7.1 | 6.2 | 6.4 | 6.3 | 4.9 | 6.1 |
| 55 | 30 | 30 | 30 | 3 | 2 | 1 | 1 | 1 | 2 | 3.93 | 30.6 | 10.7 | 25.7 | 4.5 | 24.6 | 7.1 | 6.1 | 6 | 6 | 5 | 5.8 |
| 56 | 30 | 31 | 29 | 3 | 2 | 1 | 1 | 1 | 2 | 3.35 | 22.6 | 4.4 | 21 | 4.1 | 44.5 | 6.2 | 5.2 | 5.4 | 5.1 | 4.8 | 5.2 |
| 57 | 30 | 30 | 30 | 3 | 2 | 1 | 1 | 1 | 2 | 4.11 | 34 | 12 | 17.2 | 4.3 | 28.4 | 5.5 | 5.3 | 5.1 | 5 | 5.5 | 5.7 |
| 58 | 10 | 10 | 70 | 3 | 2 | 1 | 1 | 1 | 2 | 2.04 | 28.5 | 8.48 | 24.8 | 3.7 | 32.5 | 6.1 | 6.3 | 6 | 6 | 5 | 5.6 |
| 59 | 10 | 10 | 70 | 3 | 2 | 1 | 1 | 1 | 2 | 2.84 | 24.9 | 8.65 | 23.7 | 3.3 | 36.6 | 7.2 | 6.1 | 6 | 6.3 | 6 | 6.2 |
| 60 | 70 | 10 | 10 | 3 | 2 | 1 | 1 | 1 | 2 | 2.03 | 24.6 | 6.99 | 17.9 | 3.7 | 44.8 | 6.5 | 5.5 | 5.5 | 4 | 4 | 5.8 |
| 61 | 30 | 30 | 30 | 3 | 2 | 1 | 1 | 1 | 2 | 3.59 | 24.6 | 8.6 | 25.9 | 3.3 | 34 | 5.7 | 5.2 | 5.4 | 5 | 4.8 | 5 |
| 62 | 10 | 30 | 50 | 3 | 2 | 1 | 1 | 1 | 2 | 3.59 | 28.6 | 8.69 | 22.8 | 4.5 | 31.8 | 7.1 | 7.1 | 6.1 | 5.3 | 4.9 | 6.1 |
| 63 | 30 | 31 | 29 | 3 | 2 | 1 | 1 | 1 | 2 | 3.13 | 24.1 | 8.89 | 22.5 | 3.6 | 37.8 | 6.5 | 6 | 6.2 | 6.3 | 6.1 | 6.5 |
| 64 | 31 | 29 | 30 | 3 | 2 | 1 | 1 | 1 | 2 | 3.1 | 29 | 13.5 | 16.4 | 4.4 | 33.5 | 5.2 | 3.9 | 3 | 4.9 | 4 | 4.5 |
| 65 | 10 | 70 | 10 | 3 | 2 | 1 | 1 | 1 | 2 | 3.09 | 32.7 | 12.1 | 19.2 | 4.7 | 28.2 | 6.1 | 6 | 6 | 6.2 | 6.1 | 5.9 |
| 66 | 30 | 31 | 29 | 3 | 2 | 1 | 1 | 1 | 2 | 3.24 | 23 | 8.88 | 16.6 | 3.9 | 44.4 | 6 | 5 | 5 | 5 | 5.1 | 5 |
| 67 | 10 | 10 | 70 | 3 | 2 | 1 | 1 | 1 | 2 | 3.05 | 23.4 | 8.48 | 25.1 | 4.1 | 35.9 | 7 | 6.8 | 6.8 | 5.8 | 5 | 6.2 |
| 68 | 31 | 30 | 29 | 3 | 2 | 1 | 1 | 1 | 2 | 3.38 | 27.8 | 10.7 | 26.1 | 3.9 | 37.1 | 6 | 6.5 | 6.5 | 5.2 | 5.2 | 6.1 |
| 69 | 30 | 30 | 30 | 3 | 2 | 1 | 1 | 1 | 2 | 3.29 | 25 | 10.7 | 21.6 | 4.1 | 35.3 | 5.5 | 5.5 | 5 | 5 | 5.5 | 5.04 |
Table 1: The design matrix for the formulation of the value-added custard and the results of proximate analysis and sensory evalu
( ) 1 % , Millet x = ( ) 2 % , Soybean x = ( ) 3 % , Tigernut x = ( ) % Ash C y onte c nt a = ; ( ) % y P p ro r t e e ud c in C = ( ) % Moisture y Cont c ent m = ; ( ) % Fat C y ont at ent f = ; ( ) % y e F C i u b r d f re c = ; ( ), % y Carbohydrate cho = , Ta yta ste = , Fl y fl avor = , Swe y et sw est = , Co ycl lor = , Tex ytx ture = . Overall Ac y cepta l o bi a ity = Table 1: The design matrix for the formulation of the value-added custard and the results of proximate analysis and sensory evaluations of the formulated custard.
Empirical Modeling of Proximate Compositions of Formulated Value-Added Custard
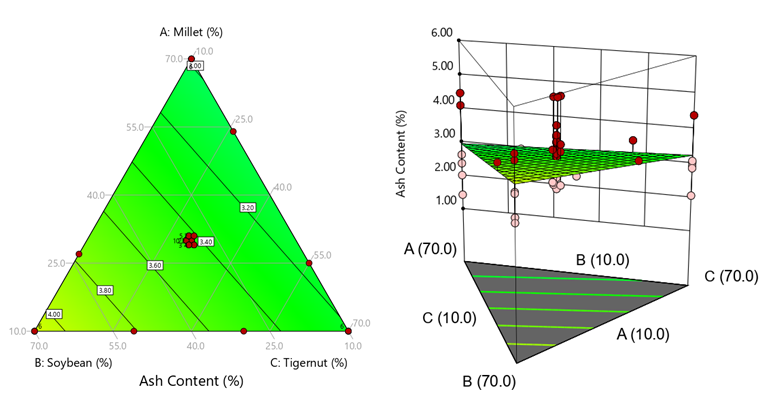
Empirical models in terms of L-pseudo components were fitted to the proximate and physicochemical properties of the formulated composite gari. The ash content fitted model in terms of L_Pseudo Components is presented in equation (5).
} ( ) 5 4 1 2 3 2.98 .09 3.21 y x x x ac + = +
This model can be used to peruse the design space and to make predictions about ash content for given levels of each factor. The contours and 3-D plots for the ash content are summarized in Figure 1.
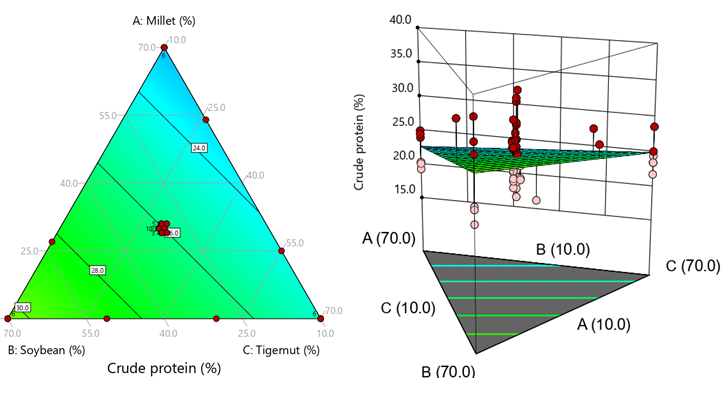
The crude protein fitted model in terms of L_Pseudo Components is presented in equation (6). The model can be used to navigate the design space and to make predictions about crude protein for given levels of each factor.
} ( ) 6 3 1 2 3 22.8 0.4 24.8 y x x x cp + + =
The contours and 3-D plots for the crude protein are summarized in Figure 2.
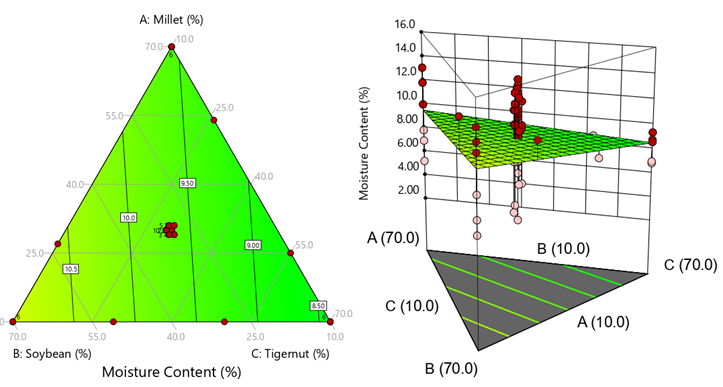
The moisture content fitted model in terms of L_Pseudo Components is presented in equation (7):
} ( ) 7 1 1 2 3 9.56 1.0 8.41 y x x x mc + + =
This model can still be used to navigate the design space and to make predictions about the moisture content for given levels of each factor. The contours and 3-D plots for the moisture content are summarized in Figure 3.
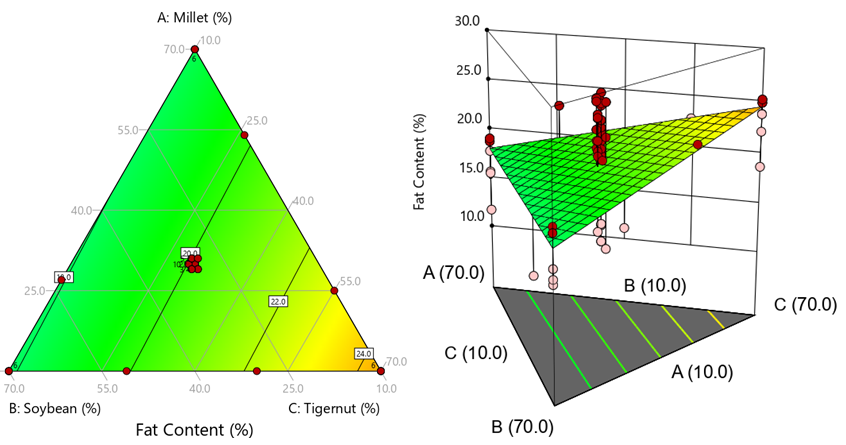
The fat content fitted model in terms of L_Pseudo Components is presented in equation (8) } ( ) 8 1 1 2 3 18.1 7.9 24.4 y x x x fat + + = This model can be used to navigate the design space and to make predictions about fat content for given levels of each factor. The contours and 3-D plots for the fat content are summarized in Figure 4.
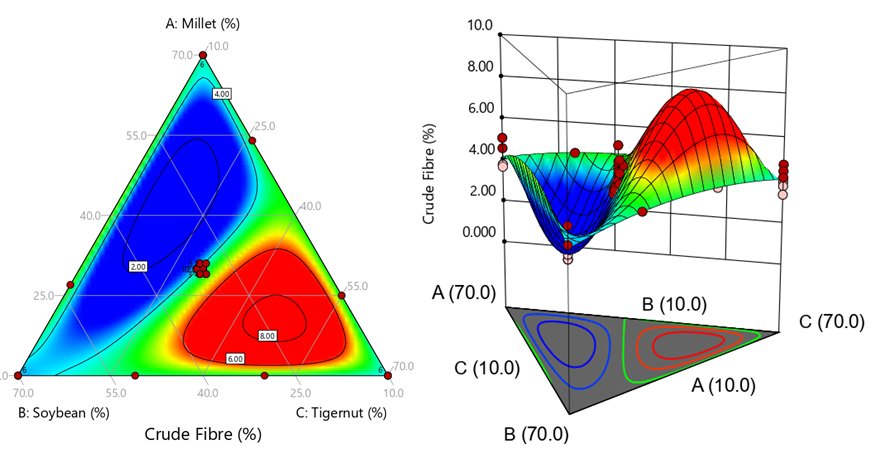
The crude fibre fitted model in terms of L_Pseudo Components is presented in equation (9):
4.13 3.74 4.01 35.93 2.78 2.61
1 2 3 y x x x x x x x c
+ + − + + =
f
4 5 1 4 ( )
The crude fibre model can still be used to navigate the design space and to make predictions about crude fibre for given levels of each factor. The contours and 3-D plots for the crude fibre are summarized in Figure 5.
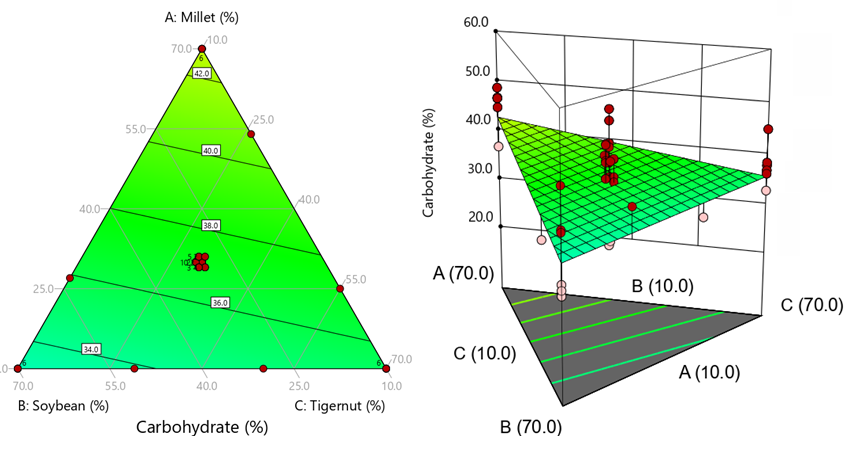
The carbohydrate fitted model in terms of L_Pseudo Components is presented in equation (10):
} ( ) 10 3 1 2 3 42.8 3.2 35.4 y x x x cho + + =
This model can be used to navigate the design space and to make predictions about carbohydrate for given levels of each factor. The contours and 3-D plots for the carbohydrate are summarized in Figure 6.
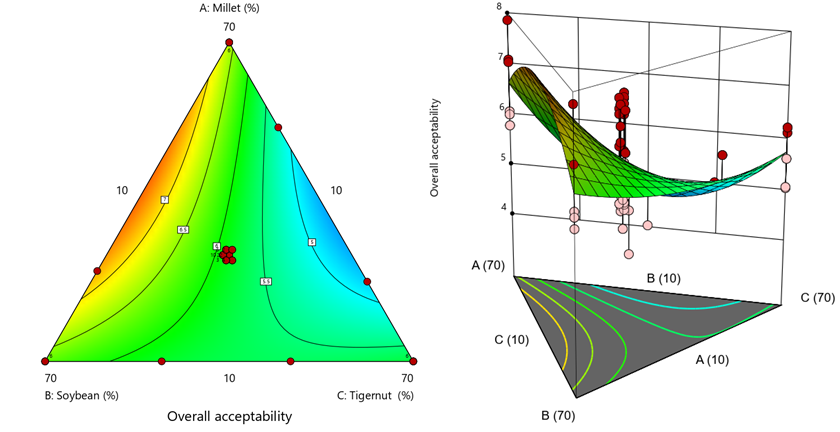
The overall acceptability fitted model in terms of L_ Pseudo Components is presented in equation (10):
} ( ) 1 2 1 3 2 3 6.64 6.31 5.73 4.01 5.99 1 1. 1 42 1 2 3 y x x x o x x x x x x a = + + + − − The overall acceptability model can still be used to navigate the design space and to make predictions about crude fiber for given levels of each factor. The contours and 3-D plots for the overall acceptability are summarized in Figure 7.
Generation of Optimal Formulation
A Numerical optimization approach, exploiting the desirability function technique, was utilized to generate the optimal formulation with the anticipated responses. Table 2 presents the summary of the optimization constraints employed in the optimization module. The four desirability solutions that were found were as presented in Table 3. The numerical solution desirability contour plot and 3-D Surface were presented in Figure 2. The numerical solution, presented in the form of optimal instant cereal meals bar graph and the graphical optimization overlay contour plot, showing the optimized formulation compositions with the respective quality parameters, are summarized in Figure 3.
| Name | Goal | Lower Limit | Upper Limit | Lower Weight | Upper Weight | Importance |
|---|---|---|---|---|---|---|
| Millet | is in range | 10 | 60 | 1 | 1 | 3 |
| Soybean | maximize | 25 | 70 | 1 | 5 | 5 |
| Tigernut | maximize | 10 | 70 | 1 | 5 | 5 |
| Ash Content | is in range | 1.43 | 5.19 | 1 | 1 | 3 |
| Crude protein | target = 30.0 | 19.4 | 37.3 | 5 | 10 | 5 |
| Moisture Content | targets = 8.00 | 3.1 | 14.3 | 1 | 1 | 3 |
| Fat Content | is in range | 11.7 | 26.9 | 1 | 1 | 3 |
| Crude Fibre | is in range | 3.3 | 6.1 | 1 | 1 | 3 |
| Carbohydrate | minimize | 24.6 | 51 | 1 | 1 | 3 |
| Taste | is in range | 4.8 | 8 | 1 | 1 | 3 |
| Flavor | is in range | 3.9 | 7.8 | 1 | 1 | 3 |
| Sweetness | is in range | 3 | 8.1 | 1 | 1 | 3 |
| Colour | is in range | 4 | 8.2 | 1 | 1 | 3 |
| Texture | is in range | 3.5 | 7.8 | 1 | 1 | 3 |
| Overall Acceptability | is in range | 4.05 | 7.86 | 1 | 1 | 3 |
Table 2: Optimization constraints/settings for formulated value-added custard.
( ) % mc Moisture y Content = , ( ) % pc Protein y Content = , ( ) % fat Fat Content y = ( ) % ac Ash Content y = , ( ) % cho Carbo y hydrate = , ( ) % fc Fibre Co y ntent = , ta Taste y = flav y Flavour = , sw Sweetness y = , cl Colour y = , tx Texture y = , oa Overall Acceptability y =
| No | Y ac | Y pc | Y mc | Y fat | Y fc | Y cho | Y ta | Y flav | Y sw | Y cl | Y tx | Y oa | Desirability |
|---|---|---|---|---|---|---|---|---|---|---|---|---|---|
| 1 | 3.78 | 29 | 10.1 | 20.1 | 4.43 | 33.9 | 6.46 | 6.93 | 5.91 | 6.15 | 4.59 | 5.79 | 0.535 Selected |
| 2 | 3.59 | 27 | 10.3 | 18.2 | 3.3 | 37.2 | 7.53 | 6.78 | 7.44 | 6.36 | 6.68 | 7.2 | 0.311 |
| 3 | 3.66 | 27.4 | 10.4 | 18 | 5 | 36.9 | 7.67 | 6.87 | 7.64 | 6.4 | 6.88 | 7.39 | 0.000191 |
| 4 | 3.6 | 27 | 10.4 | 18 | 5.06 | 37.4 | 7.73 | 6.88 | 7.69 | 6.39 | 6.94 | 7.44 | 0.000156 |
Table 3: The desirability solutions found.
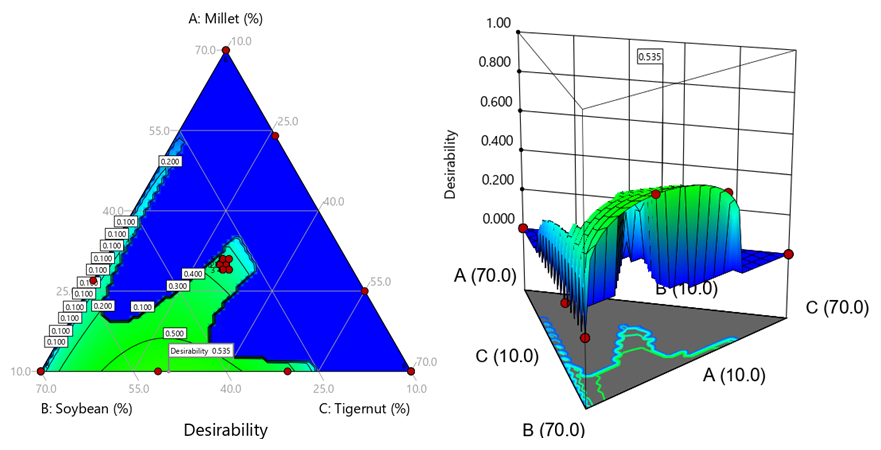
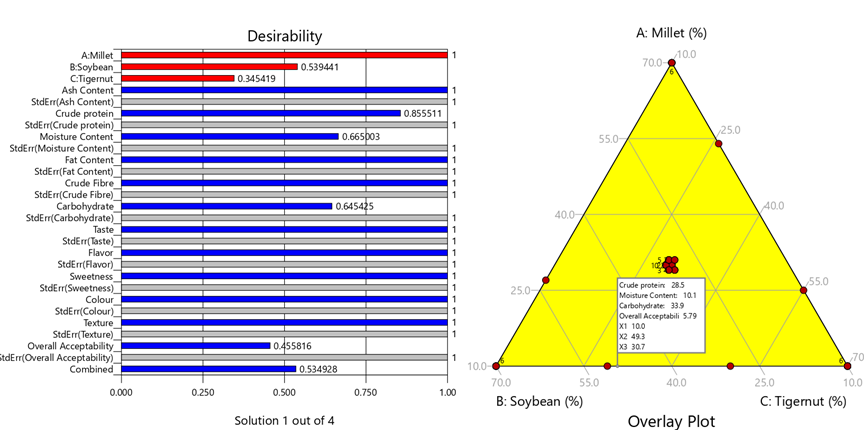
The result of the optimization gave optimized formulated value-added custard with overall desirability index of 0.535, based on the set optimization goals and individual quality desirability indices. The optimal formulated value-added custard was gotten from 10.0 % millet flour, 49.3 % soybean meal, 30.7 % tigernut. The quality properties of this optimal custard are: 3.78 % ash content, 28.5 % crude protein, 10.1 % moisture content, 20.1 % fat content, 4.43 % crude fibre, 33.9 % carbohydrate, and 5.79 overall acceptability. The box in the overlay contour plot (i.e., Figure 4) indicates the properties of the optimal custard and the component proportions to obtain it.
Conclusion
It can be concluded that the nutritional qualities of custard can be improved through grain-to-grain composite formulations. The optimal formulated value-added custard was found to be of high quality. This research has shown that locally available food grains can be blended to produce custard with high nutritional value. However, this study encouraged that further study be carried out on formulation of custard using other blends.
References
-
Perdon AA, Schonauer SL, Poutanen KS (2020) Breakfast Cereals and How They Are Made-Raw Materials, Processing, and Production. In: Perdon A, et al. (Eds.), Cereals & Grains Association. 3rd(Edn.), Woodhead Publishing and AACC International Press, Cambridge, UK, pp: 6-11.
-
Okafor GI, Usman GO (2014) Production and evaluation of breakfast cereals from blends of african yam bean (sphenostylis stenocarpa), maize (zea mays) and defatted coconut (cocus nucifera). Journal of Food Processing and Preservation 38(13): 1037-1043.
-
Olugbenga OA, Patience MO, Oluwatobi IF, Grace FO (2015) Optimization of the extrusion process for the production of ready-to-eat snack from rice, cassava and kersting’s groundnut composite flours. LWT - Food Science and Technology 64(1): 18-24.
-
Okoye JI, Nkwocha AC, Agbo AO (2008) Nutrient composition and acceptability of soy-fortified custard. Continental J Food Science and Technology 2: 37-44.
-
CR (2016) Breakfast Cereals Market by Product Type (Hot Cereals, Ready to Eat) e Growth, Future Prospects, Competitive Analysis and Forecast to 2016-2023. Breakfast Cereals Market, credence research, London, UK.
-
GVR (2018) Breakfast Cereals Market Size, Share & Trends Analysis Report by Product (RTE, Hot Cereal), by Distribution Channel (Supermarket, E-Commerce, Convenience Store), by Region, Vendor Landscape, and Segment Forecasts, 2018e2025. Grand View Research, USA.
-
MI (2017) Breakfast Cereals Market e Growth, Trends and Forecasts (2018e2023). Mordor Intelligence, India.
-
Statista (2018) Average Purchase per Person per Week of Breakfast Cereals in the United Kingdom (UK) from 2006 to 2016/2017 (in Grams). Food & Nutrition, Hamburg, Germany.
-
AOAC (2002) Official Methods of Analysis. 30th(Edn.), Association of Analytical Chemists, Washington.
-
Smith WF (2005) Experimental Design for Formulation. American Statistical Association and the Society for Industrial and Applied Mathematics, Alexandria, USA, pp: 281-290
-
Relia Soft (2015) Experiment Design and Analysis Reference. ReliaSoft Corporation. USA, pp: 205-209.
-
Myers RH, Montgomery DC, Anderson-Cook CM (2016) Response surface methodology-process and product optimization using designed experiments. Wiley Series in Probability and Statistics, John Wiley & Sons, Hoboken, New Jersey, Pages 341-343.
-
Selvamuthu D, Das D (2018) Introduction to Statistical Methods - Design of Experiments and Statistical Quality Control. Springer Nature Singapore, pp: 344-346.
- The Role of Podocyte Apoptosis and the Involvement of SIRT1 in Diabetic Nephropathy
- Dealcoholization of Beer by Osmotic Distillation for the Beverage Industry
- Biopolymer-Based Edible Packaging- Biomaterials, Methods, and Applications in Food Industry: An Updated Review
- Influence of Bioprocessing Methods on 'China Rice' (Gawal R1), and Soyabean Supplementation on the Quality of Complementary Food
- Cassava (Manihot esculenta) Varietal Growth, Yield and Cyanide Content Performance in Three Sites in the South- Eastern Semi Arid Regions of Kenya
- Food Waste Treatment, Recycling, Management and Production of Value-Products-An Update on Methodologies and Current Trends