Mathematical Modelling of the Drying Characteristics of Indian Spinach Using Machine Learning Approach
This study employs machine learning techniques to investigate the drying characteristics of Indian spinach leaves. Drying experiments were conducted at varying air temperatures (50°C, 60°C, 70°C) and velocities (1.2m/s and 1.4m/s) while monitoring drying time, moisture content, and important parameters. Artificial neural networks and support vector machine were used to predict drying rate and final moisture content based on conditions. Higher temperatures and air velocities lead to shorter drying times and lower moisture contents, with higher air velocities enhancing moisture diffusion and reducing energy intensity. Nine drying models were fitted, with the Page and Hii, et al. models showing strong performance. The Multi- Layer Perceptron (MLP) 3-8-1 configuration achieves high accuracy, and Support Vector Machine (SVM) models with the Radial Basis Function (RBF) kernel perform well in predicting moisture ratio. These findings offer insights into Indian spinach drying behavior and highlight the effectiveness of machine learning models. The obtained values aid in optimizing drying conditions, and the robust performance of MLP and SVM models holds potential for applications beyond drying, including diabetic retinopathy diagnosis.
Introduction
India spinach, scientifically known as Basella alba L., is a nutrient-rich leafy vegetable indigenous to India. Alongside varieties like Malabar spinach (Basella rubra L.) and Ceylon spinach (Basella cordifolia L.), it belongs to the Basellaceae family [1]. Renowned for its high vitamin content, including A, C, and K, as well as minerals like iron and calcium, India spinach is a versatile crop adaptable to various climates. It can be grown from seeds or cuttings, with a harvest period of approximately six weeks. Notably, it contains mild okra-like sap that prompts some to cook the leaves [2]. Malabar spinach, another member of the Basella species, offers significant health benefits. Its leaves are rich in vitamins A and C, calcium, potassium, and iron, surpassing regular spinach in vitamin C content and even outpacing kale in vitamin A content. The plant’s shoots are known for their febrifuge, diuretic, and laxative effects, while its roots are used to treat diarrhea. Poultices made from Malabar spinach leaves serve as applications for boils and sores. Its protein, amino acids, minerals, vitamins, and flavones make it a vital dietary and therapeutic resource [3]. Food preservation is vital for spoilage prevention and nutritional retention. Preservation methods like canning, freezing, salting, and food irradiation have emerged to combat spoilage caused by chemical and microbial agents. Thermal dehydration, an ancient method, is cost-effective and widely used. Although it can compromise quality slightly, the goal is to extend shelf life economically [4]. Drying is a cost-efficient approach to extend the shelf life of various food items. Moisture reduction is necessary to control microbial growth, measured by water activity. Drying methods, dryers, and pre- and post-processing interventions play vital roles in achieving optimal dried product quality. Techniques like osmotic dehydration and blanching enhance quality, while post-processing activities like coating and blending maintain final product quality [4]. Machine learning has revolutionized various sectors, including agriculture and food preservation. Machine learning algorithms optimize drying processes by analyzing variables like temperature, humidity, and airflow to enhance speed and product quality. Accurate prediction of drying characteristics is crucial for quality optimization, especially for India spinach, which exhibits unique drying behavior determinants [1]. Traditional mathematical modeling oversimplifies complex interactions in drying kinetics. Machine learning, using extensive datasets of drying conditions and spinach properties, offers a robust model for precise drying behavior prediction [3]. However, machine learning in drying processes, particularly for India spinach, remains underexplored due to scarce datasets and specific drying characteristics. A model merging machine learning techniques with domain expertise is needed to gain insights into Indian spinach’s drying behavior, revolutionizing drying protocols [5]. Innovative drying technologies combining techniques with physical fields like microwaves and ultrasonics are reshaping fruit and vegetable preservation, addressing challenges of energy consumption and nutrient loss. Microwave-assisted drying, known for faster drying and versatile product generation, stands out among these techniques [6]. AI’s role in the food industry has expanded, aiding sorting, parameter prediction, quality control, and safety through techniques like expert systems, artificial neural networks (ANN), adaptive neuro-fuzzy inference systems (ANFIS), and machine learning (ML). These tools enhance classification, sorting, and quality standard. The objective of this study is to model the drying characteristics of Indian spinach using machine learning approach.
Materials and Methods
Sample Preparation and Materials used
Fresh Indian spinach leaves were procured from Shasha market in Akure, Southwestern region of Nigeria before the experiment. The healthy leaves were selected and washed with tap water and the surface moisture on the sample surface was gently removed with blotting paper. The materials and equipment that were used for the study include: Indian Spinach leaves, drying system (mechanical dyer), knife, Tray, Small bowl, Stopwatch, Salt, Beakers, measuring cylinder, weighing balance, Distilled water, Sample holder, Blotting paper and Hand towel.
Drying Experiment Procedure
The experiment was carried out with the mechanical dryer in Processing and Storage Laboratory of the department of Agricultural and Environmental Engineering, Federal University of Technology Akure, Nigeria. The initial moisture contents of the leave sample of Indian Spinach were determined using the standard oven drying method. The dryer was allowed to reach steady-state conditions. The drying experiments were carried out at 50, 60, and 70 drying air temperatures 1.2 m/s and 1.4 m/s. The leaves were uniformly spread on the stainless steel trays of the dryer and the variation in the weight of the sample were monitored at 30 minutes intervals until final moisture content were attained. During the experiment, important parameters affecting the dryer performance such as air temperature, relative humidity, pressure, moisture content, and air velocity, ambient temperature and the inlet and outlet temperatures of drying air in the dryer chamber were measured and recorded. The dried sample was packed in an air tight container for further experiment or analysis. Determination of Drying Parameters Determination of Moisture Content: The moisture content of the sample during drying was determined using equation 1 for wet.
100 w d w w W W M W − = × (1)
Where d M is the moisture content of the sample on dry basis (%), w M is the moisture content of the sample on wet basis (%), while w W is the weight of wet sample (g) and d W is the weight of dry sample (g) Determination Moisture Ratio: Drying ratio was the ratio of the final weight of dried samples to its initial weight. It was dimensionless.
Determination of Drying Rate: The determination of the drying rate was carried out by measuring the weight change during the drying process. During drying, there is loss of moisture with time hence the drying rate indicates the rate of loss of this moisture.
The drying rate was calculated as follows:
o F M M dM dt t − = (2)
1 Where Mo is the initial moisture content, MF is the final moisture content, % d.b and t1 is the time.
Determination of Effective Moisture Diffusivity: Effective moisture diffusivity, Deff is defined to describe the rate of moisture movement, no matter which mechanism is involved. A complete drying profile consists of the first stage of drying, a constant-rate period, and a falling rate period. The unsteady state diffusion of moisture by Fick’s second law was used to determine it;
2 eff M D M t ∂ = ∇ ∂
(3) Calculation of Deff using the Fick’s second law is a tool for describing the drying process and possible mechanisms for the transfer of moisture within food products.
Where M is the moisture content (kg water/kg dry matter), t is the drying time and, Deff is the effective diffusivity (m2/s).
Determination of activation energy: The Activation Energy was calculated by using an Arrhenius type equation (Lopez et al., 2000):
exp o Ea D D RTa = −
(4) Where Ea is the energy of activation (kJ/mol), R is universal gas constant (8.3143 kJ/mol), Ta is absolute air temperature (K), and Do is the pre-exponential factor of the Arrhenius equation (m2/s)
Machine Language Approach
To estimate the drying rate and final moisture content of the spinach based on the drying circumstances, ANN (artificial neural network) and SVM (support vector machine) machine learning approaches were created using MATLAB 2020b. The model was trained, validated, and tested using, respectively, 70%, 15%, and 15%. To find the model’s ideal hyper parameter, trial and error methods were employed. To confirm that the model can accurately predict the drying properties of Indian spinach, the coefficient of determination, mean squared error, and mean absolute error were used to measure the model’s accuracy.
Modeling of the Drying Process
For fitting the drying characteristics of Indian spinach, some models was used to estimate the parameters associated with each model. The best fitted model was determined by the highest coefficient of determination (R2) and the lowest values of the root mean square error (RMSE) and chi-square (χ2) amongst the predicted and experimental results. Then these data were fitted to the selected models including the Page model, Midilli, et al. model, Logistic model, Two-term model, and Logarithmic model (Table 1). The results of nonlinear regression analyses and statistical analyses of the different models including the constants of the models and the comparison criteria will be used to evaluate goodness of fit namely, R2, χ2, RMSE and SSE.
| Models | Equation | References |
|---|---|---|
| Midilli, et al. | MR = a exp(-ktn) + bt | Midilli A and Kucuk H [7] |
| Page | MR = exp(-ktn) | Kaleemullah S and Kailappan R [8] |
| Wang and Singh | MR = 1 + bt + at2 | Wang CY and Singh RP [9] |
| Logarithmic | MR = a exp(-kt) + c | Onwude, et al. [10] |
| Henderson and Pabis | MR = a.exp(-kt) | Kashaninejad, et al. [11] |
| Peleg | MR= 1−𝑡(𝑎+𝑏𝑡) | Da Silva, et al. [12,13] |
| Hii, et al. | 𝑀𝑅= 𝑎℮−𝑘𝑡𝑛+𝑐𝐸𝑥𝑝(−𝑔𝑡𝑛) | Hii, et al. [14] |
| Diffusion approach | 𝑀𝑅= 𝑎Exp (−𝑘𝑡) +(1−𝑎)𝐸𝑥𝑝(−𝑔𝑡) | Wang, et al. (2007) |
| Verma, et al. | 𝑀𝑅= 𝑎Exp (−𝑘𝑡) +(1+𝑎)𝐸𝑥𝑝(−𝑔𝑡) | Yaldiz O and Ertekin C [15] |
Table 1: Thin layer model equations.
Results and Discussions
Effect of Temperature on Drying Behaviour
The drying behavior of Indian spinach at various temperatures (70°C, 60°C, and 50°C) with an airflow velocity of 1.2 m/s was analyzed in Figure 1. The impact of temperature on drying time and moisture content was assessed. At 70°C, the drying process began with a high initial moisture content of 93.27%, and as time progressed, drying time increased while moisture content steadily decreased to 27.15% in 147.65 minutes. Beyond this point, drying time stabilized, and moisture content continued to decrease.
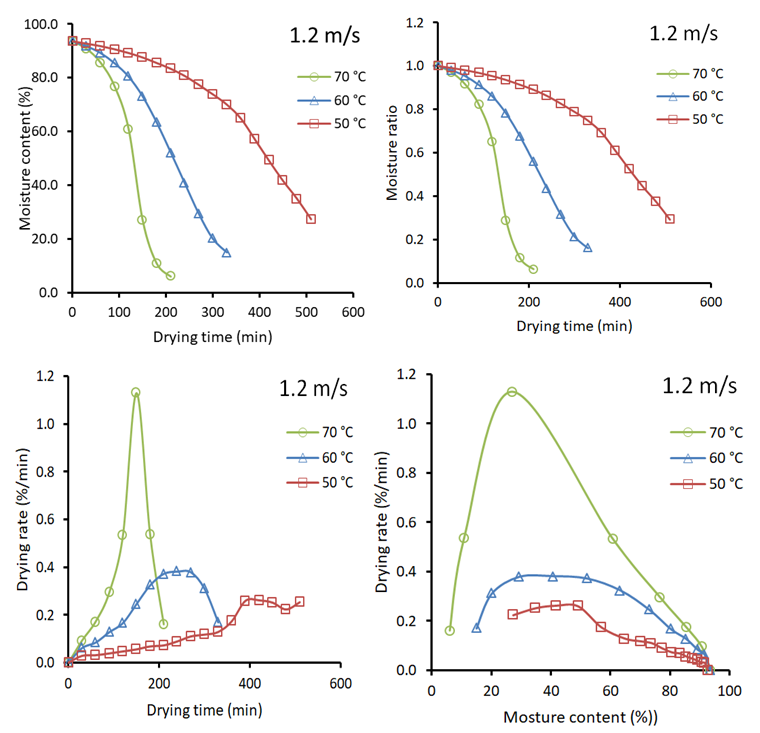
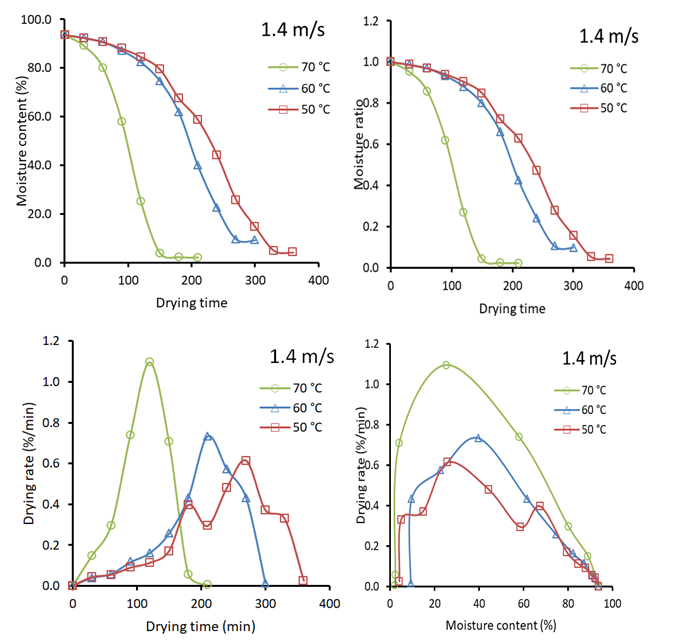
Comparing the temperatures, higher values led to shorter drying times and lower moisture contents. At 60°C, both drying time and moisture content decreased compared to 70°C. Similarly, at 50°C, drying time decreased further, and moisture content reached its lowest point, implying that higher temperatures expedited moisture removal. Drying rates, representing moisture removal speed, mirrored this trend at all temperatures. The rates decreased as moisture content reduced. This observation aligned with prior research by Premi, et al. [16], Jun-Wen, et al. [17], and Rodríguez, et al. [18], confirming the influence of higher temperatures on shorter drying times and reduced moisture content. Figure 2 demonstrated the drying behavior at temperatures of 70°C, 60°C, and 50°C, with a constant air velocity of 1.4 m/s. A consistent decline in moisture content was observed as temperature decreased, highlighting the efficacy of higher temperatures in accelerating moisture removal. This phenomenon resulted from enhanced kinetic energy of water molecules, elevating evaporation rates. Additionally, drying time decreased with higher temperatures due to increased heat transfer rates, promoting faster moisture evaporation. The moisture ratio, reflecting moisture content relative to the initial amount, decreased over time at each temperature, with higher temperatures leading to swifter reduction. This trend echoed the drying time results. Drying rates increased with higher temperatures due to greater temperature differentials between spinach and air, improving moisture transfer efficiency. This finding aligned with Jun-Wen, et al. [17]. Although drying rates initially rose, they eventually declined due to decreasing moisture content, reducing the driving force for moisture transfer. This study’s outcomes were consistent with research by Ningning, et al. [19], Krokida, et al. [20], and Clemente, et al. [21], reinforcing the correlation between higher temperatures and reduced moisture content, shorter drying times, increased drying rates, and accelerated moisture removal.
Effect of Air Velocity on Drying Behaviour
The data in Figure 3 demonstrates the drying behavior of Indian spinach under different air velocities (1.4 m/s and 1.2 m/s). As drying time increases, moisture ratio decreases for both velocities, indicating moisture loss. Higher air velocity results in lower moisture ratio, indicating faster moisture evaporation and more efficient drying. Drying time is shorter at 1.4 m/s due to enhanced heat and mass transfer, accelerating moisture removal. Drying rate initially increases, then decreases as moisture content reduces. Higher air velocity leads to higher drying rate due to better heat and mass transfer. Moisture content decreases as drying time increases for both velocities. Higher air velocity leads to lower moisture content, reflecting more effective moisture evaporation.
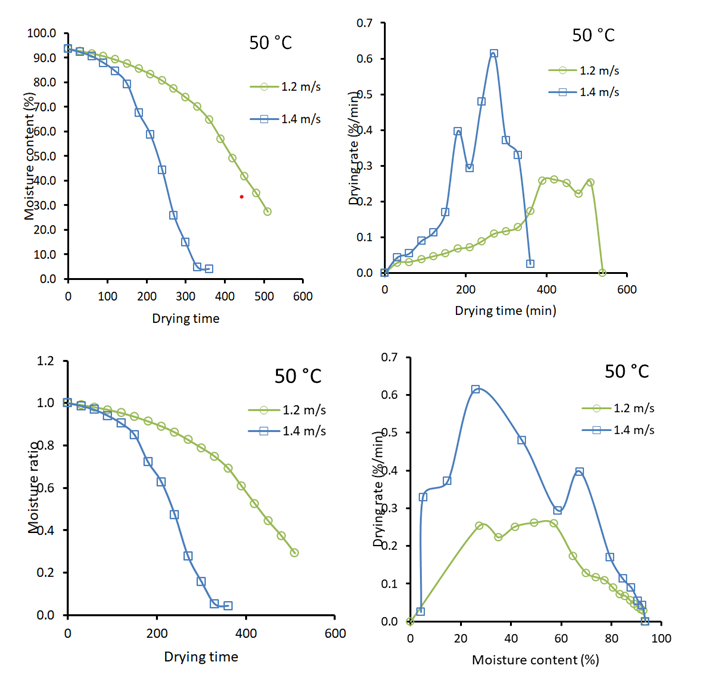
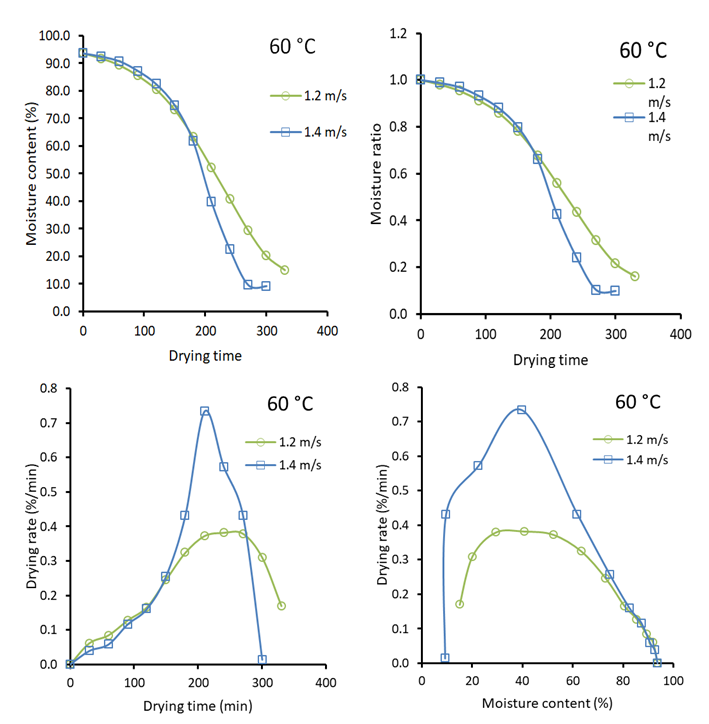
Figure 4 explores air velocity’s impact on Indian spinach drying at a constant 60°C. Higher air velocity (1.4 m/s) facilitates greater moisture removal, evidenced by faster moisture content reduction. Drying time is shorter with increased air velocity, indicating accelerated drying. Moisture ratio steadily decreases at both velocities, with higher air velocity causing more rapid decrease due to enhanced evaporation. Drying rate rises over time, consistently higher at 1.4 m/s, indicating faster moisture evaporation. This aligns with a study by Luna et al. [22], indicating higher air velocity leads to quicker moisture removal with increased temperature.
Mathematical Modelling
The drying modeling of Indian spinach was investigated at various air velocities (1.2 m/s) and temperatures (70°C, 60°C, 50°C) using different models. Among them, the Page model demonstrated excellent performance with high R² values (0.9885 to 0.9987), indicating strong fit across temperatures. RMSE values (0.0119 to 0.0353) supported its accuracy, and low chi-square values affirmed the goodness of fit. The Hii, et al. model also showed impressive results (R²: 0.9875 to 0.9990) with low RMSE and chi-square values. Midili, et al. model had a reasonable fit (R²: 0.9538 to 0.9886) with moderate RMSE and satisfactory chi-square values. The Lewis, Verma, et al. and Diffusion models had moderate fits (R²: 0.8091 to 0.9358) with higher RMSE, suggesting room for improvement. Logarithmic, Henderson & Pabis, and Wang and Singh models also showed moderate fits (R²: 0.8240 to 0.9570), indicating reasonable average deviations, but chi-square values indicated room for enhancement. The Peleg model had high R² values (0.9461 to 0.9928) with low RMSE and chi-square values, indicating a good fit. Table 3 presented drying modeling results at different temperatures (1.4 m/s). At 70°C, the Page model excelled (R²: 0.9982, RMSE: 0.0198, Χ²: 0.0005). Similarly, at 60°C, the Page model performed well (R²: 0.9924, RMSE: 0.0367, Χ²: 0.0016). At 50°C, the Midili, et al. model was the top performer (R²: 0.9810, RMSE: 0.0536, Χ²: 0.0041). These models provide insights for optimizing Indian spinach drying under specific temperature conditions.
| Air velocity | Temperature | Model | Constant | R² | RMSE | Χ² |
|---|---|---|---|---|---|---|
| 1.2 m/s | 70 °C | Lewis | k=0.006 | 0.833 | 0.1806 | 0.0373 |
| Page | k=1.02E-07, n=3.2203 | 0.9917 | 0.0353 | 0.0017 | ||
| Midili, et al. | a=0.9891, k=-0.0615, n=0.4788, b=-0.0104 | 0.9651 | 0.0682 | 0.0093 | ||
| Hii, et al. | a=0.5, k=1.14E-07, n=3.2078, c=0.5, g=1.14E-07 | 0.9916 | 0.0336 | 0.003 | ||
| Verma, et al. | a=0.0831, k=0.0072, g=-0.0072 | 0.8091 | 0.1632 | 0.0426 | ||
| Diffusion | a=-86.8508, k=0.0181, g=-0.0178 | 0.9358 | 0.0962 | 0.0148 | ||
| Wang and Singh | a=-0.0011, b=-1.85E-05 | 0.957 | 0.0764 | 0.0078 | ||
| Henderson & Pabis | a=1.1662, k=0.0072 | 0.8091 | 0.1632 | 0.0355 | ||
| Logarithmic | a=125.3997, k=4.09E-05, C=-124.26 | 0.9248 | 0.1001 | 0.016 | ||
| Peleg | a=397.5017, b=-0.9129 | 0.9461 | 0.09 | 0.0108 | ||
| 60 °C | Lewis | k=0.0031 | 0.8894 | 0.1279 | 0.0178 | |
| Page | k=8.96E-07, n=2.5085 | 0.9987 | 0.0119 | 0.0002 | ||
| Midili, et al. | a=0.9808, k=-0.0367, n=0.5065, b=-0.0055 | 0.9886 | 0.0316 | 0.0015 | ||
| Hii, et al. | a=0.4958, k=7.48E-07, n=2.5379, c=0.4936, g=7.32E-07 | 0.999 | 0.0105 | 0.0002 | ||
| Verma, et al. | a=0.075, k=0.0038, g=-0.0038 | 0.8693 | 0.1087 | 0.0158 | ||
| Diffusion | a=-84.0404, k=0.0095, g=-0.0093 | 0.9709 | 0.0517 | 0.0036 | ||
| Wang and Singh | a=-0.0007, b=-6.21E-06 | 0.9894 | 0.031 | 0.0012 | ||
| Henderson & Pabis | a=1.15, k=0.0038 | 0.8693 | 0.1087 | 0.0142 | ||
| Logarithmic | a=107.9925, k=2.60E-05, C=-106.8771 | 0.9577 | 0.0608 | 0.0049 | ||
| Peleg | a=733.0774, b=-1.1132 | 0.982 | 0.0438 | 0.0023 | ||
| 50 °C | Lewis | k=0.0012 | 0.8438 | 0.1085 | 0.0125 | |
| Page | k=1.00E-07, n=2.595 | 0.9885 | 0.0242 | 0.0007 | ||
| Midili, et al. | a=0.9444, k=-0.0377, n=0.4586, b=-0.0028 | 0.9538 | 0.0474 | 0.0029 | ||
| Hii, et al. | a=0.4984, k=1.46E-07, n=2.531, c=0.4986, g=1.41E-07 | 0.9875 | 0.0262 | 0.0009 | ||
| Verma, et al. | a=0.0611, k=0.0016, g=-0.0016 | 0.826 | 0.0926 | 0.0103 | ||
| Diffusion | a=-61.1444, k=0.0045, g=-0.0044 | 0.9428 | 0.0533 | 0.0034 | ||
| Wang and Singh | a=-0.0003, b=-2.45E-06 | 0.9875 | 0.0607 | 0.0041 | ||
| Henderson & Pabis | a=1.1221, k=0.0016 | 0.826 | 0.0926 | 0.0097 | ||
| Logarithmic | a=90.5617, k=1.49E-05, C=-89.4523 | 0.899 | 0.0701 | 0.0059 | ||
| Peleg | a=2256.81, b=-3.0804 | 0.9928 | 0.0206 | 0.0005 |
Table 2: Goodness of fit and constant parameter for the selected models for 1.2 m/s.
| Air velocity | Temperature | Model | Constant | R² | RMSE | Χ² |
|---|---|---|---|---|---|---|
| 1.4 m/s | 70 °C | Lewis | k=0.009 | 0.8784 | 0.1734 | 0.0343 |
| Page | k=1.74E-07, n=3.3075 | 0.9982 | 0.0198 | 0.0005 | ||
| Midili, et al. | a=0.9735, k=3.32E-08, n=3.6575, b=6.85E-05 | 0.9986 | 0.0152 | 0.0005 | ||
| Hii, et al. | a=0.4932, k=2.17E-07, n=3.2543, c=0.4908, g=2.19E-07 | 0.998 | 0.0185 | 0.0009 | ||
| Verma, et al. | a=0.0825, k=0.0104, g=-0.0104 | 0.8597 | 0.1578 | 0.0398 | ||
| Diffusion | a=-102.2737, k=0.0249, g=-0.0245 | 0.9625 | 0.083 | 0.011 | ||
| Wang and Singh | a=-0.0051, b=-6.65E-07 | 0.9267 | 0.115 | 0.0176 | ||
| Henderson & Pabis | a=1.165, k=0.0104 | 0.8597 | 0.1578 | 0.0332 | ||
| Logarithmic | a=3.8986, k=0.0017, C=-2.7979 | 0.931 | 0.1062 | 0.018 | ||
| Peleg | a=195.0655, b=-0.0178 | 0.9269 | 0.115 | 0.0176 | ||
| 60 °C | Lewis | k=0.0036 | 0.8195 | 0.1822 | 0.0365 | |
| Page | k=4.65E-08, n=3.1089 | 0.9913 | 0.039 | 0.0019 | ||
| Midili, et al. | a=0.9687, k=-0.0658, n=0.4421, b=-0.0071 | 0.9613 | 0.068 | 0.0073 | ||
| Hii, et al. | a=0.0087, k=6.5757, n=3.4364, c=0.9926, g=-8.59E-09 | 0.9941 | 0.0265 | 0.0013 | ||
| Verma, et al. | a=0.0942, k=0.0046, g=-0.0046 | 0.7912 | 0.1609 | 0.0356 | ||
| Diffusion | a=-100.889, k=0.0117, g=-0.0115 | 0.9261 | 0.0972 | 0.013 | ||
| Wang and Singh | a=-7.76E-06, b=-1.14E-05 | 0.9682 | 0.0618 | 0.0047 | ||
| Henderson & Pabis | a=1.1885, k=0.0046 | 0.7912 | 0.1609 | 0.0316 | ||
| Logarithmic | a=110.4495, k=3.15E-05, C=-109.2838 | 0.9088 | 0.1043 | 0.015 | ||
| Peleg | a=712.8187, b=-1.3858 | 0.9496 | 0.084 | 0.0086 | ||
| 50 °C | Lewis | k=0.0033 | 0.8361 | 0.183 | 0.0363 | |
| Page | k=1.02E-07, n=2.8994 | 0.9924 | 0.0367 | 0.0016 | ||
| Midili, et al. | a=1.0352, k=1.02E-06, n=2.4904, b=0.00E00 | 0.981 | 0.0536 | 0.0041 | ||
| Hii, et al. | a=0.4995, k=3.81E-08, n=3.0746, c=0.4999, g=3.69E-08 | 0.9952 | 0.0327 | 0.0017 | ||
| Verma, et al. | a=0.1001, k=0.0042, g=-0.0042 | 0.8063 | 0.1605 | 0.0335 | ||
| Diffusion | a=-103.7812, k=0.0103, g=-0.0101 | 0.9317 | 0.0973 | 0.0123 | ||
| Wang and Singh | a=-0.0003, b=-7.64E-06 | 0.9762 | 0.0553 | 0.0036 | ||
| Henderson & Pabis | a=1.2002, k=0.0042 | 0.8063 | 0.1605 | 0.0305 | ||
| Logarithmic | a=142.3656, k=2.16E-05, C=-141.1986 | 0.9291 | 0.0949 | 0.0117 | ||
| Peleg | a=764.637, b=-1.1894 | 0.9619 | 0.0762 | 0.0069 |
Table 3: Goodness of fit and constant parameter for the selected models for 1.4 m/s.
Effective Moisture Diffusivity and Activation Energy
Table 4 shows the drying of India spinach and examined its moisture diffusivity and activation energy. The effective moisture diffusivity (Deff) was measured at velocities of 1.2 m/s and 1.4 m/s, along with temperatures of 70°C, 60°C, and 50°C. Higher velocities led to increased Deff values, indicating faster moisture removal. Activation energy (Ea) was also studied, with values of 85.81 kJ/mol and 43.05 kJ/ mol at velocities of 1.2 m/s and 1.4 m/s, respectively. The decrease in Ea at higher velocities suggests less energy is required for drying. This is supported by the enhanced heat and mass transfer between spinach and air. These findings align with previous work by Fernando and Amarasinghe [23], while Thirupathihalli, et al. [24] reported a similar trend in mango drying, contrasting with Luna, et al. [22] on Piper umbellatum.
| Velocity | Temperature | a | b | D (x10-12 m2/s) eff | r | σ | Ea (kJ/mol) |
|---|---|---|---|---|---|---|---|
| 1.2 m/s | 70 | 0.5353 | -2.22E-04 | 22.45 | -0.9136 | 1.3242 | 85.81 |
| 60 | 0.3239 | -9.07E-05 | 9.19 | 0.9878 | 0.565 | ||
| 50 | 0.2061 | -3.45E-05 | 3.49 | 0.9942 | 0.444 | ||
| 1.4 m/s | 70 | 0.6945 | -3.61E-04 | 36.53 | -0.9416 | 2.2609 | 43.05 |
| 60 | 0.5072 | -1.35E-04 | 13.65 | 0.8504 | 1.6155 | ||
| 50 | 0.6592 | -1.40E-04 | 14.21 | 0.9728 | 3.3417 |
Table 4: Effective moisture diffusivity and activation energy. a and b are the intercept and slope of lnMR vs time, r is correlat
Machine Learning Modeling
Moisture Ratio: The fitness statistics for Moisture Ratio (MR) prediction were analyzed using Artificial Neural Network (ANN) and Support Vector Machine (SVM) models during the drying process of Indian spinach as show in Table 5 & 6. Among the ANN configurations, MLP 3-8-1 achieved high accuracy (R=0.9992, RMSE=0.0069) for testing. MLP 3-7-1 and MLP 3-4-1 also showed strong performance. SVM models, including Linear, Polynomial, RBF, and Sigmoid kernels, were evaluated. RBF kernel stood out with R=0.9846, RMSE=0.027, and MSE=0.0035 for overall stages. Polynomial kernel also performed well. Linear kernel had decent results, while Sigmoid kernel showed the weakest performance. Hyper parameters were provided for each kernel. The RBF kernel demonstrated the best correlation, accuracy, and lowest errors. Proper SVM model selection, particularly RBF, enhances MR prediction accuracy in Indian spinach drying [24, 25, 26, 27].
| Network | Training | Validation | Testing | Hidden activation | Output activation | ||||||
|---|---|---|---|---|---|---|---|---|---|---|---|
| R | RMSE | MSE | R | RMSE | MSE | R | RMSE | MSE | |||
| MLP 3-8-1 | 0.9992 | 0.0108 | 0.0001 | 0.9978 | 0.0209 | 0.0004 | 0.9992 | 0.0069 | 0 | Exponential | Exponential |
| MLP 3-8-1 | 0.9993 | 0.0093 | 0.0001 | 0.9966 | 0.0182 | 0.0003 | 0.9987 | 0.0077 | 0.0001 | Tanh | Logistic |
| MLP 3-7-1 | 0.9992 | 0.01 | 0.0001 | 0.9966 | 0.0183 | 0.0003 | 0.9988 | 0.0071 | 0 | Tanh | Logistic |
| MLP 3-4-1 | 0.9986 | 0.0135 | 0.0002 | 0.9952 | 0.0219 | 0.0005 | 0.9992 | 0.0059 | 0 | Tanh | Logistic |
| MLP 3-8-1 | 0.9978 | 0.0167 | 0.0003 | 0.9961 | 0.0211 | 0.0004 | 0.9975 | 0.0127 | 0.0002 | Exponential | Tanh |
| MLP 3-3-1 | 0.9984 | 0.014 | 0.0002 | 0.9945 | 0.0239 | 0.0006 | 0.9975 | 0.0099 | 0.0001 | Tanh | Exponential |
| MLP 3-8-1 | 0.9977 | 0.0174 | 0.0003 | 0.9934 | 0.0266 | 0.0007 | 0.9989 | 0.0079 | 0.0001 | Tanh | Logistic |
| MLP 3-4-1 | 0.9969 | 0.0198 | 0.0004 | 0.9971 | 0.017 | 0.0003 | 0.9947 | 0.0148 | 0.0002 | Exponential | Logistic |
| MLP 3-4-1 | 0.9969 | 0.0196 | 0.0004 | 0.9954 | 0.0248 | 0.0006 | 0.9964 | 0.0142 | 0.0002 | Tanh | Tanh |
| MLP 3-7-1 | 0.9972 | 0.0188 | 0.0004 | 0.9961 | 0.0198 | 0.0004 | 0.9932 | 0.0196 | 0.0004 | Exponential | Exponential |
| MLP 3-4-1 | 0.9962 | 0.0222 | 0.0005 | 0.9968 | 0.0187 | 0.0004 | 0.9917 | 0.0211 | 0.0004 | Exponential | Exponential |
| MLP 3-6-1 | 0.9955 | 0.024 | 0.0006 | 0.9928 | 0.0262 | 0.0007 | 0.995 | 0.0146 | 0.0002 | Tanh | Logistic |
| MLP 3-7-1 | 0.9951 | 0.0251 | 0.0006 | 0.9917 | 0.0288 | 0.0008 | 0.9969 | 0.014 | 0.0002 | Tanh | Tanh |
| MLP 3-3-1 | 0.9965 | 0.0216 | 0.0005 | 0.9892 | 0.0374 | 0.0014 | 0.9972 | 0.0103 | 0.0001 | Logistic | Tanh |
| MLP 3-8-1 | 0.9948 | 0.026 | 0.0007 | 0.9917 | 0.03 | 0.0009 | 0.9967 | 0.0163 | 0.0003 | Exponential | Tanh |
| MLP 3-6-1 | 0.9963 | 0.0225 | 0.0005 | 0.9901 | 0.0329 | 0.0011 | 0.9933 | 0.019 | 0.0004 | Exponential | Tanh |
| MLP 3-7-1 | 0.9907 | 0.0347 | 0.0012 | 0.9919 | 0.0279 | 0.0008 | 0.9902 | 0.0202 | 0.0004 | Logistic | Tanh |
| MLP 3-5-1 | 0.9948 | 0.026 | 0.0007 | 0.9914 | 0.032 | 0.001 | 0.9875 | 0.0222 | 0.0005 | Logistic | Exponential |
| MLP 3-5-1 | 0.9943 | 0.0267 | 0.0007 | 0.9907 | 0.0326 | 0.0011 | 0.983 | 0.0279 | 0.0008 | Logistic | Identity |
| MLP 3-5-1 | 0.9861 | 0.0415 | 0.0017 | 0.9911 | 0.0314 | 0.001 | 0.987 | 0.0306 | 0.0009 | Exponential | Logistic |
Table 5: The Fitness Statistics of ANN (MLP) model for MR prediction.
| Statistics | Linear | Polynomial | RBF | Sigmoid | |
|---|---|---|---|---|---|
| Training | R | 0.872 | 0.9776 | 0.9888 | 0.8415 |
| RMSE | 0.172 | 0.0821 | 0.0523 | 0.192 | |
| MSE | 0.0296 | 0.0067 | 0.0027 | 0.0369 | |
| Testing | R | 0.7384 | 0.9519 | 0.9499 | 0.5994 |
| RMSE | 0.1926 | 0.0913 | 0.0752 | 0.208 | |
| MSE | 0.0371 | 0.0083 | 0.0057 | 0.0433 | |
| Overall | R | 0.8502 | 0.9767 | 0.9846 | 0.8137 |
| RMSE | 0.1784 | 0.0846 | 0.0591 | 0.1962 | |
| MSE | 0.0318 | 0.0071 | 0.0035 | 0.0385 | |
| Hyperparameter | C=10.000, nu=0.100 | C=10.000, nu=0.400, degree=3.000, gamma=0.680, coefficient=0.000 | C=10.000, nu=0.300, gamma=2.870 | C=7.000, nu=0.400, gamma=0.221, coefficient=0.000 |
Table 6: The fitness statistics of SVM model for MR prediction.
Drying Rate: Table 7 shows the multi-Layer Perceptron (MLP) models for India spinach drying prediction, uncovering varying performance. The most effective MLP 3-5-1 model with Exponential hidden and Logistic output activation yielded R values of 0.9398 (validation) and 0.9873 (testing). Similarly, the MLP 3-5-1 with Logistic hidden and Exponential output achieved high scores (R = 0.9388 for validation, 0.9756 for testing). Respectable results were seen with the MLP 3-6-1 model (R = 0.9254 for validation, 0.9720 for testing) and the MLP 3-2-1 (R = 0.9187 for validation, 0.9913 for testing). These models sufficiently predicted drying rate behavior. Table 8 shows the Support Vector Machine (SVM) analysis which indicated the RBF kernel outperformed others. It showed the highest correlation (R = 0.8836) and lowest RMSE (0.1212) in overall predictive accuracy, surpassing Linear, Polynomial, and Sigmoid kernels across training and testing. Hyper parameters for each kernel configuration were also detailed [6].
| Network | Training | Validation | Testing | Hidden activation | Output activation | ||||||
|---|---|---|---|---|---|---|---|---|---|---|---|
| R | RMSE | MSE | R | RMSE | MSE | R | RMSE | MSE | |||
| MLP 3-5-1 | 0.6147 | 0.1501 | 0.0225 | 0.9398 | 0.0398 | 0.0016 | 0.9873 | 0.027 | 0.0007 | Logistic | Exponential |
| MLP 3-5-1 | 0.6267 | 0.1487 | 0.0221 | 0.9388 | 0.0389 | 0.0015 | 0.9756 | 0.028 | 0.0008 | Exponential | Logistic |
| MLP 3-5-1 | 0.6142 | 0.1502 | 0.0226 | 0.9218 | 0.0447 | 0.002 | 0.991 | 0.0204 | 0.0004 | Logistic | Exponential |
| MLP 3-6-1 | 0.6238 | 0.1489 | 0.0222 | 0.9254 | 0.0424 | 0.0018 | 0.972 | 0.0272 | 0.0007 | Exponential | Logistic |
| MLP 3-2-1 | 0.6128 | 0.1507 | 0.0227 | 0.9187 | 0.0463 | 0.0021 | 0.9913 | 0.0273 | 0.0007 | Tanh | Logistic |
| MLP 3-10-1 | 0.6098 | 0.1508 | 0.0227 | 0.9769 | 0.035 | 0.0012 | 0.9251 | 0.041 | 0.0017 | Tanh | Logistic |
| MLP 3-2-1 | 0.611 | 0.1518 | 0.023 | 0.9143 | 0.0526 | 0.0028 | 0.9911 | 0.0215 | 0.0005 | Logistic | Logistic |
| MLP 3-2-1 | 0.611 | 0.1518 | 0.023 | 0.9143 | 0.0526 | 0.0028 | 0.9911 | 0.0215 | 0.0005 | Logistic | Logistic |
| MLP 3-10-1 | 0.6188 | 0.1502 | 0.0226 | 0.9032 | 0.0471 | 0.0022 | 0.9643 | 0.0387 | 0.0015 | Exponential | Logistic |
| MLP 3-10-1 | 0.6188 | 0.1502 | 0.0226 | 0.9032 | 0.0471 | 0.0022 | 0.9643 | 0.0387 | 0.0015 | Exponential | Logistic |
| MLP 3-9-1 | 0.6079 | 0.1514 | 0.0229 | 0.8985 | 0.048 | 0.0023 | 0.9802 | 0.0347 | 0.0012 | Exponential | Logistic |
| MLP 3-8-1 | 0.5743 | 0.1572 | 0.0247 | 0.9317 | 0.0398 | 0.0016 | 0.9127 | 0.0483 | 0.0023 | Exponential | Tanh |
| MLP 3-4-1 | 0.5872 | 0.1546 | 0.0239 | 0.8713 | 0.0563 | 0.0032 | 0.9791 | 0.0329 | 0.0011 | Exponential | Logistic |
| MLP 3-7-1 | 0.566 | 0.1566 | 0.0245 | 0.8983 | 0.0533 | 0.0028 | 0.9348 | 0.0392 | 0.0015 | Tanh | Identity |
| MLP 3-6-1 | 0.5418 | 0.1597 | 0.0255 | 0.9315 | 0.0477 | 0.0023 | 0.8702 | 0.0511 | 0.0026 | Exponential | Identity |
| MLP 3-2-1 | 0.5303 | 0.161 | 0.0259 | 0.9368 | 0.0458 | 0.0021 | 0.8036 | 0.061 | 0.0037 | Logistic | Tanh |
| MLP 3-7-1 | 0.565 | 0.1569 | 0.0246 | 0.8884 | 0.0512 | 0.0026 | 0.8552 | 0.0547 | 0.003 | Tanh | Identity |
| MLP 3-5-1 | 0.544 | 0.1595 | 0.0254 | 0.9032 | 0.0516 | 0.0027 | 0.8434 | 0.0561 | 0.0031 | Logistic | Tanh |
| MLP 3-10-1 | 0.5706 | 0.1562 | 0.0244 | 0.887 | 0.0577 | 0.0033 | 0.8662 | 0.0569 | 0.0032 | Tanh | Tanh |
| MLP 3-9-1 | 0.5351 | 0.161 | 0.0259 | 0.8769 | 0.0592 | 0.0035 | 0.9155 | 0.0422 | 0.0018 | Logistic | Identity |
Table 7: The fitness statistics of ANN (MLP) model for DR prediction.
| Statistics | Linear | Polynomial | RBF | Sigmoid | |
|---|---|---|---|---|---|
| Training | R | 0.3209 | 0.3428 | 0.8575 | 0.344 |
| RMSE | 0.2418 | 0.2325 | 0.134 | 0.2307 | |
| MSE | 0.0584 | 0.0541 | 0.018 | 0.0532 | |
| Testing | R | 0.6995 | 0.9126 | 0.9499 | 0.5708 |
| RMSE | 0.2159 | 0.1979 | 0.084 | 0.202 | |
| MSE | 0.0466 | 0.0392 | 0.0071 | 0.0408 | |
| Overall | R | 0.4389 | 0.453 | 0.8836 | 0.4116 |
| RMSE | 0.2343 | 0.2227 | 0.1212 | 0.2225 | |
| MSE | 0.0549 | 0.0496 | 0.0147 | 0.0495 | |
| Hyperparameter | C=10.000, nu=0.100 | C=7.000, nu=0.500, degree=2.000, gamma=0.215, coefficient=0.000 | C=7.000, epsilon=0.100, gamma=9.300 | C=9.000, nu=0.500, gamma=0.222, coefficient=0.000 |
Table 8: The fitness statistics of SVM model for DR prediction.
Conclusion
From this study, it can be inferred that higher temperatures speed up Indian spinach drying by reducing moisture content and drying time. Increased air velocities also enhance moisture evaporation. Efficient convective heat and mass transfer were recorded. The Page and Hii, et al. models accurately represent drying behavior. Higher air velocities increase effective moisture diffusivity, quickening moisture removal and lowering activation energy. A 3-8-1 MLP setup with Tanh activation in hidden layers and Logistic activation in the output is optimal for Moisture Ratio prediction. In SVM models, the RBF kernel consistently outperforms others in correlation, RMSE, and MSE for drying prediction. Polynomial kernel is viable, Linear and Sigmoid kernels perform less well. SVM kernel-specific hyper parameters give insights. MLP models using Exponential hidden and Logistic output activations excel in predicting Indian spinach drying.
References
-
Hanumappa M (2019) Malabar spinach (Basella alba) is a Nutritious and Ornamental Plant. University of the District of Columbia, USA.
-
Garavand AT, Rafiee S, Keyhani A (2011) Study on Effective moisture diffusivity, activation energy and mathematical modeling of thin layer drying kinetics of bell pepper. Australian Journal of Crop Science AJCS 5(2): 128-131.
-
Touil A, Chemkhi Saber, Zagrouba F (2014) Moisture Diffusivity and Shrinkage of Fruit and Cladode of Opuntia ficus-indica during Infrared Drying. Journal of Food Processing 2014: 1-9.
-
Mujumdar AS, Devahastin S (2008) Fundamental principles of drying in Guide to Industrial Drying.
-
Deshmukh SA, Gaikwad DK (2014) A review of the taxonomy, ethnobotany, phytochemistry diffusivity, activation energy and mathematical modeling of thin layer drying kinetics of bell pepper. Australian Journal of Crop Science 5(2): 128-131.
-
Caywood MS, Roberts DM, Colombe JB, Greenwald HS, Weiland MZ (2017) Gaussian process regression for predictive but interpretable machine learning models: An example of predicting mental workload across tasks. Frontiers in Human Neuroscience 10: 647.
-
Midilli A, Kucuk H (2003) Mathematical modeling of thin layer drying of pistachio by using solar energy. Energy Conversion Management 44(7): 1111-1122.
-
Kaleemullah S, Kailappan R (2006) Modelling of thin- layer drying kinetics of red chilies. Journal of Food Engineering 76(4): 531-537.
-
Wang CY, Singh RP (1978) A single layer drying equation for rough rice. American society Agricultural Engineering, Paper No. 78-3001, USA.
-
Onwude DI, Hashim N, Abdan K, Janius R, Chen G (2018) Modelling the mid-infrared drying of sweet potato: Kinetics, mass and heat transfer parameters, and energy consumption. Heat Mass Transfer 54: 2917-2933.
-
Kashaninejad M, Mortazavi A, Safekordi A, Tabil LG (2007) Thin-layer drying characteristics and modelling of pistachio nuts. Journal of Food Engineering, 78(1): 98- 108.
-
Da Silva WP, eSilva CMDPS, Gama FJA, Gomes JP (2014) Mathematical models to describe thin-layer drying and to determine drying rate of whole bananas. Journal of the Saudi Society of Agricultural Sciences 13(1): 67-74.
-
Derossi A, Severini C, Cassi D (2011) Mass Transfer Mechanisms during Dehydration of Vegetable Food: Traditional and Innovative Approach. In: El-Amin M (Ed.), Advanced Topics in Mass Transfer. Intech, pp: 305- 354.
-
Hii CL, Law CL, Cloke M, Suzannah M (2009) Thin layer drying kinetics of cocoa and dried product quality. Biosystems Engineering 102(2): 153-161.
-
Yaldiz O, Ertekin C (2001) Thin layer solar drying of some vegetables. Drying Technology 19(3-4): 583-597.
-
Premi M, Sharma H, Upadhyay A (2012) Effect of Air Velocity and Temperature on the Drying Kinetics of Drumstick Leaves (Moringa Oleifera). International Journal of Food Engineering 8(4): 1-21.
-
Jun-Wen B, Hong-Wei X, Hai-Le M, Cun-Shan Z (2018) Artificial Neural Network Modeling of Drying Kinetics and Color Changes of Ginkgo Biloba Seeds during Microwave Drying Process. Journal of Food Quality 2018: 1-8.
-
Rodríguez J, Clemente G, Sanjuán N, Bon J (2014) Modelling drying kinetics of thyme (Thymus vulgaris L.): Theoretical and empirical models, and neural networks. Food Science and Technology International 20(1): 13- 22.
-
Ningning J, Jiyang MA, Rongge MA, Yang Z, Panyu C, et al. (2023) Effect of slice thickness and hot-air temperature on the kinetics of hot-air drying of Crabapple slices. Food Science and Technology, pp: 1-8.
-
Krokida MK, Karathanos VT, Maroulis ZB, Marinos- Kouris D (2003) Drying kinetics of some vegetables. Journal of Food Engineering 59(4): 391-403.
-
Clemente G, Sanjuán N, Andres Carcel J, Mulet A (2014) Influence of Temperature, Air Velocity, and Ultrasound Application on Drying Kinetics of Grape Seeds. Drying Technology 32(1): 68-76.
-
Dorneles LNS, Goneli ALD, Cardoso CAL, da Silva CB, Hauth MR, et al. (2019) Effect of air temperature and velocity on drying kinetics and essential oil composition of Piper umbellatum L. leaves. Industrial Crops & Products 142, pp: 111846.
-
Fernando JAKM, Amarasinghe ADUS (2016) Drying kinetics and mathematical modeling of hot air drying of coconut coir pith. SpringerPlus 5: 807.
-
Murthy TPK, Manohar B (2013) Hot air-drying characteristics of mango ginger: Prediction of drying kinetics by mathematical modeling and artificial neural network. J Food Sci Technol 51(12): 3712-3721.
-
Qadri OS, Osama K, Srivastava AK (2020) Foam mat drying of papaya using microwaves: Machine learning modeling. Journal of Food Process Engineering 43(6).
-
Lertworasirikul S, Saetan S (2010) Artificial neural network modeling of mass transfer during osmotic dehydration of kaffir lime peel. Journal of Food Engineering 98(2): 214-223.
-
Chaurasia P, Younis K, Qadri OS, Srivastava G, Osama K (2019) Comparison of Gaussian process regression, artificial neural network, and response surface methodology modeling approaches for predicting drying time of mosambi (Citrus limetta) peel. Journal of Food Process Engineering 42(2).
- The Role of Podocyte Apoptosis and the Involvement of SIRT1 in Diabetic Nephropathy
- Dealcoholization of Beer by Osmotic Distillation for the Beverage Industry
- Biopolymer-Based Edible Packaging- Biomaterials, Methods, and Applications in Food Industry: An Updated Review
- Influence of Bioprocessing Methods on 'China Rice' (Gawal R1), and Soyabean Supplementation on the Quality of Complementary Food
- Cassava (Manihot esculenta) Varietal Growth, Yield and Cyanide Content Performance in Three Sites in the South- Eastern Semi Arid Regions of Kenya
- Food Waste Treatment, Recycling, Management and Production of Value-Products-An Update on Methodologies and Current Trends