Heavy Metal Analysis on Some Water Samples Using Atomic Absorption Spectroscopy
Drinking water is vital for life existence worldwide which is used on a daily basis. The quality of this drinking water however varies from one product to another. In this study, analysis of four heavy metals: Zn, Cu, Cd, and Pb were done by AAS technique in four water samples; Tap water, Well water, Faro bottle water and KSUSTA table water. The results of the study showed that Pb was not detected in the Tap, Well, and Faro Bottle water samples but was however detected in the KSUSTA Table water sample (0.954 mg/L) well above the limits of USEPA (0.015 mg/L), WHO (0.01 mg/L), and SON (0.01 mg/L) respectively. Also, the Well Water sample did not contain Cd, but was detected in the other three samples well above the standard limits. Cu was detected in all the samples below the limits by the regulatory bodies. The KSUSTA Table Water did not contain Zn while the other three water samples had Zn levels below the max limits. Hence, the Well water sample was shown to be the best or safer for consumption as it did not contain any Pb or Cd concentration and had Cu and Zn levels below the permissible limits by these agencies. Therefore, those consuming KSUSTA Table water, Faro Bottle water and Tap water in Aliero town should be cautious of the potential danger from the short or long term effect of Pb and Cd toxicity to the human body.
Introduction
The water is one of the most important parts of the ecosystem. Living things exist because of this is the only planet that has the existence of water. It is essential for the survival of all the living things be it plant or animal life. Water is the most abundant commodities in nature but also the most misused one. Although earth is a blue planet and 80% of earth’s surface is covered by water, the hard fact of life is that about 97% is locked in oceans and sea which is too saline to drink and direct use for agricultural or industrial purposes. 2.4% is trapped in polar icecaps and glaciers, from which icebergs break off and slowly melt at sea and oceans. Also due to increased human population, use of fertilizers in the agriculture and manmade activities, the natural aquatic resources causes heavy and varied pollution in aquatic environment leading to depletion of aquatic biota [1]. Water of good drinking quality is of basic importance to human physiological cycle and man’s continued existence depends very much on its availability [2].
There are many types of drinking water available in Nigerian community ranging from tap water, well water, different brands of bottle water, different packaged or sachet table water, etc. The numerous drinking water production industries mean that there will be limited frequency of quality assessment by regulatory agencies like NAFDAC if at all they do monitor these industries. If it turns out that there is no any monitoring of quality of these numerous production industries, except for money to be paid and license will just be given, then there will be a surge in heavy metal contamination of the drinking water being sold in the markets of many communities in the country. These industries will therefore produce drinking water anyhow while targeting profit only without necessarily considering safety or quality of product. If there is heavy metal contamination, it implies potential threat of metal toxicity and this is harmful to the body and raises health concern.
The three factors including rapid industrialization process, rapid population growth, and agricultural activities have brought the risk of increasing the pollution index in natural environments, such as soil, water, air, etc [3]. The multipurpose usage of heavy metals, persistence in the environment, bioaccumulation and high toxicity, make them one of the most serious pollutants in the environment. Those that originated from anthropogenic sources could be found in all components of the environment [3].
Hence, there is the need for heavy metal content to be analysed or determined in some of these water samples sold daily in the market in these communities so as to monitor the levels of heavy metals in the products. If quality control protocols are not followed in those industries, then metal contamination could occur through production or packaging of water for drinking. Hence, since drinking water is used on a daily basis, its quality needs to be monitored as heavy metal contamination above a certain limit is potentially toxic or harmful to the body via acute or chronic toxicity. This analysis can be done using AAS metal determination in some of these water samples. This therefore becomes a reason for carrying out this kind of analysis in water samples so as to assess the safety of these numerous drinking water in the markets.
The main aim of this study is to analyze heavy metal contents including Pb, Cd, Cu, and Zn in some selected water samples to know whether they are safe for drinking or not.
Materials and Methods
Sample Collection and Preservation
Each sample was collected three times, the samples are then combined and mixed, and the final sample for analysis was taken from the combined samples for each water sample type. Selection of appropriate sample container is also utmost important to minimize the leaching of contaminants from plastic containers into samples and/or absorption of some sample analytes into the walls of plastic containers. Normally, plastic or glass may be preferred for one material but may be restricted for other. For example, boron, silica and sodium may be leached from soft glass but not plastic. Similarly, trace levels of other metals may be absorbed onto the walls of glass containers. For metal ions, sample containers should be made of high density polyethylene to avoid contamination with metal ions through glass container. But for mercury ion analysis, the samples should be stored in glass container as it reacts with organic materials. Before use, sampling bottles should be rinsed first with tap water, secondly with deionised or ion exchange water and then with nitric acid [4]. Hence, the samples were collected in a clean polyethylene bottles for the analysis because glass bottles absorb metals and therefore will cause inaccuracy to analysis. Composite samples were collected as much as possible instead of just Grab samples or a single purchase. After the completion of sampling task, preservation of the collected water samples is necessary to obtain good results. Therefore, sample preservation can be achieved by making slurry of ice and water for cooling at 4°C to minimize the potential for volatilization or biodegradation between sampling and analysis [1]. According to Engwa, et al. [5], ‘‘ some metal ions like aluminium, cadmium, chromium, copper, iron, lead, manganese, silver and zinc are subject to loss by adsorption on, or ion exchange with the walls of glass containers. Therefore, ultrapure nitric acid is necessary to add into the sample for metal ions preservation. Besides this, acidification of the collected water sample is essential below pH 2.0 to minimize the precipitation and adsorption on container walls’’. Hence, Acidification with (1+1) nitric acid to pH 2 or less was used to stabilize the metal content. An approximately 3 mL of (1+1) nitric acid per liter of sample was sufficient for acidification [6]. The samples used were labeled as follows: Sample 1: KSUSTA Table Water, Sample 2: Tap Water, Sample 3: Well Water, Sample 4: Faro Bottle Water
Sample Preparation for AAS Analysis
Sample preparation is a very important step in analytical chemistry which should be done very carefully without any mistake or carelessness. Sample preparation involving digestion of water samples for metal ion analysis by atomic absorption spectrophotometer can be achieved by adopting the standard method by Engwa, et al. [5]: 50 ml of well mixed, acid preserved sample is measured into a beaker. 5 ml conc. HNO3 + few glass beads were added. It was then slowly boiled and evaporated on a hot plate upto 10-20 ml. Conc. HNO3 (few ml) was added until the completion of digestion (Sample was not allowed to dry). The beaker was washed down with deionized water (3 times). It was then filtered and poured in 100 ml volumetric flask and made up to 100 ml, mixed thoroughly.
Heavy Metal Determination
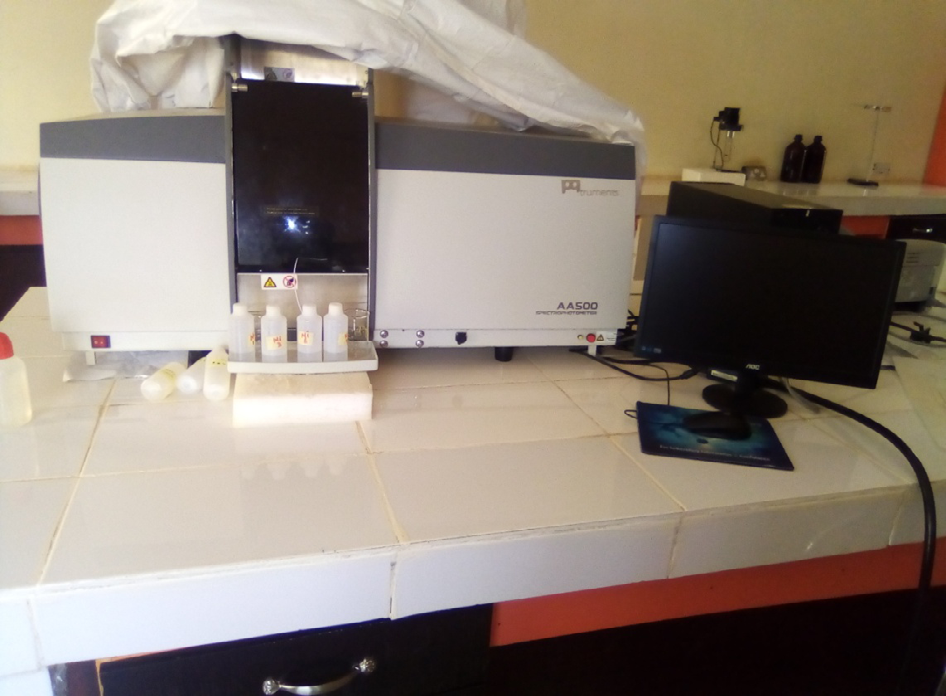
The digested samples were taken to the Central Research Laboratory at Kebbi State University of Science and Technology, Aliero, for AAS determination of heavy metals including Cadmium, Zinc, lead, and Copper. Three replicates determination was done for each metal analysis and the instrument gives the mean of the results.
$$ \begin{array}{c c c c c c} \mathrm {L i g t S o u r c e} & \mathrm {S a m p l e C e l l} & \mathrm {M o n o c h r o m a t o r} & \mathrm {D e t e c t o r} & \mathrm {O u t p u t U n i t} \\ (\mathrm {H o l l o w C a t h o d e L a m p}) & (\mathrm {A b s o r p t i o n C e l l}) & & & (\mathrm {D a t a}) \\ \mathrm {P r o c e s s o r}) & & & & \end{array} $$ Figure 2: Schematic diagram of an atomic absorption spectrophotometer.
After the digestion has been completed, the AAS machine was used to determine the presence and concentration in the sample containing the metal analyte (Figure 1). The digested sample is aspirated into air-acetylene flame causing evaporation of the solvent and vaporization of free metal atoms, this method is called atomization, a light source (hallow cathode lamp) operating in the Uv visible spectra region is used to cause electronic excitation of the metal and the absorbance is measured with a conventional Uv-visible dispersive spectrometer with photomultiplier detector (Figure 2).
Results and Discussion
In Table 1, the mean concentrations of Lead in the water samples; KSUSTA Table Water, Tap Water, Well Water, and Faro Bottle Water are given in mg/L. The results in the table indicated that only the KSUSTA Table Water sample had about 0.954 mg/L concentration of Pb. In comparison with the regional and international standard limits for drinking water quality, this value is well above the set limits by the three regulatory bodies USEPA (0.015 mg/L), WHO (0.01 mg/L), and SON (0.01 mg/L) respectively. Hence, there is serious health concern with the KSUSTA table water considering the toxicity or harmful nature of Lead. The other three water samples are therefore safe for consumption in terms of Pb contents.
| Sample ID | Conc. (ppm) | SD | RDS (%) | |
|---|---|---|---|---|
| 1 | KSUTA Table Water | 0.954 | 0.064 | 6.71 |
| 2 | Tap Water | ND | - | - |
| 3 | Well Water | ND | - | - |
| 4 | Faro Bottled Water | ND | - | - |
Table 1: The Mean Concentration of Lead (Pb) in the Samples. Keys: ND = Not detected, SD = Standard Deviation, RSD = Relative Sta
Table 1: The Mean Concentration of Lead (Pb) in the Samples. Keys: ND = Not detected, SD = Standard Deviation, RSD = Relative Standard Deviation In Table 2, the mean concentrations of Zinc in the water samples; KSUSTA Table Water, Tap Water, Well Water, and Faro Bottle Water are given in mg/L. The results in the table indicated that only the KSUSTA Table Water sample was free from Zinc concentration as it was not detected in the sample. The other three samples had Zn levels in the following order: Tap Water (0.472 mg/L) > Faro Bottle Water (0.021 mg/L) > Well Water (0.009 mg/L). In comparison with the regional and international standard limits for drinking water quality, all these values detected in the three water samples fall well below the set limits by the three regulatory bodies USEPA (5.0 mg/L), WHO (Not mentioned), and SON (3.0 mg/L) respectively. Hence, there is no any possible threat or toxicity concern for Zinc in these samples.
| S/N | Sample ID | Conc. (ppm) | SD | RDS (%) | |
|---|---|---|---|---|---|
| 1 | KSUTA Table Water | ND | - | - | - |
| 2 | Tap Water | 0.472 | 0.051 | 10.81 | |
| 3 | Well Water | 0.009 | 0.063 | 700 | |
| 4 | Faro Bottled Water | 0.021 | 0.055 | 261.9 |
Table 2: The Mean Concentration of Zinc (Zn) in the Samples. Keys: ND = Not detected, SD = Standard Deviation, RSD = Relative Sta
In Table 3, the mean concentrations of Copper in the water samples; KSUSTA Table Water, Tap Water, Well Water, and Faro Bottle Water are given in mg/L. The results in the table indicated that all the water samples contained some amount of Cu given in mg/L. The order of Cu concentrations in the samples is: KSUSTA Table Water (0.293 mg/L) > Tap Water (0.192 mg/L) > Well Water (0.094 mg/L) = Faro Bottle Water (0.094 mg/L). In comparison with the regional and international standard limits for drinking water quality, all these values detected in the four water samples fall below the set limits by the three regulatory bodies USEPA (1.3 mg/L), WHO (2.0 mg/L), and SON (1.0 mg/L) respectively. Hence, there is no any possible threat or toxicity concern for Copper in these samples.
| Sample ID | Conc. (ppm) | SD | RDS (%) | |
|---|---|---|---|---|
| 1 | KSUTA Table Water | 0.293 | 0.001 | 0.34 |
| 1 | Tap Water | 0.192 | 0.0004 | 0.21 |
| 1 | Well Water | 0.094 | 0.004 | 4.26 |
| 1 | Faro Bottled Water | 0.094 | 0.003 | 3.19 |
Table 3: The Mean Concentration of Copper (Cu) in the Samples. Keys: ND = Not detected, SD = Standard Deviation, RSD = Relative S
| Sample ID | Conc. (ppm) | SD | RDS (%) | |
|---|---|---|---|---|
| 1 | KSUTA Table Water | 0.87 | 0.004 | 0.46 |
| 2 | Tap Water | 0.87 | 0.003 | 0.34 |
| 3 | Well Water | ND | - | - |
| 4 | Faro Bottled Water | 0.295 | 0.002 | 0.68 |
Table 5: The Mean Concentration of Cadmium (Cd) in the Samples. Keys: ND = Not detected, SD = Standard Deviation, RSD = Relative
Table 4: The Mean Concentration of Cadmium (Cd) in the Samples. Keys: ND = Not detected, SD = Standard Deviation, RSD = Relative Standard Deviation In Table 4, the mean concentrations of Cadmium in the water samples; KSUSTA Table Water, Tap Water, Well Water, and Faro Bottle Water are given in mg/L. The results in the table indicated that the Well Water sample did not contain Cd concentration. However, the other three water samples had Cd concentration in the order: Tap Water and KSUSTA Water (0.870 mg/L) > Faro Bottle Water (0.295 mg/L). In comparison with the regional and international standard limits for drinking water quality, all these values detected in the three water samples fall well above the set limits by the three regulatory bodies USEPA (0.005 mg/L), WHO (0.003 mg/L), and SON (0.003 mg/L) respectively. Hence, there is serious possible threat or toxicity concern for Cadmium in the three water samples.
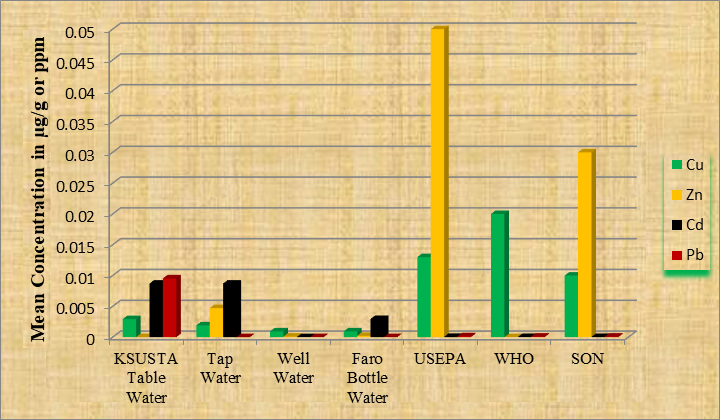
In Table 5, the maximum or acceptable limits for the four heavy metals analyzed in the water samples as set by USEPA, WHO, and SON is shown. These values are used as standard values for comparison with the concentrations detected in some of the studied samples. Direct comparison can be seen in Figure 3 where all the limits of these four metals as set by the regulatory bodies can be easily compared with the amount detected in some of the samples.
| Metal | USEPA a (mg/L) | WHO a (mg/L) | SON b (mg/L) |
|---|---|---|---|
| Cu | 1.3 | 2 | 1 |
| Zn | 5 | NM | 3 |
| Cd | 0.005 | 0.003 | 0.003 |
| Pb | 0.015 | 0.01 | 0.01 |
Table 4: A comparison of USEPA, WHO and SON guideline values (mg/L) of metal ions for drinking water. a: Sharma, et al. [4]. b: N
The results shown in Tables 1 - 4 reveal the outcome of the heavy metal analysis by using AAS technique in the analyzed water samples. The tables have values as mean concentration of metals in ppm, standard deviation, and the percentage relative standard deviation. S.D (S) describes the spread of the individual measurements about the mean. The true mean lies within the range of $$ \mu = x + S. D $$
Therefore, the values that do not fall within this range
are possible errors. Any value outside this range may be an
error which after other statistical operations, a decision of
whether to accept or reject these values is made at a given
confidence limit on the basis of the level of deviation. The
value of the S.D. is usually reported in the same unit as that
of the mean. According to Everitt, et al. [8], ‘‘the relative
standard deviation (RSD) is a special form of the standard
deviation (std dev). It is generally reported to two decimal
places (i.e. an RSD of 2.9587878 becomes 2.96). As the
denominator is the absolute value of the mean, the RSD will
always be positive. The RSD tells you whether the “regular”
std dev is a small or large quantity when compared to
the mean for the data set. For example, you might find in an
experiment that the std dev is 0.1 and your mean is 4.4.
0.1 :100 2.3% 4.4 Your RSD for this set of numbers is × =
This result tells you that your standard deviation is 2.3% of the mean of 4.4, which is pretty small. In other words, the data is tightly clustered around the mean. On the other hand, if your percentage was large, say, 55% – this would indicate your data is more spread out. The RSD is sometimes used for convenience but it can also give you an idea about how precise your data is in an experiment. The more precise your data is, the smaller will be the RSD. The RSD usually written with the mean and a plus/minus symbol: 4.4 ± 2.3%. In some cases, the coefficient of variation and the RSD are the same thing. However, the RSD cannot be negative while the Coefficient of Variation can be positive or negative. This is because the two formulas differ in a minor way: the Coefficient of Variation divides by the mean while the RSD divides by the absolute value of the mean’’. The relative standard deviation of a set of data can be depicted as either a percentage or as a number.
According to RSD Horwitch function the highest relative standard deviation values acceptable for the concentration of less than or equal to 1000 ppm is 10% [9]. Hence, since the values of relative standard deviations (% RSD) in Tables 1-4 are less than 10% with the exception of Zn in Well and Faro bottle water of the mean concentrations of metals, the analysis showed reasonable repeatability accuracy because the relative standard deviation values evaluated were within the acceptable range.
Conclusion
From the results obtained in this study, it is seen that Pb was not detected in the Tap, Well, and Faro Bottle water samples but was however detected in the KSUSTA Table water sample well above the limits of USEPA, WHO, and SON respectively. Also, the Well Water sample did not contain Cd, but was detected in the other three samples well above the standard limits. Cu was detected in all the samples below the maximum permissible limits by the regulatory bodies. The KSUSTA Table Water was free from Zn concentration while the other three water samples had Zn levels below the limits by the regulatory agencies. The overall assessment from the results obtained by the AAS metal analysis in the studied water samples, the Well water sample was shown to be the best or safer for consumption as it did not contain any Pb or Cd concentration and had Cu and Zn levels below the permissible limits by USEPA, WHO, and SON respectively. Therefore, those consuming KSUSTA Table water, Faro Bottle water and Tap water in Aliero town should be cautious of the potential danger from the short or long term effect of Pb and Cd toxicity to the human body. As compared with other study in Saudi Arabia by Bridgeford [10], the levels of heavy metals in the water used for irrigation purpose are below the maximum allowable limits recommended by FAO’s except for Cu and Cd. The study revealed that the groundwater in the study area was free from significant enrichment by heavy metals from anthropogenic sources.
Conflicts of Interest
The authors declare no conflict of interest
Acknowledgments
The authors are very grateful to the staff in the Department of Pure and Applied Chemistry, Kebbi State University of Science and Technology, Aliero, for providing all the chemicals, glass ware apparatus and other facilities used in this work. Special thanks go to Dr A. Muhammad, Head of the Department of Chemistry, KSUST, Aliero for his help regarding the chemicals and materials in this work.
References
-
Mahananda MR, Mohanty BP, Behera NR (2010) Physico- Chemical Analysis of Surface and Ground Water of Bargarh district, Orissa, India. International Journal of Research and Reviews in Applied Sciences 2(3): 284- 295.
-
Lamikanra A (2011) Essential Microbiology for Students and Practitioner of Pharmacy, Medicine and Microbiology, Amkra Books Lagos. Rasyan Journal of Chemistry 4(2): 461-465.
-
Assubaie FN (2015) Assessment of the levels of some heavy metals in water in Alahsa Oasis farms, Saudi Arabia, with analysis by atomic absorption spectrophotometry. Arabian Journal of Chemistry 8(2): 240-245.
-
Sharma B, Tyagi S (2013) Simplification of Metal Ion Analysis in Fresh Water Samples by Atomic Absorption Spectroscopy for Laboratory Students. Journal of Laboratory Chemical Education 1(3): 54-58.
-
Engwa AG, Ihekwoaba CJ, Ilo US, Unaegbu M, Ayuk LE, et al. (2015) Determination of some soft drink constituents and contamination by some heavy metals in Nigeria. Toxicology Reports 2(1): 384-390.
-
Bruno G (2013) Acid-Alkaline Balance and health: An examination of the data. Supplement Science 34-39.
-
NIS 554: (2007) Nigerian Standard for Drinking Water Quality, Nigerian Industrial Standard (NIS), Approved by Standards Organisation of Nigeria (SON), pp: 16-17.
-
Everitt BS, Skrondal A (2010) The Cambridge Dictionary of Statistics. 4th(Edn.), Cambridge University Press, pp: 480.
-
Aquisman AE, Assim ZB, Wahi RB, Kwabena DE, Festus W (2019) Validation of the Atomic Absorption Spectroscopy (AAS) for Heavy Metal Analysis and Geochemical Exploration of Sediment Samples from the Sebangan River. Advances in Analytical Chemistry 9(2): 23-33.
-
Bridgeford R (2015) The definitive acid and alkaline food chart.
- The Role of Podocyte Apoptosis and the Involvement of SIRT1 in Diabetic Nephropathy
- Dealcoholization of Beer by Osmotic Distillation for the Beverage Industry
- Biopolymer-Based Edible Packaging- Biomaterials, Methods, and Applications in Food Industry: An Updated Review
- Influence of Bioprocessing Methods on 'China Rice' (Gawal R1), and Soyabean Supplementation on the Quality of Complementary Food
- Cassava (Manihot esculenta) Varietal Growth, Yield and Cyanide Content Performance in Three Sites in the South- Eastern Semi Arid Regions of Kenya
- Food Waste Treatment, Recycling, Management and Production of Value-Products-An Update on Methodologies and Current Trends