Effect of Dietary Sucrose on Body Weight and Antioxidant Status (Vitamin C and Uric Acid) of Wister Strain of Albino Rats
Sucrose has been reported to be the most widely consumed carbohydrate in affluent countries, with 40% of carbohydrate consumed coming from sugar sources majorly glucose and fructose. Although claims have it that sucrose in diet aggravates asthma, muster illness, nourish nervous disorders, hasten hypertension; leads to diabetes, hurry heart diseases and add arteries. The present study aimed at the investigating the effects of dietary sucrose on the body weight and antioxidant status (vitamin c and uric acid) of wister strain of albino rats Thirty six (36) wister strain albino rats were randomly divided into 6 groups namely: Super High (SH), High (H), Medium (M), Low (L), Control (C) and Base-line (B) group containing basically weanling rats of (4 weeks of age). They were raised together in plastic cages and fed ad libitum with palletized growers feed. The rats were fasted overnight after the end of the 18 weeks and anaesthetized with diethyl ether in a kilner jar on the following morning between 8 and 10 0’clock. They were opened up and their blood samples were collected by cardiopunture method using a syringe and needle. Extraction of Serum from the whole blood samples involved centrifuging the blood at 1,500 r.p.m (6,000 X g) for 15 minutes. After centrifugation, the serum (supernatant) samples were decanted and stored for further Analysis. Vitamin C concentration, uric acid concentration, and the body weight of the rats were determined. The results of this study revealed that there was no significant difference (P < 0.05) observed for the terminal body weights of the groups: Control group (226.38 ± 15.31): Low group (229.42 ± 11.28) and Super high group (239.30 ± 11.01) For serum uric acid level,a significant difference (P < 0.05) was observed between the control group (7.55 ± 0.11) and Super High group (16.30 ± 0.09) High (15.07 ± 0.08).Medium (12.88 ± 0.12) Low (8.90 ± 0.17). However, a downward trend was observed between the groups. Dietary sucrose was observed to significantly affect uric acid concentration .A significant difference (P < 0.05) was observed between the serum vitamin C levels of control group (184.8 ± 5.57) and low group. There was significant difference observed in the uric acid concentration and vitamin C concentration of the experimental rats used. However, no significant difference was observed in the body weight of the rats used for this study when sucrose consumption was increased. Yet care must be taken because the results clearly indicated a strong detrimental effect of sucrose on the cardiovascular well-being of the subjects.
Introduction
Sucrose, an ordinary table sugar, is the most common dietary sugar which is refined from sugar canes (13% sugar) or sugar beets (16% sugar), but is also naturally present in fruits [1]. Sucrose is extracted as a sweet, white crystalline substance, which is a valuable food product, and being antiputrescent, it is largely used in the preservation of fruits [2]. It is also a well-known constituent in many products such as cakes, candles, jam, fruits, soft drinks etc [3]. The increase in consumption of sucrose and the alleged consequences associated with the high intake of sucrose consumption has brought about various claims and hypothesis [4], which has led to research studies and publications by scientist nutritionists and nutritional organizations all over the world [5]. There have been series of researches from organizations like USFDA’s sugar task force, the British foundation task force on sugar who came up with various counter claims on the pathogenesis of sugar. The British Nutrition Foundation task on sugar and syrups and the United Kingdom force report also invested in sugar research with series of claims on the associated risks that sugar (sucrose) aggravates asthma, mental illness and nervous disorders [6].
Ordinary body weight increases with age. The average body weight for a normal adult is 70kg [7]. There have been a number of recent studies that looked at sucrose diet and body weight in both children and adults. Bolton-Smith, et al. Observed that weight falls as the amount of sugar (sucrose) eaten rises. In other words, those eating food high in sucrose were the slimmest and vice versa. Increase in body weight has been reported by to be a symptom of obesity whereas conditions such as diabetes and other eating disorders reduces body weight in normal individuals [6]. Feeding a high sucrose diet does not induce obesity in lean rats or enhance weight gain in obese rats if caloric intake is appropriate [8].
Vitamin C is a water-soluble vitamin, antioxidant, and essential co-factor for collagen biosynthesis, carnitine and catecholamine metabolism, and dietary iron absorption [9]. Humans are unable to synthesize vitamin C, so it is strictly obtained through the dietary intake of fruits and vegetables.
Citrus fruits, berries, tomatoes, potatoes, and green leafy vegetables are excellent sources of vitamin C [10]. Although most vitamin C is completely absorbed in the small intestine, the percentage of absorbed vitamin C decreases as intraluminal concentrations increase. A deficiency in vitamin C results in scurvy, which presents with hemorrhage, hyperkeratosis, and hematological abnormalities [11].
It has been reported that high intake of sucrose consumption causes a burst of uric acid production [12]. Hyperuricemia is commonly found in hypertensive and gout patients and this has been reported to be rather due to impaired renal elimination of urate than from it’s over production [13]. The increase in uric acid caused by fructose containing carbohydrates is not only a risk factor associated with heart disease but also appears to be associated with short term and adaptive changes in metabolism consistent with decreased hepatic levels of Adenosine triphosphate (ATP), which could potentially affect the myriad of metabolic processes dependent on ATP [13]. Feeding of sucrose, at levels that is very high has been shown to increase fasting uric acid levels in hyperinsulinemic subjects and in patient with NIDDM [12].
Sucrose consumption has greatly increased throughout the world. For instance, sucrose has become a fashionable target, so widely consumed in highly refined foods and soft drinks [8]. This is especially true in affluent countries, where half of all the carbohydrate consumed comes majorly from sucrose. Although, it has always been undisputable that two much of everything including sucrose is bad, nutritionists have tend towards clarifying the differences between refined sugar, natural sugar, unrefined sugar, and unprocessed sugar, even on health grounds [14]. Little wonder then that sucrose added to diet has gained greater attention than the one naturally present, for example in fruits. Although there have been claims that sugar (sucrose) in diet aggravate asthma, muster illness, nourish nervous disorders, hasten hypertension; leads to diabetes among other claims [7], at what consumption rate per an individual can sucrose be said to be harmful and how exactly sucrose in our diet does directly or indirectly leads to poor health?. Given all these, it would be justifiable to look critically at the effect of sucrose consumption in our diets on body weight and antioxidant status. The present study investigated the effect of dietary sucrose on body weight and antioxidant status (vitamin C and uric acid) of wister strain of albino rats.
Materials and Methods
Experimental Animals
Thirty six (36) Wister strain albino rats, self-bred in the Department of Biochemistry of Olabisi Onabanjo, Ikenne, Nigeria, were used for this research study. The rats were raised together in plastic cages and fed ad libitum with palletized growers feed (manufactures by Vitals feed, Jos, Nigeria) and water. At 9 months of age, the rats were randomly divided into 6 groups namely: Super High (SH), High (H), Medium (M), Low (L), Control (C) and Base-line (B) group containing basically weanling rats of (4 weeks of age). Each group contained 6 rats per group. Each rat was housed in a separate cage made of wood and wire gauze (approximately 6.25” X 9.5” X 9”; l x b x h). All rats were housed in the same room which was well ventilated with 12h Light: 12h darkness photoperiod. The amount of sucrose fed to the experimental rats was in proportion to their weight with the exception of the control and baseline, which were fed with normal feed. The experimental diets for super high, high, medium and low groups were prepared fresh each day by adding calculated amount of sucrose to the stock feed. The amount of sucrose for a super high, high, medium and low were calculated by multiplying the normal sugar intake of 1.63/kg body. Each of the group was fed with the experimental diet for a period of 18 weeks. Water was also made available to the rats throughout the experimental period. The control and baseline were fed with normal stock feed without sucrose.
Formulation of Sucrose Diet
The formulation of sucrose diet was done in accordance with the description of Kobi, et al. [15] which is given by the formula below Tables 1,2.
Where: n=Multiplying factor; 1.63 is the standard sucrose consumption per body weight (approximately 2g); 0.5 was used as the multiplying factor for the Medium group; 1.0 was used as the multiplying factor for the low group; 2.0 was used as the multiplying factor for the high group; 4.0 was used as the multiplying factor for the super high group
- For Super high mean weight = 217.18g SH = [2/100 X 217.18] X 4 = 1.73744 X 6 = 10.4g
- For High, mean weight = 216.32 H = [2/100 X 216.32] X 2 0.86548 X 6 = 5.2g
- For Medium, Mean weight = 216.57g M = [2/100 X 216.57] X1 = 0.4334 X 6 = 2.6g
- For Low, Mean weight = 217.57g L = [2/100 X 217.57] X 0.5 = 0.21757.6 = 1.3g
| Sucrose Composition (g/kg body wt.) | |
|---|---|
| Super high | 10.4 |
| High | 5.2 |
| Medium | 2.6 |
| Low | 1.3 |
| Control | - |
| Control | - |
| Baseline | - |
Table 1: Sucrose consumption by experimental animals based on body weight.
| Amount | |
|---|---|
| Crude protein | 14.50% |
| Fat | 7.00% |
| Crude fibre | 7.20% |
| Calcium | 0.80% |
| Available phosphorus | 0.40% |
| Metabolisable Energy | 25 K Cal/kg |
| Essential amino acids | - |
| Antibiotics | - |
| Anti-oxidant | - |
| Vitamin pre-mix | - |
Table 2: Nutritional composition of stock feed fed to experimental rats.
Body Weight Determination
The body weights of each of the experimental rats were measured during the period of the experiment and also the average weight for each group were calculated and recorded. This involved removing the animals from their cages and placing them on a scale to take weight readings.
Collection of Blood Samples and Separation
The rats were fasted overnight after the end of the 18 weeks and anaesthetized with diethl either in a kilner jar on the following morning between 8 and 10 0’clock. They were then opened up and their blood samples were collected by cardiopunture method using a syringe and needle. Afterwards, extraction of serum from the collected whole blood samples involved centrifuging the blood at 1,500 r.p.m (6,000 X g) for 15 minutes. After centrifugation, the serum (supernatant) samples were decanted and stored for further Analysis.
Uric Acid Determination
Uric acid concentrations were determined by the standard enzymatic and spectrophotometric method using Uric acid Kit (Randox Lab. Ltd, co, Antrim, U.K) as described by Barr [16].
Thirty-eight (38) test tubes were used for this experiment. 36 test tubes were labeled which corresponded to the rats group, whereas the remaining two test tubes were labeled blank and standard. 2ml of the reagent solution was dispensed into all the test tubes. 0.02 ml of the serum sample was also dispensed into the test tubes except the test tube labeled blank and standard. In the test-tube labeled standard, 0.02 ml of the standard solution was dispensed into the test tube. The test tube labeled blank contained only the working reagent. The test tubes were transferred to a vortex to mix the solution and incubated for 10 minutes at room temperature. The absorbance of the samples were then measured at 540 mm using a spectrophotometer.
Vitamin C Determination
The vitamins C concentrations in the Serum were determined by the titrimetric method as described by Isam Eldin, et al. 5ml of 2, 6 dichlorophenolindophenol was standardized with standard ascorbic acid using starch as indicator. The ascorbic acid was ran slowly with constant shaking until a red colour was discharged. 3 titrations were done and the average titre value was recorded. 5ml of the dye was transferred into a conical flask and 5 ml of the diluted serum samples were transferred into the same conical flask and the solution was mixed together by shaking the conical flask. The whole mixture was back-titrated with standard ascorbic acid from the burette. One drop of the starch solution was added just before the end point of the reaction is recorded. The whole procedure was repeated for each of the samples from each group (SH, H, M, L, C AND B).
Statistical Analysis
The obtained results were analyzed statistically using One-Way Analysis of Variance (ANOVA), Also, the relationships between the serum uric concentration, serum vitamin C concentration and body weight for all the sugar fed groups were done by the Pearson (r) correlation coefficients using Statistical Package for Social Science (SPSS) version 23.0. Results were given as means ± S.D differences were considered significant when (P < 0.05).
Results
Effect of Dietary Sucrose on Body Weight
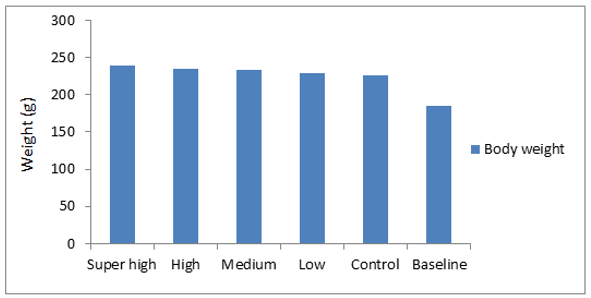
Table 3 and Figure 1 below provide a representation of the effect of sucrose on the average body weight of the six groups of experimental animals used for this study. The result revealed that rats in the super high group had the highest average body weight (239.30 ± 11.01) compared to all other experimental groups. Rats in the baseline group showed the lowest body weight (184.5 ± 26.73) compared to all other experimental groups. It was also observed that the average body weight of the experimental rats in the six groups is directly proportional to their sucrose composition intake. There was a progressive increase in weight gain of the rats across the experimental groups as their sucrose composition intake increased. The order is presented as follows: Super high (239.30 ± 11.01) > High (234.36 ± 11.28) > Medium (232.78 ± 3.16) > Low (229.42 ±9.60) > Control (226.38 ± 15.31) > Baseline (184.5 ± 26.73). However, it the difference in the body weight of the rats across the experimental groups was not significant (P < 0.05).
| Group | Body weight (g) |
| Super high | 239.30±11.01 |
| High | 234.36±11.28 |
| Medium | 232.78±3.16 |
| Low | 229.42±9.60 |
| Control | 226.38±15.31 |
| Baseline | 184.5±26.73 |
Table 3: Average body weight of rats for sucrose-fed treatments and control groups.
Effect of Dietary Sucrose on Uric Acid Concentration
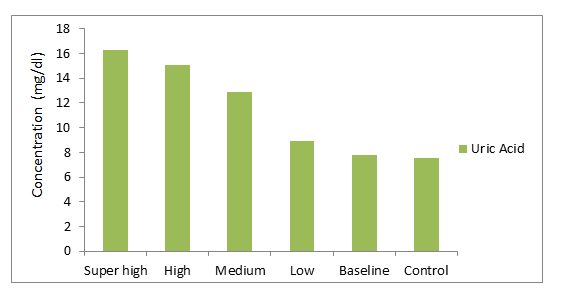
The effect of varying sucrose diets on serum uric acid of the experimental rats used for this study.is summarized in Table 4 and Figure 2 below. It was observed that the uric acid concentration of the experimental rats in the six groups is directly proportional to their sucrose composition intake. There was a progressive increase in uric acid concentration of the rats across the experimental groups as their sucrose composition intake increased. The order is presented as follows: Super high (16.30 ± 0.09) > High (15.07 ± 0.80) > Medium (12.88 ± 0.12) > Low (8.90 ± 0.17) > Baseline (7.75 ± 0.06) > Control (7.55 ± 0.11) The rats under the super high group showed the highest concentration of uric acid whereas rats in the baseline group showed the lowest concentration of uric acid level. However, it the difference in the body weight of the rats across the experimental groups was not significant. No significant difference was observed in the uric acid level between rats in the baseline and control group. Also, there was no significant difference (P < 0.05) in uric acid level between rats in the super high and high groups.
| Uric Acid Concentration (mg/dl) | |
|---|---|
| Super high | 16.30 ± 0.09 |
| High | 15.07 ± 0.80 |
| Medium | 12.88 ± 0.12 |
| Low | 8.90 ± 0.17 |
| Baseline | 7.75 ± 0.06 |
| Control | 7.55 ± 0.11 |
Table 4: Serum uric acid levels in sucrose-fed treatments and control groups.
Effect of Dietary Sucrose on Vitamin C Concentration
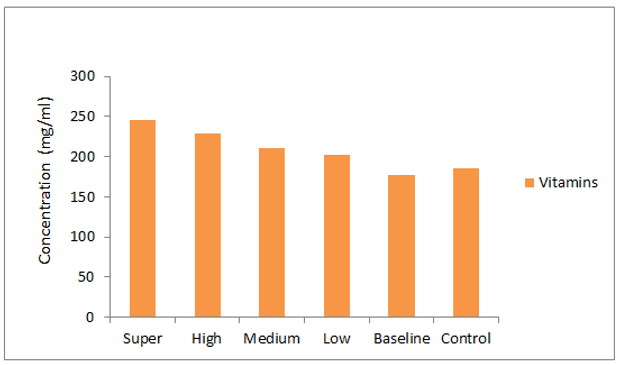
Table 5 and Figure 3 below provide a representation of the effect of dietary sucrose on the vitamin C concentration of six groups of experimental animals used for this study. It was observed that vitamin C concentration of the experimental rats in the six groups decreased progressively across the groups as the amount of sucrose in their feed decreased. However, the rats in the control group experienced an increase in vitamin C concentration compared to rats in the baseline group. Vitamin C concentration of the experimental rats across the groups was found to be directly proportional to their sucrose composition intake except for the control group which deviated slightly from this trend. The trend noticed in the result can be presented as thus: Super high (246 ± 12.45) > High (228.8 ± 12.45) > Medium (211.2 ± 7.87) > Low (202.4 ± 11.13) > Baseline (177.5 ± 6.62) < Control (184.8 ± 5.57).
| Vitamins (mg/ml) | |
|---|---|
| Super | 246 ± 12.45 |
| High | 228.8 ± 12.45 |
| Medium | 211.2 ± 7.87 |
| Low | 202.4 ± 11.13 |
| Baseline | 177.5 ± 6.62 |
| Control | 184.8 ± 5.57 |
Table 5: Serum Vitamin C Levels in sucrose-fed rats.
Discussion
Sugar is a type of carbohydrate which provides energy to the body. However, eating too much sugar over time can lead to weight gain. Strong evidence shows that being above a healthy weight increases the risk of developing cancer and chronic diseases including cardiovascular disease and type 2 diabetes [7]. This study was able to investigate the effect dietary sucrose on the body weight and antioxidant status (vitamin c and uric acid) of wister strain of albino rats.
The effect of dietary sucrose on the body weight of the experimental animals showed that rats in the super high group had the highest average body weight (239.30 ± 11.01) compared to all other experimental groups while rats in the baseline group showed the lowest body weight (184.5 ± 26.73) compared to all other experimental groups. This is suggestive of the fact that the more dietary sucrose the experimental rats consume, the more effect it had on their body weight. This result is in tandem with the report of Libuda, et al. [3]. However, he attributed the increase in body weight of the experimental animals to increase in fat accumulation as a result of increase in sucrose consumption in humans. Similarly, there is coherence between our findings and that of Raben, et al. [5]. He and his team observed that even though the weights of the experimental animals increased upon consuming dietary sucrose, there was no significant difference between the body weights of sucrose fed rats. High-sugar diets contribute to prolonged elevated blood sugar, insulin resistance, and leptin resistance — all of which are linked to weight gain and excess body fat [7].
The effect of varying sucrose diets on serum uric acid of the experimental rats in this study showed that uric acid concentration of the experimental rats in the six groups is directly proportional to their sucrose composition intake.
There was a progressive increase in uric acid concentration of the rats across the experimental groups as their sucrose composition intake increased. This observation points to the fact that there is direct correlation between increase in dietary sucrose intake and elevation of uric acid concentration. This observation is consistent with the findings of Kaya, et al. [12]. Sucrose is a disaccharide made up of fructose and glucose, and it is well known that fructose enhances adenine nucleotide degradation, leading to an increase in the plasma concentration of uric acid [12]. Furthermore, it has been reported that as the rate of fructose infusion increases, the serum concentration of urate is also increased [13].
The effect of dietary sucrose on vitamin C concentration of the six groups of experimental animals revealed that vitamin C concentration decreased progressively across the groups as the amount of sucrose in their feed decreased. However, the rats in the control group experienced an increase in vitamin C concentration compared to rats in the baseline group. This is suggestive of the fact that increase in dietary sucrose consumption has significant effect on the concentration of vitamin C. The finding of this study could be attributed to the glucose moiety of sucrose which has a similar structure to that of vitamins C and also uses the same receptors as vitamin C to enter the cell membrane, so eating a lot of sucrose would mean that less vitamin C will be absorbed into the cell membrane because the receptors are already in use [9, 17, 18, 19, 20].
Conclusion
The findings of this research work clearly demonstrate that sucrose consumption has a significant effect on Uric acid and Vitamin C. Since serum vitamin C and uric acid are important factors to be considered as far as arteriosclerosis, coronary heart diseases, gout and hyperuricemia; among other conditions are concerned. Sucrose consumption at very high levels can be said to predispose the subject to the aforementioned conditions. No significant difference was observed in the body weight of the rats used for this study when sucrose consumption was increased. Yet care must be taken because the results clearly indicate a strong detriment effect of sucrose on the cardiovascular well-being of the subjects.
References
-
Pereira M (2006) The possible role of sugar-sweetened beverages in obesity etiology: a review of the evidence. Int J Obes 30(S3): S28-S36.
-
West JA, de Looy AE (2001) Weight loss in overweight subjects following low-sucrose or sucrose-containing diets. Int J Obes Relat Metab Disord 25(8): 1122-1128.
-
Libuda L, Alexy U, Sichert-Hellert W, Stehle P, Karaolis- Danckert N, et al. (2008) Pattern of beverage consumption and long-term association with body-weight status in German adolescents – results from the Donald study. Br J Nutr 99(6): 1370-1379.
-
Tatah S, Shadrach P, Abah M (2024) Nutritional and Biochemical Analysis of Locally Produced Wine from a Blend of Banana (Musa sapientum) and Date Palm Fruit (Phoenix dactylifera L.). Asian Journal of Science Technology Engineering and Art 2(3): 444-461.
-
Raben A, Vasilaras TH, Moller AC, Astrup A (2002) Sucrose compared with artificial sweeteners: different effects on ad libitum food intake and body weight after 10 weeks of supplementation in overweight subjects. Am J Clin Nutr 76(4): 721-729.
-
Davis JN, Alexander KE, Ventura EE, Kelly LA, Lane CJ, et al. (2007) Associations of dietary sugar and glycemic index with adiposity and insulin dynamics in overweight latino youth. Am J Clin Nutr 86: 1331-1338.
-
Doria A, Patti ME, Kahn C.R (2008) The emerging genetic architecture of type 2 diabetes. Cell Metab 8: 186-200.
-
D’Souza AM, Johnson JD, Clee SM, Kieffer TJ (2016) Suppressing hyperinsulinemia prevents obesity but causes rapid onset of diabetes in leptin-deficient Lepob/ ob mice. Molecular metabolism 5(11): 1103-1112.
-
Padayatty SJ, Levine M (2016) Vitamin C: the known and the unknown and Goldilocks. Oral Dis 22(6): 463-493.
-
Minor EA, Court BL, Young JI, Wang G (2013) Ascorbate induces ten-eleven translocation (Tet) methylcytosine dioxygenase-mediated generation of 5-hydroxymethylcytosine. J Biol Chem 288(19): 13669- 13674.
-
Macknight RC, Laing WA, Bulley SM, Broad RC, Johnson AA, et al. (2017) Increasing ascorbate levels in crops to enhance human nutrition and plant abiotic stress tolerance. Curr Opin Biotechnol 44: 153-160.
-
Kaya M, Moriwaki Y, Ka T, Inokuchi T, Yamamoto A, et al. (2006). Plasma concentrations and urinary excretion of purine bases (uric acid, hypoxanthine, and xanthine) and oxypurinol after rigorous exercise. Metabolism 55: 103 - 107.
-
Choi HK, Mount DB, Reginato AM (2005) American College of Physicians, American Physiological Society. Pathogenesis of gout. Ann Intern Med 143(7): 499-516.
-
Burke SJ, Batdorf HM, Burk DH, Noland RC, Eder AE, et al. (2017) db/db Mice Exhibit Features of Human Type 2 Diabetes That Are Not Present in Weight-Matched C57BL/6J Mice Fed a Western Diet. Journal of diabetes research 2017: 8503754.
-
Kobi JBBS, Matias AM, Gasparini PVF, Torezani-Sales S, Madureira AR, et al. (2023) High-fat, high-sucrose, and combined high-fat/high-sucrose diets effects in oxidative stress and inflammation in male rats under presence or absence of obesity. Physiol Rep 11(7): e15635.
-
Barr WG (1990) UricAcid. In: Walker HK, et al. (Eds.), Clinical Methods: The History, Physical, and Laboratory Examinations. 3rd (Edn.), Butterworths, Boston, London.
-
Adebisi AK, Abah MA, Ugwuoke, KC, Dooshima AM, Ndoma OR, et al. (2024) Comparative Study on the Proximate Composition and Amino Acid Levels in Chanterelle (Cantharellus cibarius) and Wood Ear (Auricularia auricula) Mushroom Samples. Journal of Multidisciplinary Science: MIKAILALSYS 2(3): 561-574.
-
Bray GA (2013) Energy and fructose from beverages sweetened with sugar or high-fructose corn syrup pose a health risk for some people. Advances in nutrition 4: 220-225.
-
Eldin HI, Mohamed AM, Elnoor AA, Omer EA, Ahmed MA (2017) Comparison of Two Methods for the Determination of Vitamin C (Ascorbic Acid) in Some Fruits. American Journal of Chemistry 2(1): 1-7.
-
Stanhope KL (2016) Sugar consumption, metabolic disease and obesity: The state of the controversy. Crit Rev Clin Lab Sci 53(1): 52-67.
- The Role of Podocyte Apoptosis and the Involvement of SIRT1 in Diabetic Nephropathy
- Dealcoholization of Beer by Osmotic Distillation for the Beverage Industry
- Biopolymer-Based Edible Packaging- Biomaterials, Methods, and Applications in Food Industry: An Updated Review
- Influence of Bioprocessing Methods on 'China Rice' (Gawal R1), and Soyabean Supplementation on the Quality of Complementary Food
- Cassava (Manihot esculenta) Varietal Growth, Yield and Cyanide Content Performance in Three Sites in the South- Eastern Semi Arid Regions of Kenya
- Food Waste Treatment, Recycling, Management and Production of Value-Products-An Update on Methodologies and Current Trends