Antioxidant Activity of Biofield Energy Healing (The Trivedi Effect®) Based Formulation in Sprague Dawley Rats
The aim of the present study was to investigate the antioxidant activity of Consciousness Energy Healing (The Trivedi Effect based novel proprietary formulation in male Sprague Dawley (SD) rats. The formulation was divided into two parts. One part received the Biofield Energy Healing Treatment by renowned Biofield Energy Healer, Mahendra Kumar Trivedi, defined as the Biofield Energy Treated sample. Another part did not receive any treatment and referred as a control. Additionally, three groups of animals were also received Biofield Energy Healing Treatment at day -15 per se. The tissue lipid peroxidation data exhibited that the level of malondialdehyde (MDA) was reduced by 22.75% and 19.57% in the Biofield Energy Treated test formulation (G5) and Biofield Energy Treatment per se plus Biofield Energy Treated test formulation from the day -15 (G8), respectively compared to the disease control group (G2). Antioxidant enzyme like superoxide dismutase (SOD) was significantly increased by 35.35% and 37.53% in the G7 and G8 groups, respectively as compared to the G2 group. Additionally, the level of catalase was significantly (p 0.05) increased by 85.29%, 78.84%, 135.87%, 130.08%, 102.15%, and 66.45% in the G4, G5, G6, G7, G8, G9 groups, respectively compared to the G2 group. Further, hematology data showed that the platelet count was significantly increased by 17.09% and 9.42% in the G6 and G8 groups, respectively as compared to the G2 group. Biochemical results showed that the level of blood urea was reduced by 26.26%, 28.51%, 26.88%, 17.19%, and 18.05% in the G3, G4, G6, G7, and G9, groups respectively compared to the G2 group. The level of uric acid level was significantly reduced by 31.25% in the G6 group, while phosphorus was significantly increased by 20.57% and 33.03% in the G7 and G8 groups, respectively compared to the G2 group. Further, the change in body weight and feed consumption did not suggest any statistical difference, which depicts that the Biofield Energy Treated test formulation was found to be safe. Thus, the Biofield Treated test formulation has shown sigificant antioxidant activity and can be used for autoimmune and inflammatory diseases, stress management and prevention, and act as anti-aging therapy for the improvement of overall health.
Materials and Methods
Chemicals and Reagents
Iron sulfate, copper chloride, cholecalciferol, streptozotocin, cyclophosphamide, and sodium carboxymethyl cellulose were obtained from Sigma Chemical Co. (St. Louis, MO). Nanocurcumin was purchased from Sanat Products Ltd., India. Quercetin dihydrate was procured from Central Drug House Pvt. Ltd., India. Magnesium (II) gluconate and zinc chloride were obtained from TCI, Japan. Sodium selenate and ascorbic acid were procured from Alfa Aesar, USA.
Laboratory Animals
The male Sprague Dawley (SD) rats approximately 200 to 280 gm body weight were obtained from Vivo Bio Tech Ltd., Hyderabad, India. The animals were acclimatized for five days before commencement of experiment. The animals were housed with specified controlled condition (temperature 22 ± 3°C, humidity 30% to 70%, and 12-hour light/12-hour dark cycle) with normal pellet diet (NPD) drinking water ad libitum. The animals used in this experiment were subjected to prior approval of the Institutional Animal Ethics Committee (IAEC) to carrying out the animal experiment.
Study Design
The animals were assigned in nine groups according to their body weight as random basis. Group 1 (G1) was served as a normal control (i.e., vehicle control), and G2 was served as a disease control; both the groups were received 0.5% Na-CMC, while G3 group animals received quercetin dihydrate as positive control (100 mg/kg; p.o.). G4 group animals were received the untreated test formulation, and G5 group received Biofield Energy Treated test formulation at a dose of 624.12 mg/kg. Similarly, G6 animals received Biofield Energy Treatment at day -15 per se; G7 animals received Biofield Energy Treated test formulation at day -15; G8 group defined as Biofield Energy Treated animals + Biofield Energy Treated test formulation at day -15 and G9 group denoted as Biofield Energy Treatment per se to animals plus untreated test formulation.
Biofield Energy Treatment Strategies
The test formulation was divided into two parts. One part of each ingredient was considered as control, where no Biofield Energy Treatment was provided. Another part of each ingredient was received Biofield Energy Treatment by Mr. Mahendra Kumar Trivedi (known as The Trivedi Effect®) under laboratory conditions for ~3 minutes. Besides, three groups of animals were also received the Biofield Energy Treatment under laboratory conditions for ~3 minutes. The energy transmission was done without touching the samples or animals. Similarly, the control samples were subjected to “sham” healer under the same laboratory conditions for 5 minutes. The sham healer did not have any knowledge about the Biofield Energy Treatment. After that, the Biofield Energy Treated samples were kept in the similar sealed condition and used as per the study plan. The Biofield Energy Treated animals were also is taken back to the experimental room for further proceedings.
Experimental Procedure
Five days after acclimatization, animals were randomized and grouped based on their body weight. After 15 days pre-study period, G6 group was received vehicle; while G7 and G8 groups were received the test formulation. The animals were fasted for 15 – 18 hours and were injected with streptozotocin (STZ 45 mg/kg, i.p. single dose). After one week of post-STZ injection, basal glucose levels (tail cut method) were measured for confirmation of diabetes (day 1). The animals were treated with test formulation/vehicle/standard daily for up to 56 days. Body weight was recorded daily throughout the experiment, and feed consumption was measured weekly once throughout the experimental period. On day 56, 50% of the animal population was kept for overnight fasting and day 57 animals were bled and the samples were subjected to hematology, biochemistry, and electrolytes analysis. After bleeding, animals were humanely sacrificed to collect organ, i.e., liver. A portion of liver samples was weighed and transferred to the prescribed homogenizing buffer. Liver was homogenized and stored in -80°C for the estimation of various anti- oxidant parameters (LPO, SOD, and Catalase) using commercially available kit.
Antioxidant Assay Using ELISA Method
Tissue (liver) Lipid Peroxidation
Measurement of thiobarbituric acid reactive species (TBARS) levels was considered as an index of malondialdehyde (MDA) production [36]. The details methodology is based on the formation of MDA as an end product of lipid peroxidation, which reacts with TBARS a pink chromogen was produced, which was measured spectrophotometrically at 532 nm. An MDA standard was run to construct a standard curve against which readings of the samples were plotted [37]. Estimation of Enzymic antioxidants - Superoxide dismutase (SOD) and Catalase (CAT) The liver homogenate was used as a matrix for the estimation of antioxidant enzymes by a colorimetric method with slight modification for SOD [38] and CAT [39]. Briefly, the formation of chromic acetate from dichromate and glacial acetic acid in the presence of hydrogen peroxide was measures colorimetrically at 570 nm. One enzyme unit was represented as the amount of enzyme that catalysed the oxidation of 1 μM H2O2 per minute under assay conditions [40].
Hematological and Biochemical Parameters
| (Abbott Model-CD-3700) [41]. | The heparinized blood was | |
|---|---|---|
| subjected for the estimation of hematological parameters | ||
| viz. | platelets, red blood cell count (RBC), hemoglobin |
Determination of Body Weight and Feed Intake
The body weight and feed intake were measured once daily before the test item administration throughout the experiment. In brief, the daily feed intake was calculated from the difference between the weight of daily feed supply and the left-over feed was taken as the daily feed intake [42].
Clinical Sign and Symptoms
The clinical signs and symptoms were recorded daily in all the groups as per in-house standard protocol throughout the experiment. Animals found in a moribund condition or severe distress was humanely euthanized [43].
Statistical Analysis
Sigma-plot (v11.0) statistical software was used for statistical analysis. Data are shown as mean ± standard error of mean (SEM) and analyzed by one-way ANOVA and Student’s t-test; p≤0.05 was considered statistically significant.
Results and Discussion
Measurement of Tissue Lipid Peroxidation
The effect of the test formulation on the lipid peroxidation in the liver tissue is shown in Figure 1. From the Figure 1, it was observed that the tissue (liver) lipid peroxidation level of the TBARS significantly (p≤0.001) increased by 193.83% in the disease control group (G2) compared to the normal control group (G1). Positive control group (G3) data showed reduction of MDA level compared to the G2 group. Further, the level of MDA was reduced by 22.75% and 19.57% in the Biofield Energy Treated test formulation (G5) and Biofield Energy Treatment per se plus Biofield Energy Treated test formulation from day -15 (G8), respectively compared to the G2 group. Moreover, MDA level was reduced by 17.85% and 14.48% in the G5 and G8 groups, respectively compare to the untreated test formulation (G4) group (Figure 1). According to Hassan, et al. [44] the increased levels of TBARS could be a tumour burden in the disease control group induced by streptozotocin [44]. After post- treatment with the nanocurcumin based formulation the level of lipid peroxidation end product malondialdehyde (MDA) was significantly reduced in the Biofield Energy Treatment groups compared to the disease control group, which could be due to The Trivedi Effect® - Consciousness Energy Healing Treatment attributed to the scavenging of the reactive free radicals involved in the peroxidation [45].
![Figure 1: From the Figure 1, it was observed that the tissue (liver) lipid peroxidation level of the TBARS significantly (_p_≤0.001) increased by 193.83% in the disease control group (G2) compared to the normal control group (G1). Positive control group (G3) data showed reduction of MDA level compared to the G2 group. Further, the level of MDA was reduced by 22.75% and 19.57% in the Biofield Energy Treated test formulation (G5) and Biofield Energy Treatment _per se_ plus Biofield Energy Treated test formulation from day -15 (G8), respectively compared to the G2 group. Moreover, MDA level was reduced by 17.85% and 14.48% in the G5 and G8 groups, respectively compare to the untreated test formulation (G4) group (Figure 1). According to Hassan, et al. [44] the increased levels of TBARS could be a tumour burden in the disease control group induced by streptozotocin [44]. After post- treatment with the nanocurcumin based formulation the level of lipid peroxidation end product malondialdehyde (MDA) was significantly reduced in the Biofield Energy Treatment groups compared to the disease control group, which could be due to The Trivedi Effect® - Consciousness Energy Healing Treatment attributed to the scavenging of the reactive free radicals involved in the peroxidation [45].](/fulltextimages/3710/fig_1.png)
Figure 1: Lipid peroxide activity of the test formulation after 56 days of treatment in male Sprague Dawley rats. Data are shown as mean ± SEM, n=10 in each group. G: Group; G1: Normal control; G2: Disease control; G3: Positive control (Quercetin dihydrate); G4: Untreated test formulation; G5: Biofield Energy Treated test formulation; G6: Biofield Energy Treatment per se to animals from day -15; G7: Biofield Energy Treated test formulation from day -15; G8: Biofield Energy Treatment per se plus Biofield Energy Treated test formulation from day -15 and G9: Biofield Energy Treatment per se animals plus Untreated test formulation. ***p≤0.001 vs. G1.
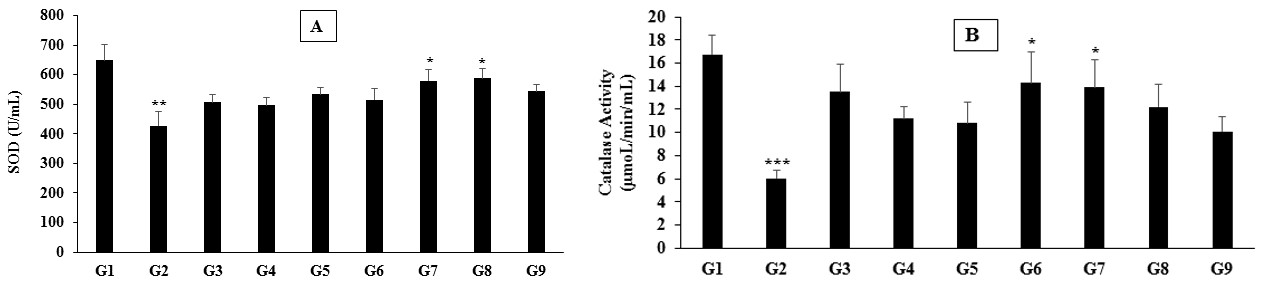
Estimation of Enzymic antioxidants - Superoxide dismutase (SOD) and Catalase (CAT)
The effect of the test formulation on the enzymic antioxidant level in the liver tissue is shown in Figure 2A and 2B. The level of SOD was significantly (p≤0.01) reduced by 34.15% in the G2 group compared to the G1 group. However, the SOD level was increased by 18.43% in the positive control group (G3) compare to the G2 group. Further, SOD level was significantly increased by 35.35% and 37.53% in the G7 and G8 groups, respectively compared to the G2 group. Additionally, the level of SOD was significantly increased by 16.69%, 18.56%, and 9.52% in the G7, G8, and G9 groups, respectively compared to the G4 group (Figure 2A).
Besides, the level of catalase was significantly (p≤0.001) reduced by 63.92% in the G2 group compared to the G1 group. The positive control group showed 123.64% increased of catalase enzyme compared to the G2 group. Further, the catalase level was significantly (p≤0.05) increased by 85.29%, 78.84%, 135.87%, 130.08%, 102.15%, and 66.45% in the G4, G5, G6, G7, G8,
27.31%, and 24.17% in the G6, and G7 groups, respectively compared to the G4 group (Figure 2A).
Hematological Analysis
The hematological parameters after treatment with the test formulation is shown in Table 1. The platelet count was increased by 6.32% in the quercetin group (G3) compared to the G2. The platelet count was significantly increased by 17.09% and 9.42% in the G6 and G8 groups, respectively concerning the disease control group (G2). It was indicated that the Biofield Energy Treatment per se group improved platelets counts than untreated test formulation; which might be due to the Consciousness Energy Healing Treatment. Additionally, level of hemoglobin was increased by 8.94% in the G5 group compared to the G2 group. Rest of the parameters such as MCH, PCV, RBC, MCV, MCHC, and RDW-CV were altered minimally than G2 group.
| Group | RBC | Hb | PCV | MCV | MCH | MCHC | Platelet Count | RDW-CV | ||||||||||||||
|---|---|---|---|---|---|---|---|---|---|---|---|---|---|---|---|---|---|---|---|---|---|---|
| (106/𝜇L) | (gm/dL) | (%) | (fl) | (pg) | (%) | (thou/mm3) | ||||||||||||||||
| G1 | 10.28 ± 0.28 | 17.58 ± 0.39 | 55.86 ± 1.07 | 54.59 ± 0.69 | 17.16 ± 0.41 | 31.49 ± 0.54 | 1012.90 ± 71.06 | 0.14 ± 0.01 | ||||||||||||||
| G2 | 10.16 ± 0.33 | 17.68 ± 0.71 | 56.38 ± 2.65 | 55.39 ± 1.31 | 17.36 ± 0.31 | 31.44 ± 0.61 | 765.13 ± 71.06 | 0.16 ± 0.00 | ||||||||||||||
| G3 | 10.34 ± 0.34 | 17.88 ± 0.39 | 54.48 ± 1.20 | 52.84 ± 0.72 | 17.33 ± 0.36 | 32.80 ± 0.44 | 813.50 ± 70.31 | 0.14 ± 0.00 | ||||||||||||||
| G4 | 10.75 ± 0.37 | 18.36 ± 0.25 | 56.58 ± 1.82 | 52.83 ± 1.11 | 17.12 ± 0.41 | 32.44 ± 0.23 | 865.00 ± 41.99 | 0.15 ± 0.00 | ||||||||||||||
| G5 | 10.71 ± 0.35 | 19.26 ± 0.65 | 59.00 ± 1.99 | 55.14 ± 0.71 | 17.98 ± 0.33 | 32.64 ± 0.33 | 791.38 ± 46.26 | 0.15 ± 0.00 | ||||||||||||||
| G6 | 10.34 ± 0.44 | 17.56 ± 0.47 | 54.14 ± 1.46 | 52.64 ± 1.19 | 17.07 ± 0.60 | 32.44 ± 0.63 | 895.86 ± 98.34 | 0.14 ± 0.00 | ||||||||||||||
| G7 | 10.71 ± 0.26 | 18.77 ± 0.44 | 59.99 ± 1.32 | 56.24 ± 1.68 | 17.51 ± 0.22 | 31.29 ± 0.60 | 787.43 ± 76.75 | 0.15 ± 0.01 | ||||||||||||||
| G8 | 10.70 ± 0.34 | 18.54 ± 0.44 | 58.70 ± 1.21 | 55.06 ± 0.83 | 17.33 ± 0.28 | 31.52 ± 0.36 | 837.22 ± 76.6 | 0.15 ± 0.01 | ||||||||||||||
| G9 | 10.50 ± 0.36 | 18.57 ± 0.46 | 56.50 ± 1.78 | 53.88 ± 0.56 | 17.72 ± 0.29 | 32.90 ± 0.29 | 783.22 ± 68.31 | 0.14 ± 0.00 |
Table 2: Determination of hematology parameters after treatment with the test formulation in Sprague Dawley rats.
Biochemical Analysis
The biochemical parameters after treatment of the test formulation is shown in Table 2. The level of blood urea phosphorus and decreased blood urea and uric acid in the Biofield Energy Treated group compared to the G2 group.
| Group | M | agnesium | Blood Urea | Creatinine | Uric Acid | Calcium | Phosphorus | Na+ (Meq/L) | K+ | Cl- | |||||||||||||||
|---|---|---|---|---|---|---|---|---|---|---|---|---|---|---|---|---|---|---|---|---|---|---|---|---|---|
| (mg/dL) | (mg/dL) | (mg/dL) | (mg/dL) | (mg/dL) | (mg/dL) | (mEq/L) | (mEq/L) | ||||||||||||||||||
| G1 | 4.93 ± 0.07 | 37.22 ± 1.42 | 0.32 ± 0.02 | 1.32 ± 0.11 | 10.19 ± 0.22 | 7.13 ± 0.21 | 146.96 ± 0.39 | 4.62 ± 0.01 | 108.13 ± 1.01 | ||||||||||||||||
| G2 | 5.13 ± 0.16 | 164.41 ± 1.83 | 0.22 ± 0.02 | 1.76 ± 0.13 | 8.96 ± 0.44 | 6.66 ± 0.64 | 144.86 ± 0.46 | 4.68 ± 0.06 | 107.76 ± 1.27 | ||||||||||||||||
| G3 | 5.09 ± 0.16 | 121.24 ± 2.24 | 0.29 ± 0.06 | 2.31 ± 0.12 | 9.39 ± 0.32 | 7.21 ± 0.32 | 146.29 ± 0.94 | 4.88 ± 0.11 | 107.55 ± 1.81 | ||||||||||||||||
| G4 | 4.96 ± 0.21 | 117.53 ± 0.66 | 0.24 ± 0.02 | 1.54 ± 0. 16 | 8.89 ± 0.36 | 6.13 ± 0.36 | 146.89 ± 0.86 | 4.69 ± 0.07 | 107.62 ± 1.15 | ||||||||||||||||
| G5 | 5.03 ± 0.15 | 154.54 ± 1.65 | 0.33 ± 0.05 | 2.06 ± 0.08 | 9.08 ± 0.15 | 7.29 ± 0.59 | 146.29 ± 0.90 | 4.70 ± 0.06 | 107.80 ± 1.32 | ||||||||||||||||
| G6 | 4.66 ± 0.13 | 120.21 ± 1.65 | 0.24 ± 0.04 | 1.21 ± 0.08 | 9.29 ± 0.31 | 6.80 ± 0.36 | 145.57 ± 0.82 | 4.63 ± 0.09 | 107.44 ± 0.68 | ||||||||||||||||
| G7 | 5.00 ± 0.13 | 136.14 ± 1.65 | 0.24 ± 0.02 | 1.73 ± 0.08 | 9.60 ± 0.26 | 8.03 ± 0.40 | 144.73 ± 1.03 | 4.54 ± 0.04 | 107.30 ± 1.15 | ||||||||||||||||
| G8 | 5.04 ± 0.11 | 163.56 ± 1.65 | 0.26 ± 0.04 | 2.18 ± 0.08 | 9.37 ± 0.24 | 8.86 ± 0.75 | 146.24 ± 0.65 | 4.67 ± 0.05 | 108.56 ± 0.34 | ||||||||||||||||
| G9 | 4.83 ± 0.17 | 134.74 ± 1.65 | 0.27 ± 0.03 | 1.58 ± 0.08 | 9.36 ± 0.13 | 6.58 ± 0.59 | 145.33 ± 0.74 | 4.61 ± 0.06 | 108.43 ± 0.34 |
Table 3: Estimation of biochemical parameters after the treatment with the test formulation in experimental rats.
Table 2: Estimation of biochemical parameters after the treatment with the test formulation in experimental rats. Data are assigned as the mean ± SEM (n=10). G1: Group The results of body weight and feed intake are presented as mean values throughout the study period in Table 3. There was no changes were observed in the body weight and feed intake in all the groups. The feed intake was gradually increased in across to all the groups throughout the experiment as shown in Table 3. These findings suggest that there were no significant changes observed regarding body weight as well as feed intake and the test formulation was found to be safe.
| Group | Body Weight (g) | Feed Intake (g) | ||||||||||
|---|---|---|---|---|---|---|---|---|---|---|---|---|
| Initial | Final | Initial | Final | |||||||||
| G1 | 283.49 ± 4.39 | 498.36 ± 12.53 | 34.83 ± 1.15 | 31.67 ± 1.00 | ||||||||
| G2 | 285.37 ± 6.02 | 261.41 ± 19.06 | 40.97 ± 0.65 | 43.66 ± 0.99 | ||||||||
| G3 | 285.51 ± 5.99 | 282.90 ± 25.33 | 42.84 ± 0.61 | 41.91 ± 1.02 | ||||||||
| G4 | 284.65 ± 5.25 | 304.34 ± 10.12 | 40.46 ± 0.70 | 43.89 ± 1.45 | ||||||||
| G5 | 282.80 ± 4.95 | 282.75 ± 17.98 | 38.66 ± 0.78 | 44.53 ± 2.04 | ||||||||
| G6 | 285.71 ± 4.19 | 334.08 ± 15.03 | 39.50 ± 0.58 | 41.32 ± 2.75 | ||||||||
| G7 | 280.95 ± 5.06 | 296.10 ± 21.56 | 40.94 ± 0.56 | 43.51 ± 1.61 | ||||||||
| G8 | 282.82 ± 6.25 | 268.24 ± 16.09 | 39.87 ± 0.60 | 41.55 ± 1.69 | ||||||||
| G9 | 280.64 ± 5.61 | 297.97 ± 10.36 | 39.97 ± 0.56 | 40.44 ± 1.78 |
Table 4: The effect of the test formulation on body weight and feed intake in male Sprague Dawley rats.
Table 3: The effect of the test formulation on body weight and feed intake in male Sprague Dawley rats. Data are assigned as mean ± SEM (n=10). G: Group The National Center for Complementary/Alternative Medicine (NCCAM,) reported that about 34% U.S. populations depend on some forms of complementary health approach, among which energy medicine is one of them. Complementary and alternative medicine has huge positive aspect as compared to the conventional treatment strategy [46]. Another report suggested that multivitamin/mineral (MVMM) supplements are the most common dietary supplements consumed about 51% in the United States [47]. Overall data suggest that the novel formulation could be immunomodulatory, antioxidant, and anti-inflammatory effect and might produce as a better immunomodulatory medicine in the near future.
Conclusions
Results of the study revealed that the lipid peroxidation end point product, malondialdehyde (MDA) level was significantly reduced by 22.75% and 19.57% in the Biofield Energy Treated test formulation (G5) and Biofield Energy Treatment per se plus Biofield Energy Treated test formulation from day -15 (G8) groups, respectively compared to the disease control group (G2). An antioxidant enzyme like superoxide dismutase (SOD) was significantly increased by 35.35% and 37.53% in the G7 and G8 groups, respectively compared to the G2 group. Furthermore, catalase was significantly (p≤0.05)
increased by 85.29%, 78.84%, 135.87%, 130.08%, 102.15%, and 66.45% in the G4, G5, G6, G7, G8, G9 groups, respectively compared to the G2 group. The platelet count was significantly increased by 17.09% in the G6 group concerning the G2 group. Blood urea was reduced by 26.26%, 28.51%, 26.88%, 17.19%, and 18.05% in the G3, G4, G6, G7, and G9, groups respectively compared to the G2 group. The level of the uric acid level was significantly reduced by 31.25% in the G6 group compared to the G2 group. However phosphorus was significantly increased by 20.57% and 33.03% in the G7 and G8 groups, respectively than G2. Further, no treatment-related changes were observed in the Biofield Energy Treated groups related to the body weight and feed consumption. Overall, the change in above weight parameters was consistent throughout the study, which suggests that the Biofield Energy Treated test formulation has safe concerning the physiological and metabolic changes. Therefore, the current findings conclude that the Biofield Energy Healing based formulation and The Trivedi Effect® enhanced the antioxidant, anti-inflammatory and immunomodulatory properties in rat model under stress condition. Thus, the novel Biofield Treated test formulation and Biofield Energy Healing per se could be used against different disease conditions viz. rheumatoid arthritis, type 1 diabetes, anemia, asthma, Alzheimer’s disease, hepatitis, Parkinson’s disease, ulcerative colitis, aging, stress, and organ transplant.
Acknowledgements
The authors are grateful to Dabur Research Foundation, Trivedi Science, Trivedi Global, Inc., and Trivedi Master Wellness for their support throughout the work.
References
-
Houston M (2014) The role of nutrition and nutraceutical supplements in the treatment of hypertension. World J Cardiol 6(2): 38-66.
-
Bishop WM, Zubeck HM (2012) Evaluation of microalgae for use as nutraceuticals and nutritional supplements. J Nutr Food Sci 2: 147.
-
Houston M (2013) Nutrition and nutraceutical supplements for the treatment of hypertension: Part I. J Clin Hypertens (Greenwich) 15(12): 752-757.
-
Qureshi NA, Al-Bedah AM (2013) Mood disorders and complementary and alternative medicine: A literature review. Neuropsychiatr Dis Treat 9: 639-658.
-
Anand P, Kunnumakkara AB, Newman RA, Aggarwal BB (2007) Bioavailability of curcumin: Problems and promises. Mol Pharm 4(6): 807-818.
-
Rachmawati H, Al Shaal L, Müller RH, Keck CM (2013) Development of curcumin nanocrystal: Physical aspects. J Pharm Sci 102(1): 204-214.
-
Padayatty SJ, Katz A, Wang Y, Eck P, Kwon O, et al. (2003) Vitamin C as an antioxidant: Evaluation of its role in disease prevention. Am Coll Nutr 22(1): 18-35.
-
Tsutsumi K, Fujikawa H, Kajikawa T, Takedachi M, Yamamoto T, et al. (2012) Effects of L-ascorbic acid 2- phosphate magnesium salt on the properties of human gingival fibroblasts. J Periodontal Res 47(2): 263-271.
-
Shimabukuro Y, Nakayama Y, Ogata Y, Tamazawa K, Shimauchi H, et al. (2015) Effects of an ascorbic acid- derivative dentifrice in patients with gingivitis: A double-masked, randomized, controlled clinical trial. Periodontol 86(1): 27-35.
-
Ritchie CS, Kinane DF (2003) Nutrition, inflammation, and periodontal disease. Nutrition 19(5): 475-476.
-
Nishida M, Grossi SG, Dunford RG, Ho AW, Trevisan M, et al. (2000) Dietary vitamin C and the risk for periodontal disease. J Periodontol 71(8): 1215-1223.
-
Lutgendorf SK, Mullen-Houser E, Russell D, Degeest K, Jacobson G, et al. (2010) Preservation of immune function in cervical cancer patients during chemoradiation using a novel integrative approach. Brain Behav Immu 24(8): 1231-1240.
-
Ironson G, Field T, Scafidi F, Hashimoto M, Kumar M, et al. (1996) Massage therapy is associated with enhancement of the immune system's cytotoxic capacity. Int J Neurosci 84(1-4): 205-217.
-
Jain S, Hammerschlag R, Mills P, Cohen L, Krieger R, et al. (2015) Clinical studies of biofield therapies: Summary, methodological challenges, and recommendations. Glob Adv Health Med 4: 58-66.
-
Rubik B (2002) The biofield hypothesis: Its biophysical basis and role in medicine. J Altern Complement Med 8(6): 703-717.
-
Trivedi MK, Patil S, Shettigar H, Mondal SC, Jana S (2015) The potential impact of biofield treatment on human brain tumor cells: A time-lapse video microscopy. J Integr Oncol 4: 141.
-
Trivedi MK, Patil S, Shettigar H, Gangwar M, Jana S (2015) _In vitro_ evaluation of biofield treatment on cancer biomarkers involved in endometrial and prostate cancer cell lines. J Cancer Sci Ther 7: 253- 257.
-
Trivedi MK, Patil S, Shettigar H, Mondal SC, Jana S (2015) _In vitro_ evaluation of biofield treatment on _Enterobacter_ _cloacae_: Impact on antimicrobial susceptibility and biotype. J Bacteriol Parasitol 6: 241.
-
Trivedi MK, Patil S, Shettigar H, Mondal SC, Jana S (2015) Evaluation of biofield modality on viral load of hepatitis B and C Viruses. J Antivir Antiretrovir 7(3): 083-088.
-
Trivedi MK, Patil S, Shettigar H, Mondal SC, Jana S (2015) An impact of biofield treatment: Antimycobacterial susceptibility potential using BACTEC 460/MGIT-TB System. Mycobact Dis 5: 189.
-
Trivedi MK, Branton A, Trivedi D, Nayak G, Mondal SC, et al. (2015) Antimicrobial sensitivity, biochemical characteristics and biotyping of _Staphylococcus_ _saprophyticus_: An impact of biofield energy treatment. J Women’s Health Care 4: 271.
-
Trivedi MK, Branton A, Trivedi D, Nayak G, Mondal SC, et al. (2015) Evaluation of antibiogram, genotype and phylogenetic analysis of biofield treated _Nocardia_ _otitidis_. Biol Syst Open Access 4(2): 143.
-
Trivedi MK, Branton A, Trivedi D, Nayak G, Charan S, et al. (2015) Phenotyping and 16S rDNA analysis after biofield treatment on _Citrobacter braakii_: A urinary pathogen. J Clin Med Genom 3: 129.
-
Trivedi MK, Patil S, Shettigar H, Bairwa K, Jana S (2015) Spectroscopic characterization of chloramphenicol and tetracycline: An impact of biofield. Pharm Anal Acta 6: 395.
-
Trivedi MK, Patil S, Shettigar H, Bairwa K, Jana S (2015) Spectroscopic characterization of biofield treated metronidazole and tinidazole. Med Chem 5: 340-344.
-
Trivedi MK, Patil S, Shettigar H, Bairwa K, Jana S (2015) Effect of biofield treatment on spectral properties of paracetamol and piroxicam. Chem Sci J 6: 98.
-
Trivedi MK, Branton A, Trivedi D, Shettigar H, Bairwa K, et al. (2015) Fourier transform infrared and ultraviolet-visible spectroscopic characterization of biofield treated salicylic acid and sparfloxacin. Nat Prod Chem Res 3: 186.
-
Trivedi MK, Branton A, Trivedi D, Nayak G, Gangwar M, et al. (2016) Molecular analysis of biofield treated eggplant and watermelon crops. Adv Crop Sci Tech 4(1): 208.
-
Trivedi MK, Branton A, Trivedi D, Nayak G, Mondal SC, et al. (2015) Morphological characterization, quality, yield and DNA fingerprinting of biofield energy treated alphonso mango (_Mangifera indica_ L.). J Food Nut Sci 3(6): 245-250.
-
Trivedi MK, Branton A, Trivedi D, Nayak G, Mondal SC. et al. (2015) Evaluation of plant growth, yield and yield attributes of biofield energy treated mustard (_Brassica juncea_) and chick pea (_Cicer arietinum_) seeds. Agri Fores Fishe 4(6): 291-295.
-
Trivedi MK, Branton A, Trivedi D, Nayak G, Mondal SC, et al. (2015) Evaluation of plant growth regulator, immunity and DNA fingerprinting of biofield energy treated mustard seeds (_Brassica juncea_). Agri Fores Fisher 4(6): 269-274.
-
Trivedi MK, Tallapragada RM, Branton A, Trivedi D, Nayak G, et al. (2015) Characterization of physical and structural properties of aluminum carbide powder: Impact of biofield treatment. J Aeronaut Aerospace Eng 4(1): 142.
-
Trivedi MK, Nayak G, Patil S, Tallapragada RM, Latiyal O, et al. (2015) Impact of biofield treatment on atomic and structural characteristics of barium titanate powder. Ind Eng Manage 4: 166.
-
Trivedi MK, Patil S, Nayak G, Jana S, Latiyal O (2015) Influence of biofield treatment on physical, structural and spectral properties of boron nitride. J Material Sci Eng 4: 181.
-
Trivedi MK, Nayak G, Patil S, Tallapragada RM, Latiyal O, et al. (2015) Characterization of physical and structural properties of brass powder after biofield treatment. J Powder Metall Min 4: 134.
-
Uchiyma M, Mihara M (1978) Determination of malondialdehyde precursor in tissues by thiobarbituric acid test. Anal Biochem 86(1): 271- 278.
-
Ohkawa H, Ohishi N, Yagi K (1979) Assay for lipid peroxides in animal tissues by thiobarbituric acid reaction. Anal Biochem 95(2): 351-351.
-
Marklund S, Marklund G (1974) Involvement of the superoxide anion radical in the autoxidation of pyrogallol and a convenient assay for superoxide dismutase. Eur J Biochem 47(3): 469-474.
-
Sinha AK (1972) Colorimetric assay of catalase. Anal Biochem 47(2): 389-394.
-
Noeman SA, Hamooda HE, Baalash AA (2011) Biochemical study of oxidative stress markers in the liver, kidney and heart of high fat diet induced obesity in rats. Diabetol Metab Syndr 34(1): 17.
-
Feldman BF, Zinkl JG, Jain VC (2000) Laboratory techniques for avian hematology. In: Schalm’s Veterinary Hematology, (5th Edn). Lippincott Williams & Wilkins, Toronto, Canada.
-
Beale KEL, Murphy KG, Harrison EK, Kerton AJ, Ghatei MA, et al. (2011) Accurate measurement of body weight and food intake in environmentally enriched male wistar rats. Obesity 19(8): 1715-1721.
-
OECD (1992) OECD Guideline for Testing of Chemicals. 420th (Vol.), Organization for Economic Cooperation and Development, Paris, France.
-
Hassan SK, Mousa AM, Eshak MG, Farrag AERH, Badawi AEFM (2014) Therapeutic and chemopreventive effects of nano curcumin against diethylnitrosamine induced hepatocellular carcinoma in rats. Int J Pharm Pharm Sci 6: 54-62.
-
Wright JS (2002) Predicting the antioxidant activity of curcumin and curcuminoids. J Mol Struct 591(1-3): 207-217.
-
Clarke TC, Black LI, Stussman BJ, Barnes PM, Nahin RL (2015) Trends in the use of complementary health approaches among adults: Unites States, 2002-2012. National Health Statistics Reports 79: 1-6.
-
Wallace TC, McBurney M, Fulgoni VL (2014) Multivitamin/mineral supplement contribution to micronutrient intakes in the United States, 2007- 2010. J Am Coll Nutr 33(2): 94-102.
- An Efficient and Affordable Method for Isolating Bone Marrow- Derived Mesenchymal Stem Cells from Swiss Albino Mice
- Superposition of Cryo-EM and AlphaFold Predictions of Dengue Antigen-Antibody Complexes
- Jugular-Applied Coherent Low-Level Laser Therapy Enhances Systemic Mitochondrial Metabolic Function and Antioxidant Response
- Role of OMC32 Polypeptide in Acrosin-Mediated Exocytosis during the Bovine Sperm Acrosome Reaction
- Association of Galectin-3 but not Laminin in Tamoxifen-Induced Growth Suppression in Breast Cancer MCF-7 Cells
- Effect of Different Wavelengths of Light on the Rate of Photosynthesis