Production and Optimization of Extracellular Lipase Expressed by Aspergillus flavus Isolated from Petroleum-Contaminated Soil
For enhanced production of lipase by a saprotrophic fungal strain: Aspergillus flavus, optimization of selected environmental conditions and fermentation medium were performed using response surface methodology and factorial design. The results from factorial design reveal that agitation, substrate concentration, temperature and pH were the crucial elements affecting the production of lipase. The optimum medium conditions obtained for lipase production using response surface methodology were agitation of 150 rpm, substrate concentration of 2.75% v/v, temperature of 45ºC and pH 8.5. This model was authenticated by replicating the experiment under the established conditions, which led to maximum expression of lipase by the organism to 5.05 U/mg (predicted response 4.91 U/mg), hence substantiating the reliability of the model. Unexplored Aspergillus flavus strain isolated from crude oil contaminated soils was used for this study. This study underscores the capability of Aspergillus flavus, for lipase production and highlights the practicability of response surface methodology for the optimization of environmental conditions and fermentation medium for enhanced production of lipase.
Introduction
The unique role of enzymes in medicine and biotechnological industries has long been established [1]. The presence of distinct secondary metabolites in microorganisms has created novel opportunities for development of diverse industrial processes. Enzymes expressed by different microorganisms have been involved in numerous commercial and industrial applications [2, 3]. Advancement made in this area has led to the successful isolation of numerous valuable microbes from diverse ecological zones with subsequent extraction of beneficial enzymes from them [2, 4].
Amongst the most crucial and prevalent commercially important industrial enzymes, lipases play a huge role because it has numerous application in diverse industries like food processing, leather, textile industries etc. Lipase represents a group of industrially important enzymes commonly known as hydrolases that catalyze the hydrolysis of acyl-glycerides to mono-acylglycerides, di-acylglycerides, fatty acids and glycerol [5] and they have received enormous attention in recent times. Lipases are widely utilized in cosmetic, food, medical, and textile industries for numerous applications because of their vast catalytic activities involving resolution of racemic compositions, trans-esterification, hydrolysis of triglycerides and for the synthesis of esters etc [5, 6, 7]. Numerous organisms have been reported to be potent producers of lipase, however, lipases expressed by microorganisms are of significant value because of their numerous commercial industrial applications in non- aqueous and aqueous systems [8].
Recently researchers have laid more emphasis on optimization (process development) and scale up of enzyme production. As a matter of fact, the ratio of the medium factors plays a significant role in augmenting enzyme production. Ab initio, the one factor at a time strategy is the prevalent statistical method used for medium optimization [9]. This technique, according to Wenster-Botz [10] might lead to data misinterpretation because of the neglect in the interaction between diverse factors in the medium. In addition, the method is also time consuming, tedious and sometimes leads to a partial comprehension of the system behavior with a concomitant lack of predictive ability.
However, the shortcomings and pitfalls of the one factor at a time strategy can be eradicated by applying response surface methodology (RSM) which is utilized to elucidate the mutual interfacial effects all factors present in a fermentation medium [11]. RSM does not deal with experimental methods alone, it also deals with mathematical models and statistical interpretation for exploring and constructing an approximate correlation between sets of design variables and a response variable.
Numerous authors [2, 12, 13, 14] have used statistical methods for the optimization of enzyme production. It is pertinent to note that, no delineated medium has been instituted for optimal production of enzymes from microorganisms. Every microbial isolate has its own distinct cultural and fermentation conditions for enhanced expression of enzymes and other secondary metabolites. The utilization of reliable and efficient statistical method is significant to develop improved techniques in order to maximize products from microorganism [15].
Presently, industrial enzymes are not produced in Nigeria commercially. Consequently, lots of diverse enzymes are imported yearly to satisfy the demand of indigenous industries. The indigenous industrial sectors in Nigeria had increased enormously in the last decade, thus, it is a demand of time to locally produce industrial enzymes to cut down expenses on importation and at the same time boost export earnings. In this study we isolated Aspergillus flavus from crude oil contaminated soil – a distinct ecological zone and evaluated its capacity for lipase expression, optimized cultural conditions for maximum lipase production and produced the lipase using the optimized medium.
Materials and Methods
Microorganisms and Media
The new aspergillus strain: Aspergillus flavus was aseptically isolated from crude oil contaminated soil using standard microbiological techniques and the pure culture was preserved in bijou bottles at 4°C. Nutrient broth medium containing peptone 5 g, yeast extract 5 g, glucose 10 g, K2HPO4 (3g), Na2SO4 (2g), MgSO4.7H2O (0.1g) and olive oil (3 mL) was utilized for lipase production from the selected strain. The medium was autoclaved for 15 min at 121°C.
Production of Lipase
Exactly 1 mL of the inoculum of Aspergillus flavus was aseptically inoculated into two 500 mL of the autoclaved nutrient broth and was incubated for 72 h at 35°C. Afterwards, the broth was centrifuged to remove viable cells at 3000 rpm for 10 min to obtain the crude lipase enzyme. The supernatant containing the enzyme was assayed for lipase activity.
Enzyme Activity
Lipase activity was determined by the technique described by Plou, et al. [16] with slight modification. Lipase activity was assayed with Tween 80 as the substrate and measured spectrophotometerically at 450 nm. The reaction mixture contained 800 µL of 1 % (v/v) Tween 80 in 20 mM Tris-HCl (pH 8.5) and 200 µL of the enzyme source. The initial absorbance was recorded immediately at 450 nm and the hydrolysis rate of Tween 80 was monitored by recording the change in absorbance after 5 min.
Experimental Design
The medium conditions and constituents: inoculum size, agitation, temperature, pH, incubation time, substrate concentration, yeast extract, Na2SO4, NaCl, KH2PO4 and peptone were considered and screened with regards to their effects on lipase production by Aspergillus flavus using the Plackett and Burman strategy as described by Venil and Lakshmanaperumalsamy [2]. The components of the medium were monitored for ten variables at two levels, minimum (-) and maximum (+). The media was randomly formulated according to the design and lipase activity was determined as described in section 2.3. Response was premeditated at the frequency of lipase expression and reported as U/mg. The effect of each variable was extrapolated as reported by Venil and Lakshmanaperumalsamy [2].
Response Surface Methodology
Response surface methodology (RSM) is an empirical numerical modelling method used for multiple regression analysis by utilizing the results obtained from the factorial design to simultaneously resolve multi-variable equations [17]. The components of the medium that was observed to affect the production of enzyme were further optimized using central composite design (CCD). The levels of four selected independent variables namely Substrate concentration (A), pH (B), temperature (C), and agitation (D). The interactions and first and higher-order interfacial influence of the selected variables were investigated using the CCD. The contour plots and polynomial equation were generated using statistical software package Design
Expert® version 11.
Model Validation
The model was corroborated for lipase production by performing check point studies. The experiments were replicated under the conditions predicted by the model. Samples were harvested at the established intervals and lipase assay was evaluated as demonstrated in section 2.3.
Statistical Analysis
Design expert software was used for all surface plots while Mini tab was used for factorial design.
Results and Discussion
The effect of ten selected medium conditions and factors namely: inoculum size, agitation, temperature, pH, incubation time, yeast extract, Na2SO4, substrate concentration, NaCl, KH2PO4 and peptone in lipase production was examined in twelve runs by employing the Plackett and Burman strategy. The results in (Table 1) shows the experimental design for the ten variables and the resultant responses. Discrepancies varying from 1.78 U/mg to 4.79 U/mg was observed in lipase activity in the 12 trials.
| Run | pH | Temp. (ºC) | agitation | Sub conc | Yeast extract (mg/L) | Incubation time (hr) | Inoculum size | Na SO 2 4 | KH PO 2 4 | peptone | Lipase activity (U/mg) |
|---|---|---|---|---|---|---|---|---|---|---|---|
| 1 | 6 | 30 | 150 | 4 | 8 | 48 | 8 | 0.8 | 0.2 | 8 | 4.79 |
| 2 | 11 | 60 | 50 | 4 | 8 | 48 | 8 | 0.2 | 0.2 | 2 | 4.17 |
| 3 | 6 | 30 | 50 | 1.5 | 2 | 48 | 2 | 0.2 | 0.2 | 2 | 2.06 |
| 4 | 11 | 30 | 150 | 4 | 2 | 96 | 2 | 0.2 | 0.2 | 8 | 2.34 |
| 5 | 6 | 60 | 150 | 4 | 2 | 96 | 8 | 0.2 | 0.8 | 2 | 3.98 |
| 6 | 6 | 60 | 150 | 1.5 | 8 | 48 | 2 | 0.2 | 0.8 | 8 | 3.33 |
| 7 | 11 | 60 | 150 | 1.5 | 8 | 96 | 2 | 0.8 | 0.2 | 2 | 4.78 |
| 8 | 6 | 60 | 50 | 1.5 | 2 | 96 | 8 | 0.8 | 0.2 | 8 | 3.76 |
| 9 | 11 | 30 | 150 | 1.5 | 2 | 48 | 8 | 0.8 | 0.8 | 2 | 1.78 |
| 10 | 6 | 30 | 50 | 4 | 8 | 96 | 2 | 0.8 | 0.8 | 2 | 3.76 |
| 11 | 11 | 60 | 50 | 4 | 2 | 48 | 2 | 0.8 | 0.8 | 8 | 4.59 |
| 12 | 11 | 30 | 50 | 1.5 | 8 | 96 | 8 | 0.2 | 0.8 | 8 | 4.67 |
Table 1: Factors influencing lipase expression by Aspergillus flavus.
Amongst the screened variables, the efficient factors: agitation, substrate concentration, temperature and pH with high significance level were selected for optimization. With reference to the Plackett and Burman design, the statistical analysis showed that the model was significant. Accordingly, the statistically significant variables namely agitation, substrate concentration, temperature and pH from the results were optimized using central composite design in order to establish their optimum. The data for the central composite design for the four variables are demonstrated in Table 2.
| Std | Run | A:Substrate conc. (%) | B:pH | C:Temperature | D:Agitation (rpm) | Actual Lipase activity (U/mg) | Predicted Lipase activity (U/mg) |
|---|---|---|---|---|---|---|---|
| 1 | 1 | 1.5 | 6 | 45 | 150 | 2 | 2.26 |
| 26 | 2 | 2.75 | 8.5 | 45 | 150 | 4.98 | 4.91 |
| 22 | 3 | 2.75 | 11 | 45 | 50 | 1.53 | 1.61 |
| 23 | 4 | 2.75 | 6 | 45 | 250 | 2.22 | 2.14 |
| 19 | 5 | 1.5 | 8.5 | 60 | 150 | 3.05 | 3.17 |
| 3 | 6 | 1.5 | 11 | 45 | 150 | 3.81 | 3.86 |
| 7 | 7 | 2.75 | 8.5 | 30 | 250 | 4.19 | 4.06 |
| 28 | 8 | 2.75 | 8.5 | 45 | 150 | 5.05 | 4.91 |
| 4 | 9 | 4 | 11 | 45 | 150 | 3.47 | 3.19 |
| 17 | 10 | 1.5 | 8.5 | 30 | 150 | 4.11 | 4.03 |
| 14 | 11 | 2.75 | 11 | 30 | 150 | 3.75 | 3.95 |
| 13 | 12 | 2.75 | 6 | 30 | 150 | 3.44 | 3.56 |
| 16 | 13 | 2.75 | 11 | 60 | 150 | 4.2 | 4.12 |
| 20 | 14 | 4 | 8.5 | 60 | 150 | 3.65 | 3.72 |
| 29 | 15 | 2.75 | 8.5 | 45 | 150 | 5.05 | 4.91 |
| 5 | 16 | 2.75 | 8.5 | 30 | 50 | 2.36 | 2.38 |
| 9 | 17 | 1.5 | 8.5 | 45 | 50 | 2.18 | 1.92 |
| 8 | 18 | 2.75 | 8.5 | 60 | 250 | 3.51 | 3.47 |
| 6 | 19 | 2.75 | 8.5 | 60 | 50 | 2.19 | 2.29 |
| 15 | 20 | 2.75 | 6 | 60 | 150 | 2.88 | 2.71 |
| 21 | 21 | 2.75 | 6 | 45 | 50 | 2.02 | 1.97 |
| 25 | 22 | 2.75 | 8.5 | 45 | 150 | 5.05 | 4.91 |
| 11 | 23 | 1.5 | 8.5 | 45 | 250 | 3.21 | 3.13 |
| 27 | 24 | 2.75 | 8.5 | 45 | 150 | 4.44 | 4.91 |
| 2 | 25 | 4 | 6 | 45 | 150 | 3.06 | 2.99 |
| 10 | 26 | 4 | 8.5 | 45 | 50 | 1.62 | 1.73 |
| 24 | 27 | 2.75 | 11 | 45 | 250 | 4.26 | 4.3 |
| 18 | 28 | 4 | 8.5 | 30 | 150 | 3.68 | 3.55 |
| 12 | 29 | 4 | 8.5 | 45 | 250 | 3.08 | 3.38 |
Table 2: Experimental design for optimization of lipase expressed by Aspergillus flavus.
Furthermore, regression analysis was carried out on the results and a polynomial equation was obtained demonstrating that the production of lipase is reliant on the independent variables. The regression model given as: Y = 4.91 + 0.0167 xA+0.4500xB-0.1708x C+0.7142x D-0.3500xAB+0.2575x AC+0.1075xAD+0.2525xBC+0.6325x BD-0.1275xCD-0.9032x A²-0.9382x B²-0.3920x C²-1.47x D² Y is the response value (lipase activity) and A, B, C and D were used to represent substrate concentration, pH, temperature and agitation respectively. The obtained equation could be utilized to predict the response during enzyme production. The appropriateness of the model was evaluated through analysis of variance (ANOVA) and the data are demonstrated in Table 3. Results from the ANOVA of the quadratic model revealed that the model was very significant as evidenced from the Fisher’s test.
| Source | Sum of Squares | Degree of freedom | Mean Square | F-value | p-value | |
|---|---|---|---|---|---|---|
| Model | 30.5 | 14 | 2.18 | 38.4 | < 0.0001 | Significant |
| A-Substrate conc | 0.0033 | 1 | 0.0033 | 0.0587 | 0.812 | |
| B-pH | 2.43 | 1 | 2.43 | 42.83 | < 0.0001 | |
| C-Temperature | 0.3502 | 1 | 0.3502 | 6.17 | 0.0262 | |
| D-Agitation | 6.12 | 1 | 6.12 | 107.86 | < 0.0001 | |
| AB | 0.49 | 1 | 0.49 | 8.64 | 0.0108 | |
| AC | 0.2652 | 1 | 0.2652 | 4.67 | 0.0484 | |
| AD | 0.0462 | 1 | 0.0462 | 0.8146 | 0.382 | |
| BC | 0.255 | 1 | 0.255 | 4.49 | 0.0524 | |
| BD | 1.6 | 1 | 1.6 | 28.2 | 0.0001 | |
| CD | 0.065 | 1 | 0.065 | 1.15 | 0.3025 | |
| A² | 5.29 | 1 | 5.29 | 93.26 | < 0.0001 | |
| B² | 5.71 | 1 | 5.71 | 100.63 | < 0.0001 | |
| C² | 0.9967 | 1 | 0.9967 | 17.57 | 0.0009 | |
| D² | 14.05 | 1 | 14.05 | 247.69 | < 0.0001 | |
| Residual | 0.7944 | 14 | 0.0567 | |||
| Lack of Fit | 0.5099 | 10 | 0.051 | 0.7168 | 0.696 | not significant |
| Pure Error | 0.2845 | 4 | 0.0711 | |||
| Cor Total | 31.3 | 28 |
Table 3: Analysis of variance of the results of the quadratic model.
The values p <0.05 (Table 3) denotes that the models are significant. The Model F-value of 38.40 implies the model is significant. Models with values p <0.05 indicates they are significant. In this regard the models B, C, D, AB, AC, BD, A², B², C², D² are significant. The Lack of Fit F-value of 0.72 recorded in this experiment indicates that Lack of Fit is not significant. Non-significant lack of fit is good and it signifies that our model fit.
When the multiple correlation coefficient (R2 value) is very close to 1, it is an indication that there is a strong relationship between the predicted and experimental responses. The coefficient of variation (CV) is used to confirm the level of precision of the experiment. A high coefficient of variation is in indication of lower reliability of the model and experiment. In this study, we recorded a low CV (7.05) (Table 4), which underscores the reliability of the experiment.
| Std. Dev. | 0.2382 | R² | 0.9746 |
|---|---|---|---|
| Mean | 3.38 | Adjusted R² | 0.9492 |
| C.V. % | 7.05 | Predicted R² | 0.892 |
| Adeq Precision | 19.3029 |
Table 4: Fit statistics of the proposed model.
The p values are very vital in the comprehension of the diverse pattern of mutual interface between variables and also to disclose the significance of coefficients. The R2 value of (0.97) shows strong relationship between the predicted and experimental values. The recorded low CV (7.05) suggests the experiment carried out is highly dependable. The Predicted R² of 0.8920 is in rational agreement with the Adjusted R² of 0.9492. Adeq Precision is used to determine the signal to noise ratio and any value that is greater than 4 is usually desirable. We recorded an Adeq Precision ratio of 19.303 which clearly shows an adequate signal. This suggests that this model can be used to navigate the design space.
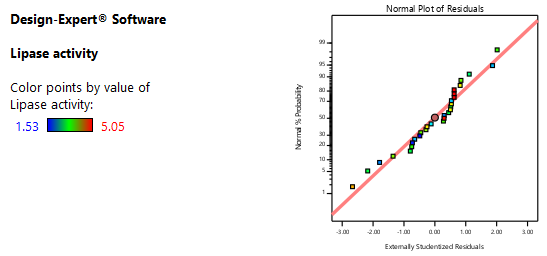
Before any statistical model is accepted, the suitability of the model is usually evaluated using appropriate statistical analysis. The main diagnostic analysis as demonstrated in Figure 1 to 4 might be used to evaluate the residual behavior of the adopted model. Numerous residual graphs are used to evaluate model assumptions. The prime aim is to monitor a normal probability plot of the residuals, in other words, the sum of standard deviations of actual values based on predicted values (Figure 1). The normal probability plot reveals if the residuals follow a normal distribution. This is a very significant assumption when evaluating the satisfactoriness of any statistical model. The results for residual values versus the predicted responses are demonstrated in Figure 2. In addition, all sequential components or time-based effects in the responses are revealed in the graph of residuals versus number graphs. The actual responses versus the predicted data are presented in figure 4.
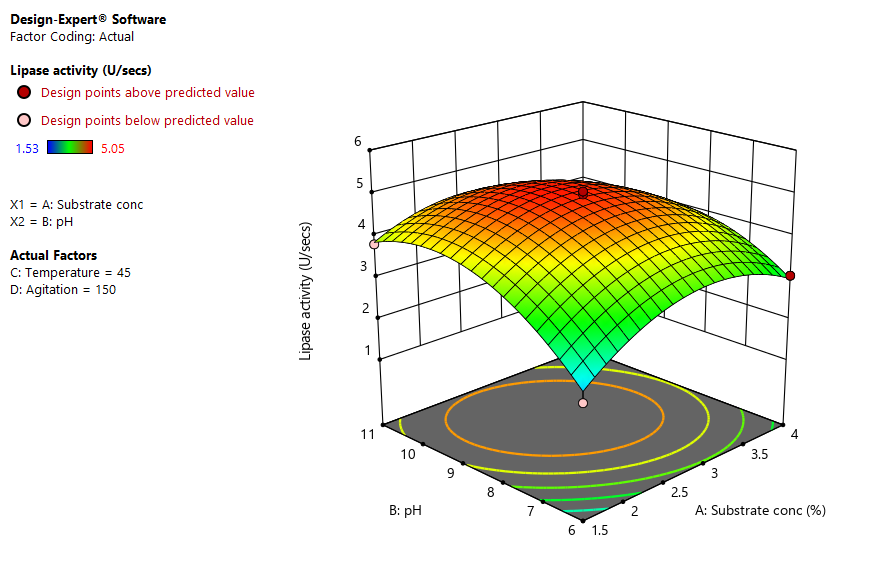
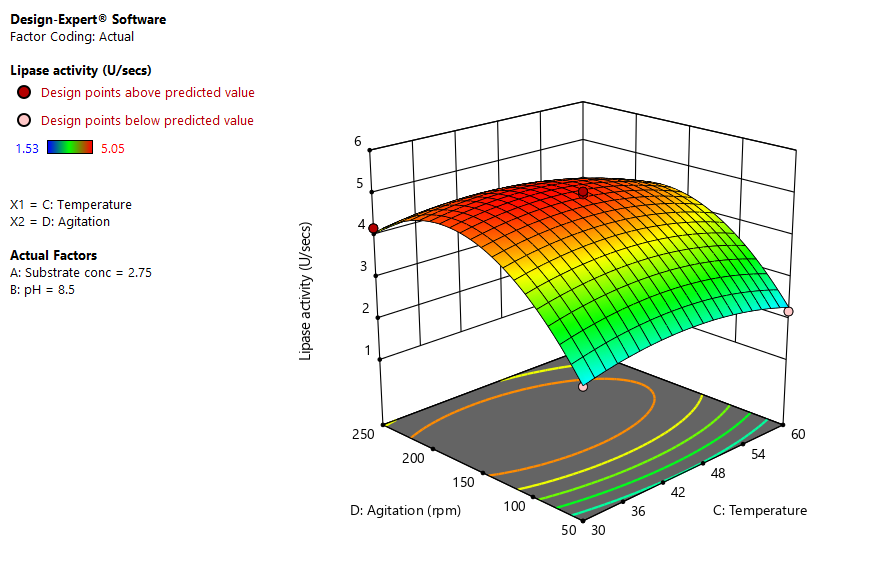
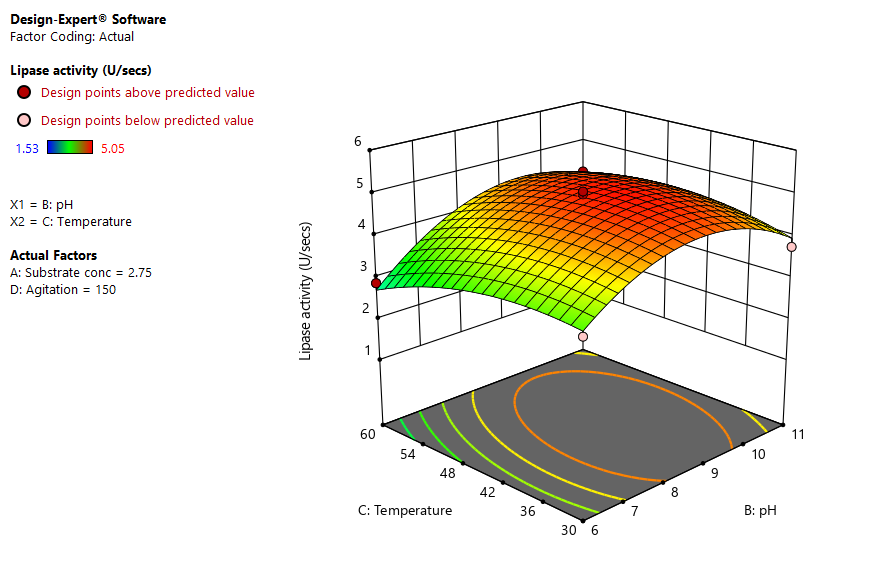
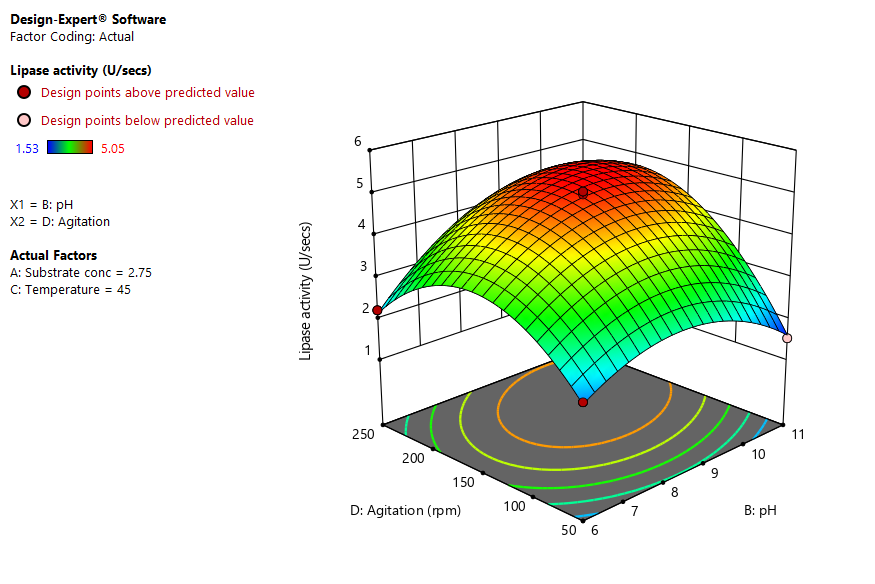
Since the “p values” underscores the importance of coefficients and are very crucial in appreciating the configuration of mutual interface amongst variables. In this regard, the interfacial effects and optimum levels of the variables were ascertained by producing the response surface curves. The contour and fitted response for the established regression model were represented in Figures 5 to 9. The 3 D response surface curves were produced to appreciate the interactions of medium constituents and their possible effect on the expression of lipase. The graphs underscore the characters played by diverse factors and some physical constraints.
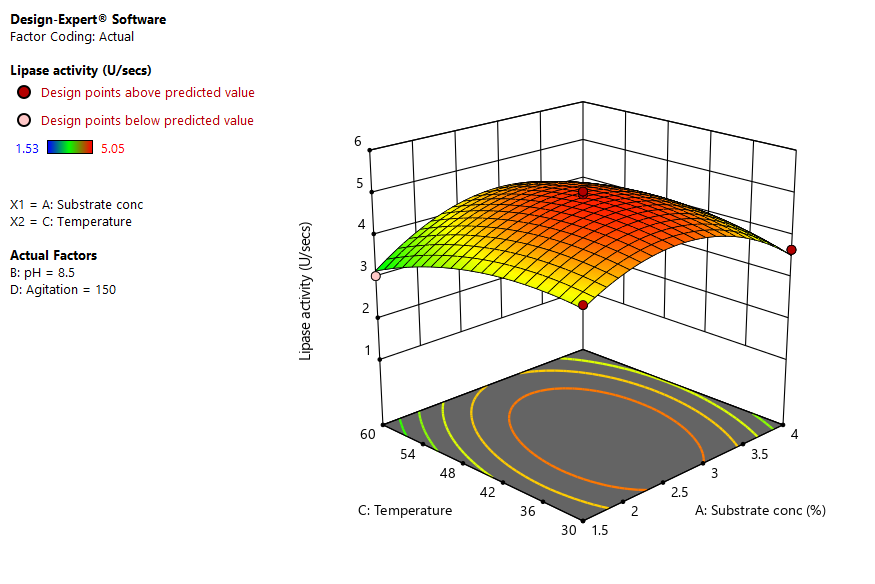
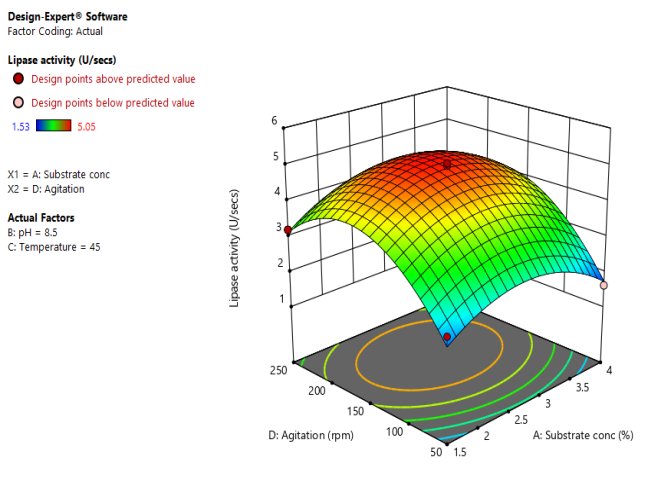
Figure 5 reveals the response surface plot obtained as a function pH and substrate concentration, while other variables were kept constant. An increase in lipase activity was recorded at pH 8.5 and substrate concentration of 2.75% v/v. The response surface plot obtained as a function of temperature and substrate concentration is demonstrated in figure 6. We observed an increase in lipase yield at temperature of 45ºC and substrate concentration of 2.75% v/v. Figure 7 reveals response surface plot showing interaction between agitation speed and substrate concentration. An increase in lipase yield was recorded at agitation of 150 rpm and substrate concentration of 2.75% v/v. Data in figure 8 shows the interaction between temperature and pH of the production medium. Highest lipase yield was observed at a temperature of 45ºC and pH of 8.5. The 3D response surface plot showing interaction between agitation and pH for lipase production is demonstrated in figure 9, an increase in lipase yield was observed at agitation of 150 rpm and pH of 8.5. Figure 10 shows the interaction between agitation speed and temperature. An increase in lipase activity was observed at agitation of 150 rpm and a temperature of 45ºC.
Response surface methodology (RSM) has been utilized by numerous authors for the optimization of myriad secondary metabolites produced by microorganisms [2]. This technique has been very efficient and successful. While taking into consideration the interface of the independent variables and controlling the numbers of experiment required, the Central composite design maximizes the quantity of information that could be attained [11, 18, 19].
This research has validated the application of a multifactorial statistical strategy for defining the fermentation conditions which resulted in the maximum yield of lipase production from a newly isolated Aspergillus flavus. Through the application of RSM in lipase production by Aspergillus flavus, optimal susbtrate concentration, agitation, and temperature and pH were established as factors that play significant roles in the medium. Evidently, enzyme decomposition could be observed as a result of interface with other constituents of the medium if the incubation period is extended [2]. Under stationary conditions, we observed a decline in enzyme production (1.53 U/mg), which might not be unconnected to inadequate mixing and relapse in dissolved oxygen concentration [20].
Low concentration of substrates does not trigger the activity of enzymes because majority of the enzyme may not be exposed to the substrate, in other words the substrate might not bind to the active site of the enzyme. Optimum substrate concentration usually leads to an increase in enzyme activity because equilibrium is sustained between the enzyme and the substrate [21]. On the contrary, high substrate concentration may likely cause inhibition of the substrate, which in turn reduces the activity of the enzyme [22, 23]. In this study, an optimum substrate concentration of 2.75% v/v was established, which led to a maximum lipase activity of 5.05 U/mg. Similarly, we observed maximum lipase production of 5.05 U/mg when we supplemented yeast extract (5 g/L) at optimum levels. Yeast extract contains intricate nutrients like lipids, nucleic acid, vitamins etc. which perhaps, might be essential for the growth and ultimate production of diverse secondary metabolites from microorganisms. Kole, et al. [24], reported that yeast extract is an essential nutrient required by microorganisms for enhanced expression of enzymes and other secondary metabolites.
This work also highlights the capability of Aspergillus flavus for the production of lipase. Response surface curves are handy and efficient in envisaging the interaction and effects of factors. The optimal culture medium established in this study provides a template for further research for possible large-scale production of enzymes or any secondary metabolite from Aspergillus flavus.
Conclusion
In this study, response surface methodology and factorial design was used to optimize medium components for enhanced lipase production. The validity of the obtained model obtained was evaluated by exploring diverse pertinent statistical indexes like F-value, coefficient of variation (C.V.), lack of fit, coefficient of determination (R2), Adj-R2 and predicted R2 which revealed that the proposed model is statistically adequate. Based on the proposed model, a suitable correlation quadratic polynomial equation was developed. This study established agitation speed of 150 rpm, substrate concentration of 2.75% v/v, temperature of 45 ºC and pH 8.5 as optimum medium conditions for enhanced lipase production. Finally, an optimal interaction among the optimized variables which led to a maximum lipase production was recorded.
Funding Information
This research was funded by World Bank Africa Centre of Excellence in Oilfield Chemical Research, University of Port Harcourt Choba, Rivers State, Nigeria.
Compliance with Ethical Standards
This research was carried out in compliance with ethical standards and guidelines.
Conflict of Interest
The authors declare that they have no conflict of interest regarding the publication of this manuscript
References
-
Nwaichi EO, Frac M, Nwoha PA, Eragbor P (2015) Enhanced Phytoremediation of Crude Oil- Polluted Soil by Four Plant Species: Effect of Inorganic and Organic Bioaugumentation. International Journal of Phytoremediation 17(12): 1253-1261.
-
Venil CK, Lakshmana P (2009) Application of Response Surface Methodology in Medium Optimization for Protease Production by the New Strain of Serratia marcescens SB08. Polish Journal of Microbiology 58(2): 117-124.
-
Osuoha JO, Abbey BW, Egwim EC, Nwaichi EO (2019) Production and Characterization of Tyrosinase Enzyme for Enhanced Treatment of Organic Pollutants in Petroleum Refinery Effluent. Society of Petroleum Engineers, pp: 1-13.
-
Kohilu U, Nigam P, Singh D, Chaudhary K (2001) Thermostable alkaliphilic and cellulose free xylanases production by Thermoactinomyces thalophilus subgroups C. Enzyme Microb Technol 28(7-8): 606-610.
-
Houde A, Kademi A, Leblanc D (2004) Lipases and their industrial applications. Appl Biochem Biotechnol 118: 155-170.
-
Ribeiro BD, de Castro AM, Coelho MAZ, Freire DMG (2011) Production and use of lipases in bioenergy: A review from the feedstocks to biodiesel production. Enzyme Res 615803.
-
Hasan F, Shah AA, Javed S Hameed A (2010) Enzymes used in detergents: Lipases. Afr J Biotechnol 9(31): 4836-4844.
-
Hasan F, Shan AA, Hameed A (2006) Industrial applications of microbial lipases. Enzyme Microb Technol 39(5): 235-251.
-
Gokhade DV, Patil SG, Bastawde KB (1991) Optimization of cellulase production by Aspergillus niger NCIM 1207. Appl Biochem Biotechnol 30(1): 99-109.
-
Wenster Botz D (2000) Experimental design for fermentation media development: Statistical design or global random search. J Biosci Bioeng 90 (5): 473-483.
-
Elibol M (2004) Optimization of medium composition for actinorhodin production by Streptomyces coelicolor A3(2) with response surface methodology. Process Biochem 39(9): 1057-1062.
-
Kunamneni A, Kumar KS, Singh S (2005) Response surface methodological approach to optimize the nutritional parameters for enhanced production of a Amylase. African J Biotechnol 4(7): 708-716
-
Ahuja SK, Ferreira GM, Morreira AR (2004) Application of Plackett and Burman design and response surface methodology to achieve exponential growth of aggregated shipworm bacterium. Biotechnol Bioeng 85(6): 666-675.
-
Francis F, Sabu A, Nampoothiri KM, Szakacs G, Pandey A (2002) Synthesis of a Amylase by Aspergillus oryzae in solid state fermentation. J Basic Microbiol 42(5): 320- 326.
-
Ghaly AE, Kamal M, Correia LR (2005) Kinetic modelingof continuous submerged fermentation of cheese whey forsingle cell protein production. Bioresour Technol 96(10): 1143-1152.
-
Plou FJ, Ferrer M, Nuero OM, Calvo MV, Alcade M, et al. (1998) Analysis of Tween 80 as an esterase/ lipase substrate for lipolytic activity assay. Biotechnology Techniques 13(3): 183-186.
-
Rao JM, Kim C, Rhee S (2000) Statistical optimization of medium for the production of recombinant hirudin from Saccharomyces cerevisiae using response surface methodology. Process Biochem 35(7): 639-647.
-
Chauhan B, Gupta R (2004) Application of statistical experimental design for optimization of alkaline protease production from Bacillus sp RGR-14. Process Biochem 39(12): 2115-2122.
-
Abdel Fattah YR, Saeed HM, Gohar YM, Baz MA (2005) Improved production of Pseudomonas aeruginosa uricase by optimization of process parameters through statistical experimental designs. Process Biochem 40: 1707-1714.
-
Uma Maheshwar Rao JL, Satyanarayana T (2003) Statistical optimization of a high maltose forming, hyper thermostable and Ca+2 independent alpha amylase production by an extreme thermophilic Geobacillus thermoleovorans using response surface methodology. J Appl Microbiol 95(4): 712-718.
-
Regina M, Broetto F, Giovannozzi Sermanni, Marabatini R, Peranni C (2008) Influence of stationary and bioreactor cultivation on Lentinula edodes (bark) Pegler lignocellulolytic activity. Brazilian Archives of Biology and Technology 51(2): 223-233.
-
Liu J, Yang J (2007) Cellulase Production by Trichoderma koningii. Computational Biology and Chemistry 33(2): 37-48.
-
Singhania RR, Patel AK, Soccol LR, Pandey A (2007) Recent advances in solid state fermentation. Biochemical Engineering Journal 44(1): 13-18.
-
Kole MM, Draper J, Gerson DF (1988) Production of protease by Bacillus subtilis using simultaneous control of glucose and ammonium concentrations. J Chem Technol Biotechnol 41(3): 197-206.
- Superposition of Cryo-EM and AlphaFold Predictions of Dengue Antigen-Antibody Complexes
- Jugular-Applied Coherent Low-Level Laser Therapy Enhances Systemic Mitochondrial Metabolic Function and Antioxidant Response
- Role of OMC32 Polypeptide in Acrosin-Mediated Exocytosis during the Bovine Sperm Acrosome Reaction
- Association of Galectin-3 but not Laminin in Tamoxifen-Induced Growth Suppression in Breast Cancer MCF-7 Cells
- Effect of Different Wavelengths of Light on the Rate of Photosynthesis
- Nutritional, Therapeutic, and Environmental Effect of Oyster Mushrooms: An Editorial