The Effect of Astragaloside on Hypoxic and Hypercapnic Pulmonary Hypertension and its Mechanismc
Objective: To investigate the effect of astragaloside on alleviating hypoxia-hypercarbia pulmonary hypertension by inhibiting endothelial-mesenchymal transition (EndoMT) via BMP-7/Smads pathway. Methods: Cell part: Rat pulmonary artery endothelial cells (RPAECs) were divided into normoxic control(C) group, hypoxia-hypercapnia(HH) group and BMP receptor agonist rhBMP-7(HB) group. Group C was cultured in a normal oxygen incubator, and the remaining 2 groups were cultured in a low oxygen and high carbon dioxide incubator. The expression levels of CD31 and α-SMA were observed by immunofluorescence staining. The mRNA and protein expression levels of α-SMA, CD31 and Smad1/5/8 were detected by reverse transcription-polymerase chain reaction (RT-PCR) and Western blot. Cell proliferation level was detected by CCK-8 assay. Cell migration level was detected by Transwell chamber assay. Animal part: forty male healthy SD rats of clean grede, weighting (180~220) g, were randomly divided into 4 groups (n=10): normoxia group (N), hypoxia-hypercarbia group (HH); astragaloside high dose group (AH) and low dose group (AL). N group was kept in normoxic environment, the remaining three groups were intermittently exposed to hypoxia-hypercarbia environment (9%ï¾11% O2, 5%ï¾6% CO2) for 4 weeks, 6 days a week, 8 hours per day. The rats in AH and AL groups were received astragaloside gavage in a dosage of 2,4mg/kg respectively (3 ml/kg), the rats in N and HH groups were received equal volume of normal saline. After 4 weeks, the mean pulmonary arterial pressure (mPAP) was detected, the right ventricular free wall and left ventricle plus ventricular septum were isolated to determine the right ventricular hypertrophy index. Lung ultrastructural changes were surveyed under an electronic microscopy, the changes of pulmonary artery structure surveyed by immunofluorescence. Results: Cell part: Compared with the C group, α-SMA mRNA and protein expression levels were increased in HH group (P
Introduction
Pulmonary arterial hypertension (PAH) is a group of diseases that cause remodeling of the pulmonary microvascular structure, which leading to increased pulmonary vascular resistance, eventually leading to right heart failure, with high morbidity and mortality [1, 2]. In recent years, the research and exploration of PAH has greatly increased the survival time and quality of life of related patients, and alleviated the progress of the disease [3], but failed to completely break through and cure PAH. The main reason for the continued development of PAH, which is difficult to reverse, is pulmonary vessel structural remodeling (PVSR). In recent years, studies have found a close relationship between endothelial-mesenchymal transdifferentiation (EndoMT) and PVSR. Kim et al found that ECs can participate in atherosclerotic vascular remodeling by up-regulating the expression of α-smooth muscle actin (α-SMA) and vimentin by EndoMT [4]. However, the development of PVSR and its underlying mechanism of EndoMT involvement in hypoxic and hypercapnic pulmonary hypertension have not yet been fully elucidated.
It is currently believed that the TGF-β superfamily is closely related to EndoMT. The bone morphogenetic protein (BMP) family is a member of the TGF-β superfamily. There are two types of bone morphogenetic protein receptor (BMPR) [5]. Studies have shown that BMP-7 binds to BMPR and activates downstream Smad1/5/8 to exert its anti- vascular remodeling ability. However, the effect of BMP-7 and its downstream Smad1/5/8 pathway on hypoxia and hypercapnic PH has not been clarified.
In the field of traditional Chinese medicine, pulmonary hypertension is also called lung inflation [6, 7, 8, 9]. The use of astragaloside in the treatment of pulmonary hypertension in China can significantly improve the patient’s hypoxia, clinical symptoms and improve the quality of life. The aim of this study was to investigate whether Astragaloside IV can inhibit EndoMT via BMP-7/Smads pathway and relieve HHPH, providing new therapeutic ideas and methods for clinical prevention and treatment of pulmonary hypertension [10].
Materials
Animal preparation
Forty male healthy clean SD rats , weighting 180g ~ 220g, were provided by the Experimental Animal Center of Wenzhou Medical University, China. Animal license NO: SCXK (zhejiang 2015-0009).
Cells
Rat pulmonary endothelial cells (RPAECs) were purchased from Shanghai Baili Biotechnology Co., Ltd.
Reagents and drugs
BMP receptor agonist rhBMP-7 (US peprotech); fetal bovine serum (FBS) and DMEM high glucose medium were purchased from the United States Gibco; BCA protein concentration determination kit, a Anti-diluting solution (Biyuntian, China); rabbit anti-rat α-SMA antibody, rabbit anti-rat Smad1/5/8 antibody, rabbit anti-rat BMP-7 antibody, mouse anti-rat CD31 antibody (Abcam, UK ), rabbit anti-rat Phospho-Smad1/5/8 antibody (Cell Signaling Technology, USA); reverse transcription kit (Thermo); horseradish- labeled goat anti-rabbit IgG, goat anti-mouse IgG (Bo Yun, China) ); skimmed milk powder (BD, USA).
Experimental methods
Cell part i. Cell culture and grouping RPAECs were cultured in DMEM high glucose medium containing 10% FBS in a 5% CO2, 21% O2, 37 °C environment. Cells were grown to confluence using 0.25% trypsin for passage and passaged twice a week. When the density of RPAECs was about 80%, cells were treated with DMEM high glucose medium without FBS for 24 h. Subsequently, they were randomly divided into three groups: normoxia control group (C), hypoxia and high carbon dioxide (HH) group, and BMP receptor agonist rhBMP-7 (HB) group. The C group was replaced with fresh DMEM high glucose medium and placed in a normal oxygen incubator (21% O2, 5% CO2). The HH group was replaced with fresh DMEM high glucose medium and placed in a low oxygen and high carbon dioxide incubator (1% O2, 6% CO2). The HB group was replaced with DMEM high glucose medium containing rhBMP-7 (100 ng/ml) and placed in a low oxygen and high carbon dioxide incubator. After 24 hours of culture in each group, cells were collected and subjected to subsequent experiments.
ii. Identification of RPAECs by CD31 and α-SMA Immunofluorescence Double Labeling Cell slides were prepared in a six-well plate and cell model preparation was performed when the cells were in good condition. After the modeling, 4% paraformaldehyde was fixed for 30 min, 0.1% Triton was treated for 20 min, and 5% BSA solution was blocked for 30 min. The primary antibody (containing anti-α-SMA primary antibody and anti- CD31 primary antibody with dilution ratio of 1:100) was added dropwise with 1% BSA solution. Another cell slide was added with PBS solution instead of primary antibody as blank control. Incubate overnight at 4°C in a refrigerator. The next day, the slides were taken out, and the secondary antibody (containing TRITC-labeled secondary antibody and FITC-labeled secondary antibody at a dilution ratio of 1:100)
was incubated for 30 min, and DAPI staining solution was added dropwise (diluted 1:1000). Incubate for 5 min at room temperature, and add anti-fluorescence quencher to the cells and then seal. The cells were observed under an upright fluorescence microscope, photographed and stored.
iii. Reverse transcription-PCR (RT-PCR) detection of Smad1/5/8, CD31, α-SMA mRNA in RPAECs The modeled RPAECs were removed, and 1 ml of Trizol was added, the cells were scraped with cells, transferred to an EP tube, and lysed on ice for 10 min. After adding 200 ul of chloroform, the mixture was inverted and allowed to stand for 15 min. After centrifugation, the upper aqueous phase was aspirated. An equal volume of isopropanol was added, mixed by inversion, and a white precipitate was collected after centrifugation. The precipitate was suspended by adding 75% ethanol diluted with DEPC water, and the precipitate was collected again by centrifugation to obtain the extracted total RNA. The RNA pellet was dissolved by adding 20 μl of DEPC water, the total RNA concentration was determined, and cDNA was synthesized according to the reverse transcription kit instructions. The CD31 primer was synthesized by Takara, Japan, and the remaining primers were synthesized by Shanghai Jierui. The sequence is shown in Table 1. PCR amplification conditions (32 cycles): pre- denaturation at 94°C for 3 min; denaturation at 94°C for 30 sec; 60°C / 64.5°C / 54°C / 60°C (Smad1 / 5 / 8 / CD31 / α-SMA / GAPDH) annealing 30 sec; Extension at 72°C for 1 min; termination at 72°C for 5 min. The RT-PCR product was electrophoresed at 100 V for 30-40 min and then exposed for imaging. Image J software analyzes the gray value of the electrophoresis band, and uses the ratio of the target gene to the gray value of the GAPDH gene to express the expression level of the target gene.
| Gene | Primer Pair Sequence | Product Size (bp) |
|---|---|---|
| Smad1/5/8 | Left: 5’-CAGCAGCTACCCCAACTCTC -3’ | 177 |
| Right: 5’-TTCACACCACTTTTCTTCCT -3’ | ||
| CD31 | Left: 5’- CTCCCAGAACATGGATGTGGAGTA -3’ | 112 |
| Right: 5’- GTGCATCTGCCTTGGCTGTC -3’ | ||
| α-SMA | Left: 5’-GAGTGATGGTTGGAATGG -3’ | 106 |
| Right: 5’-GTGATGATGCCGTGTTCT -3’ | ||
| GAPDH | Left: 5’-TCTCTGCTCCTCCCTGTTC-3’ | 87 |
| Right: 5’-ACACCGACCTTCACCATCT -3’ |
Table 1: The primer sequences.
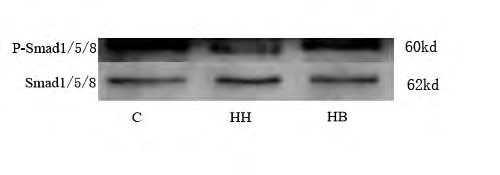
iv. Western Blot detection of Smad1/5/8, P-Smad1/5/8, CD31, α-SMA protein in RPAECs The cells after the modeling were lysed with 1000μl of PMSF-containing RAPI lysate (PMSF: RAPI = 1:100), thoroughly ground, transferred to an EP tube, allowed to stand for 40 min, and the supernatant was collected by centrifugation. The total protein concentration was measured by a BCA protein concentration assay kit, diluted to 2μg/ μl, and boiled in boiling water for 10 min to fully denature the protein sample. The amount of protein loaded per well during electrophoresis was 20ug, and the protein was transferred to the PVDF membrane after electrophoresis. After the film was transferred, 10% skim milk powder was sealed at room temperature for 1.5h. After washing the membrane, incubate the primary antibody overnight at 4°C. Primary antibody dilution ratio: CD31, α-SMA, P-Smad1/5/8, Smad1/5/8 and GAPDH antibodies were 1:1000. The membrane was washed the next day and then incubated with the secondary antibody for 1 h at room temperature. α-SMA, P-Smad1/5/8, Smad1/5/8, GAPDH protein were incubated with horseradish peroxidase (HRP)-labeled goat anti-rabbit secondary antibody, and CD31 protein was HRP- labeled goat anti-mouse II Anti-incubation, the dilution ratio is 1:10000. After the incubation of the secondary antibody, the membrane was washed with TBST solution, and ECL chemiluminescence solution (solution A: solution B = 1:1) was added in the dark, exposed to a protein exposure apparatus and the strip was preserved. Image J software analyzes the gray value of the band, and the expression level of P-Smad1/5/8 protein is expressed by the ratio of the gray value of P-Smad1/5/8 and Smad1/5/8 protein. The rest of the protein uses the target protein and GAPDH. The ratio of the gray value of the protein indicates the expression level of the protein of interest.
v. CCK-8 method for detecting cell proliferation A suspension of RPAECs having a density of 5 × 10⁴ /ml was inoculated in a 96-well plate at a ratio of 200μl/well, and six replicate wells were set in each group, and cultured conventionally. A cell model was prepared when the density of the RPAECs was about 80%. After the modeling was completed, the 96-well plate was taken out, the old medium was discarded, and the cells were washed three times with PBS solution. 10μl of CCK-8 and 100 ul of serum-free medium were added dropwise to each well containing cells in a 96-well plate, and incubated at 37°C for 3 hours, and the absorbance at 492 nm was measured. Result processing: 6 OD values were obtained for each group, and a maximum value and a minimum value were removed for statistical analysis.
vi. Transwell chamber assay for cell migration A cell suspension having a density of 1 x 10⁵/ml was prepared using serum-free medium. The drugs required for each subgroup were added to the lower chamber of the Transwell chamber (500μl per well and 10% FBS). The upper chamber was placed in the lower chamber, and 200μl of the above cell suspension was added to the upper chamber, and placed in an incubator to mold (the cell starvation step was omitted). After 20 hours, the chamber was removed and the old medium was discarded. The cells in the Transwell chamber that did not pass through the membrane were wiped with a clean cotton swab, and the transmembrane cells were fixed in 4% paraformaldehyde for 30 min, rinsed with PBS, and naturally dried in the air for 5 min. The permeabilized cells were stained with crystal violet stain for 30 min, washed several times with PBS solution, and air-dried at room temperature. The entire Transwell chamber membrane was cut with a scalpel, placed on a glass slide, and covered with a cover slip. Under the ordinary microscope, three or more high power microscope fields were randomly selected, and the number of transmembrane cells was counted.
Animal part i. Experimental grouping and model preparation Forty rats were randomly divided into 4 groups (n=10): normoxia group (N), hypoxic hypercapnia group (HH), astragaloside high dose group (AH) and low dose group (AL). The N group was kept in normal oxygen for 4 weeks, and the other three groups were exposed to hypoxia and high carbon dioxide (9% 11% O2, 5% 6% CO2) for 4 weeks, 6 days a week, 8 hours/day. The AH and AL groups were intragastrically administered with an equal volume (3 ml/kg) of different concentrations of Astragaloside IV, which were converted according to the conversion rate of human-rat body surface area. The doses of rats in the AH and AL groups were 4, 2mg/ kg, the HH group was given an equal volume of normal saline before entering the warehouse.
ii. Detection of rat pulmonary artery mean pressure (mPAP) After weighed, the rats were anesthetized with 3% pentobarbital sodium, fixed, alcohol-sterilized rat neck fur, the subcutaneous tissue was separated, the external jugular vein was exposed and lifted, and a “V” shaped incision was cut to convert the connection pressure. The PE catheter is pushed inward along the incision until a small, regular pulmonary wave appears and the record is preserved.
iii. Measurement of right ventricular hypertrophy index in rats After measuring mPAP, the lung lobe and heart were lavaged with normal saline, the heart was cut into PBS, the atrium and the large blood vessel root were cut along the atrioventricular groove, and the right ventricular free wall (RV) and the left ventricle plus ventricle were preserved. The interval (left ventricle + ventricular septum, LV + S), blotted with filter paper, weighed, according to the formula RV / (LV + S), to determine the right ventricular hypertrophy index.
iv. Electron microscopy of rat lung tissue Take 1 mm × 1 mm × 1 mm lung tissue specimens, immerse the specimens in electron microscopy fluid, then rinse them with PBS, and immerse the specimens in 1% uranium acetate for 2h, using 50%, 70%, 80%, 90% acetone was dehydrated for 15 min, pure acetone was dehydrated for 20 min, and 1:1 acetone: embedding solution (V/V) = soaked, embedded, produced, and observed by transmission electron microscopy.
v. Immunofluorescence observation of rat lung tissue The lung tissues of each group were embedded in paraffin, sliced, baked at 60°C for 2h, dewaxed with xylene, hydrated with 100% ethanol, 95% ethanol and 75% ethanol for 5 min, rinsed with PBS, and incubated with 3% hydrogen peroxide 20 Min, placed in boiled 0.01 mol/L sodium citrate buffer for 4 min, 5% BSA blocked, rabbit anti-rat α-SMA antibody and mouse anti-rat CD31 antibody were added (dilution ratio 1:100), overnight at 4°C. The next day was rewarmed at 37°C for 45 min, rinsed with PBS, added with fluorescently labeled secondary antibody, incubated for 30min at 37°C in water, 50% glycerol was mounted, and observed under a fluorescence microscope.
vi. Statistical analysis Using SPSS l9.0 software for statistical analysis, metrological data were tested for normality, and the data was expressed in mean±SD. There were one-way ANOVA between multiple groups of samples, P<0.05 was considered as statistically significant.
Methods
Cell part
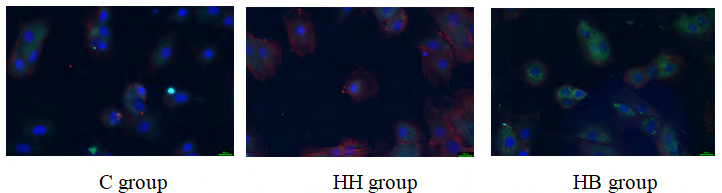
The expression of CD31 and α-SMA in the immunofluorescence of each group: The fluorescence of the expression of CD31 in this experiment was green, the fluorescence of the labeled α-SMA was red, and the fluorescence intensity indicated the level of protein expression. The results showed that the fluorescence intensity of CD31 in the C group was high and the expression was high, while the fluorescence intensity of α-SMA was weak and almost no expression. Compared with the C group, the fluorescence intensity of CD31 in the HH group was slightly weakened, while the fluorescence intensity of α-SMA was significantly increased. Compared with the HH group, the fluorescence intensity of CD31 in the HB group increased slightly, and the fluorescence intensity of α-SMA decreased significantly (Figure 1).
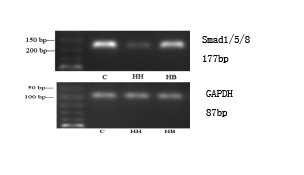
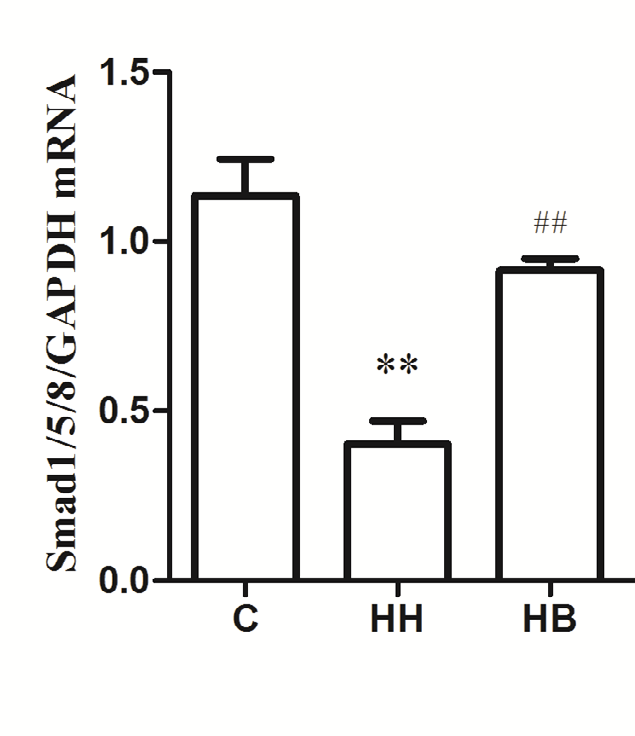
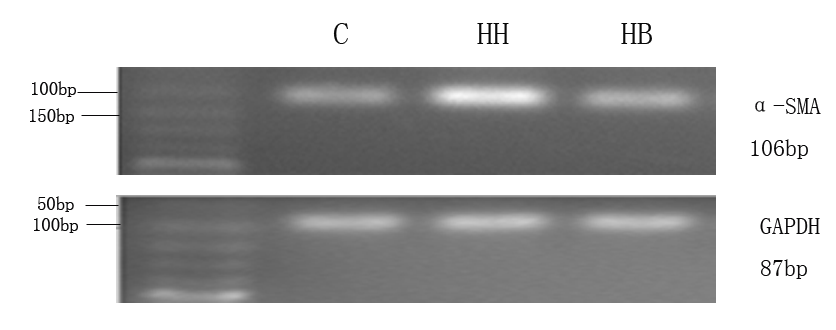
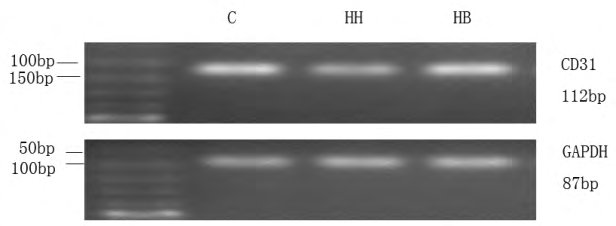
Expression of α-SMA, CD31 and Smad1/5/8 mRNA in each group: The results showed that compared with the C group, the expression of α-SMA mRNA in HH group was significantly increased (P<0.01), and the expression levels of CD31 and Smad1/5/8 mRNA were significantly decreased (P<0.01). Compared with HH group, the expression of α-SMA mRNA in HB group decreased (P<0.01), and the expression levels of CD31 and Smad1/5/8 mRNA increased (P<0.01) (Figure 2).
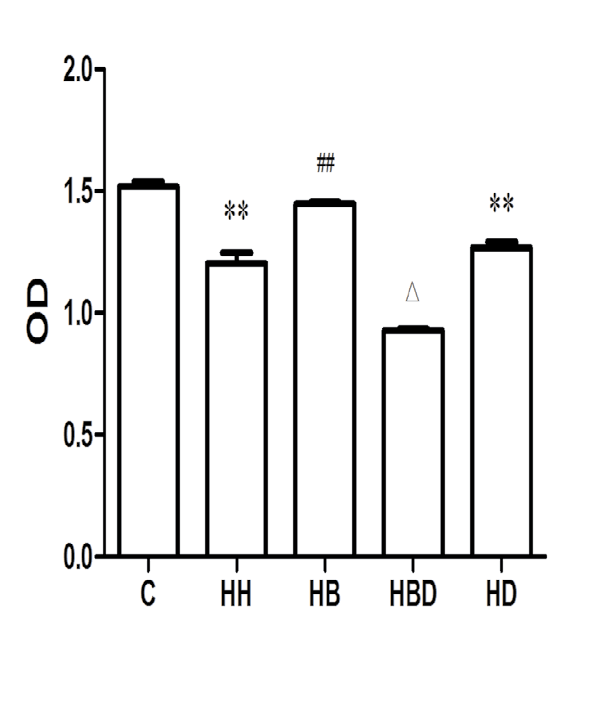
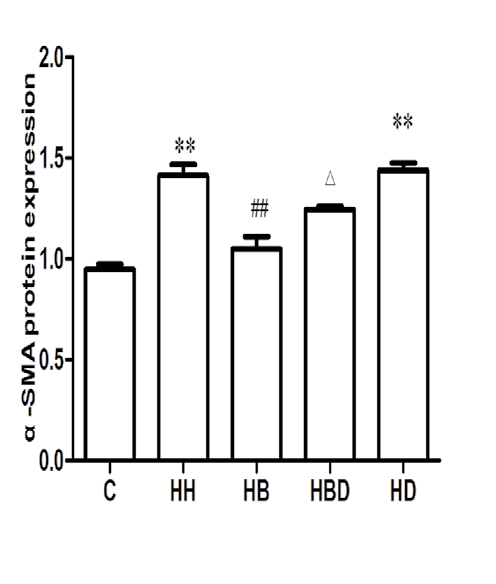
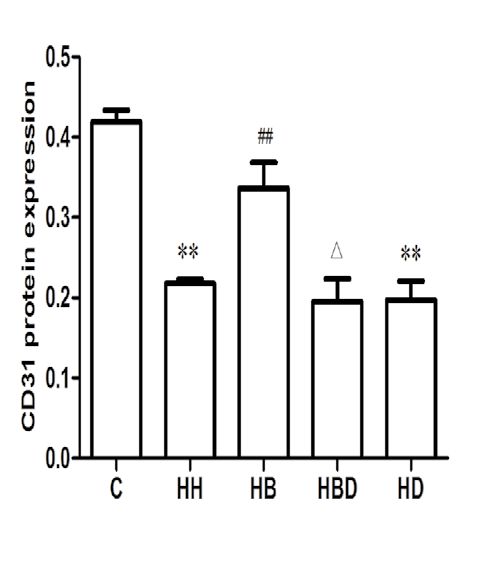
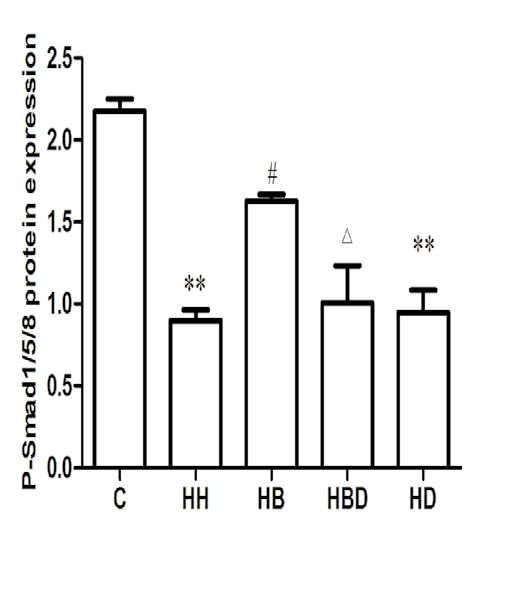
Protein expression of α-SMA, CD31 and P-Smad1/5/8 in each group: The results showed that compared with the C group, the expression of α-SMA protein in HH group was significantly increased (P<0.01), and the expression levels of CD31 and P-Smad1/5/8 protein were significantly decreased (P<0.01). Compared with HH group, the expression level of α-SMA protein in HB group was decreased (P<0.01), and the expression levels of CD31 and P-Smad1/5/8 protein were increased (P<0.05, P<0.01) (Figure 3).
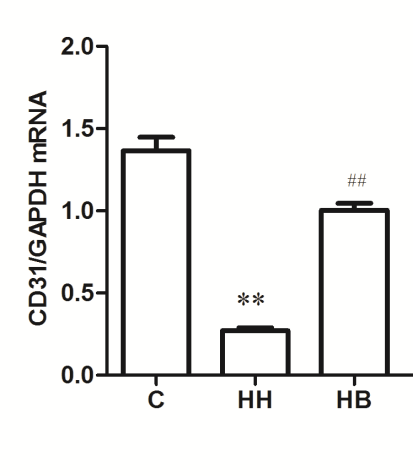
Cell proliferation in each group: The results showed that the OD value of the C group was (1.548±0.019), and the OD value of the HH group (1.184±0.042) was decreased compared with group C (P<0.01). Compared with the HH group, the OD value of the HB group (1.467±0.024) increased (P<0.01) (Figure 4).
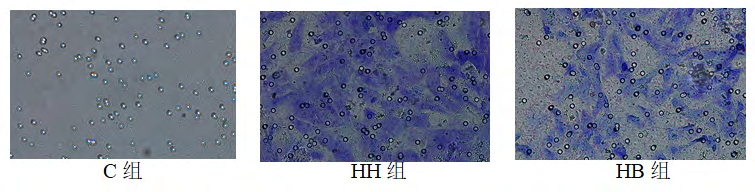
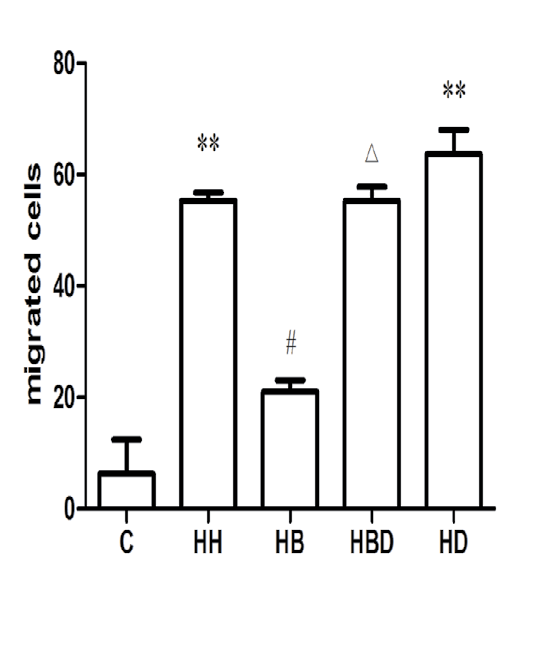
Cell migration in each group: Compared with the number of cell migration in the C group (5.1900±18.982), the number of migrated cells in HH group (55.280±2.506) was significantly increased (P<0.01). Compared with the HH group, the number of migrated cells in the HB group (21.784±4.671) decreased (P<0.05) (Figures 5 and 6).
Animal part
Comparison of pulmonary artery mean pressure and right ventricular hypertrophy index in each group: After 4 weeks, compared with the N group rats, the mPAP of the other three groups of rats increased to different degrees (P<0.01), and the RV/(LV+S) ratio increased to different degrees (P<0.01). Compared with HH group, mPAP decreased in AH group and AL group (P<0.01), and RV/(LV+S) also decreased (P<0.01) (Table 2).
| mPAP(mmHg) | RV/(LV+S)(%) | |
|---|---|---|
| N | 15.76±1.52 | 23.17±1.82 |
| HH | 29.67±2.24** | 34.63±2.71** |
| AH | 22.19±2.48**△△ | 27.49±2.32**△△# |
| AL | 22.98±3.12**△△ | 32.83±2.31** |
Table 2: Changes in mPAP and RV/ (LV+S) of rats in each group. ( _x_ ±_s, n_=10). **_P_<0.01 _vs_ N group; △△_P_<0.01 _vs_ HH gro
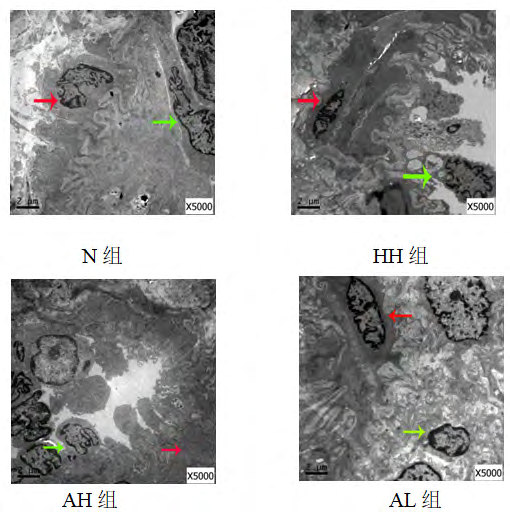
Electron microscopic observation results of lung tissue of each group: Compared with the N group, the pulmonary artery endothelial cells of the other three groups showed different degrees of shedding and necrosis, the cytoplasmic swelling of smooth muscle cells was obvious, and the collagen fibers clustered and proliferated; compared with the HH group, the endothelial cells of the AH and AL groups were exfoliated and necrotic. The condition improved, and the cytoplasmic swelling of smooth muscle cells was not obvious, and a small amount of collagen fibers were clustered (Figure 7).
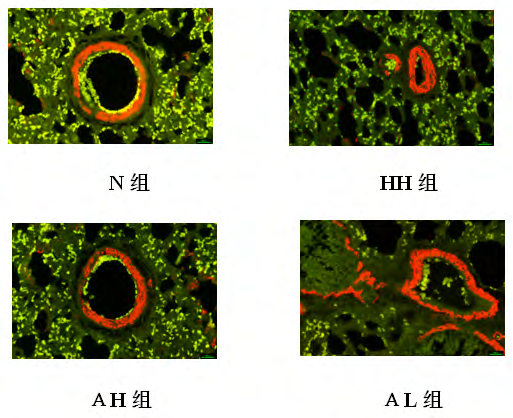
Expression levels of CD31 and α-SMA in pulmonary artery wall of rats in each group: CD31 is a specific marker of endothelial cells, often distributed in the intima of the blood vessels, showing green fluorescence; α-SMA is a marker of smooth muscle cells, often distributed in the vascular membrane, showing red fluorescence. The results showed that compared with the N group, the other three groups had obvious CD31 shedding, the green fluorescence intensity was weakened, and the α-SMA distribution was diffuse. Compared with the HH group, the CD31 fluorescence intensity was enhanced in the AH and AL groups, and the α-SMA was distributed in the vascular membrane. Fluorescence intensity is general (Figure 8).
Analysis and Discussion
PAH is a type of progressive disease that has not yet defined a specific etiology. Its pathological changes include pulmonary vasoconstriction, pulmonary vascular remodeling, persistent pulmonary artery pressure, right ventricular hypertrophy, etc [10, 11, 12]. The prognosis of PAH is not good, and it increases the economic burden of patients and society. Therefore, controlling the occurrence and development of PAH has a great effect on improving people’s quality of life [13]. PAH is associated with pulmonary vascular remodeling, more often secondary to atrial septal defect [14], chronic obstructive pulmonary disease (COPD) [15], interstitial pulmonary fibrosis and related heart disease [16]. In recent years, although there has been significant progress in understanding the pathogenesis of PAH biogenetics [17], inflammation [18], it has not completely broken through and cured PAH. The main pathological change in the development of pulmonary hypertension is PVSR. During the process of PVSR, the anterior pulmonary vascular endothelial cells (ECs) function abnormally, and the distal vascular muscle formation increases, and the α-SMA-expressing cells accumulate in a large amount and extend into the previously un-muscleized blood vessels, causing serious Structural changes in the pulmonary vasculature [19]. In recent years, it has been found that ECs can express α-SMA, vimentin and fibroblast-specific protein 1 through EndoMT, and become a hot spot for studying vascular remodeling diseases such as myocardial fibrosis and renal fibrosis [20]. However, whether EndoMT is involved in hypoxia and hypercapnic PAH and its underlying mechanisms are not fully understood.
EndoMT is a cell phenotypic transformation. Vascular endothelial cells have the ability to produce myofibroblasts, which are characterized by downregulation of vascular endothelial markers such as CD31, vascular endothelial cadherin (VE-cadherin), etc. The appearance of fibroblast markers such as α-SMA and fibroblast specific protein-1 (FSP-1) [21]. It is currently believed that the TGF-β family is closely related to the development of EndoMT. BMPs are members of the TGF-β family and mediate the differentiation of mesenchymal cells into cartilage and bone-forming cells [22]. BMP-7 is also known as osteogenic protein-1 (OP- 1). In recent years, it has been found to have anti-vascular remodeling effects and has gradually become a research hot spot. Wang M et al. found that overexpression of mouse miR-4739 can induce pleural fibrosis. After administration of exogenous BMP-7, E-cadherin promoter activity and down- regulation of mRNA levels can prevent pleural fibrosis in mice [23]. The Higgins DF team gave exogenous rhBMP-7 and found that it inhibited the expression of collagen Iα1 and collagen IIIα1 genes and the accumulation of collagen I protein, and increased the expression of renal collagen IVα1 in the unilateral ureteral obstruction model [24, 25, 26, 27]. The Smads protein is a key signaling factor downstream of BMPR. The Smad factors associated with BMPR are mainly receptor- activated Smads (R-Smads, including Smad1, 2, 3, 5 and 8) [28]. When BMP-7 binds to BMPR, it activates Smad1/5/8, and then forms a complex with the common ligand Smad4, and then translocates into the nucleus to induce transcription of related target genes [29].
The syndrome of lung distension is generally the virtual standard, and the lung qi deficiency, the motor function and respiratory function are significantly lower than normal people [30], manifested as cough, weakness, lack of energy and so on. The lungs are reversed and sputum, the lungs are full, the breathing is difficult, leading to asthma, the ventilating function in the body and outside is dysfunctional, the gas entering the body is hindered, the turbidity cannot be smoothly discharged, resulting in turbidity, water and blood and other symptoms [31]. In view of this, after long-term clinical practice, the traditional Chinese medicine treatment with astragaloside has achieved remarkable results [32]. In this experiment, the human body dosage was converted into the equivalent dose of rats according to the body surface area, and the astragaloside IV was divided into two groups of high and low doses, the concentrations were 4 and 2 mg/kg, respectively [33, 34, 35].
In summary, low O2 and high CO2 environment can induce EndoMT in rat pulmonary artery endothelial cells, aggravating the development of PH, and its mechanism may be related to the inhibition of BMP-7/Smads pathway. Astragaloside IV can alleviate HHPH and reduce pulmonary artery pressure. The mechanism may be to promote the expression of BMP-7/Smads pathway and inhibit EndoMT. This experiment provides a theoretical basis for regulating the intracellular pathway of pulmonary vascular remodeling and the molecular targeting strategy of PH new therapy.
References
-
Abubakr A, Bajwa, Adil Shujaat, Minal Patel, Rahaghi F, et al. (2017) The safety and tolerability of inhaled treprostinil in patients with pulmonary hypertension and chronic obstructive pulmonary disease Pulm Circ 7(1): 82-88.
-
Yoshida Y, Kage H, Murakawa T, Sato Y, Fukayama M, et al. (2015) Worse Prognosis for Stage IA Lung Cancer Patients with Smoking History and More Severe Chronic Obstructive Pulmonary Disease. Ann Thorac Cardiovasc Surg 21(3): 194-200.
-
Fossati L, Müller-Mottet S, Hasler E, Bloch KE, Huber LC, et al. (2014) Long-term effect of vasodilator therapy in pulmonary hypertension due to COPD: a retrospective analysis. Lung 192(6): 987-995.
-
Kaushal M, Shah PS, Shah AD, Francis SA, Kothari KK, et al. (2016) Chronic obstructive pulmonary disease and cardiac comorbidities: A cross-sectional study. Lung India 33(4): 404-409. **5.** Serraj M, Smahi M, Kamaoui I, El Houari A, Sahnoune F, et al. (2013) Hydatic pulmonary embolism: a rare complication of hepatic hydatid cyst. Rev Mal Respir 30(3): 215-221.
-
Ozdemir O, Ceylan Y, Razi CH, Ceylan O, Andiran N (2013) Assessment of ventricular functions by tissue Doppler echocardiography in children with asthma. Pediatr Cardiol 34(3): 553-559.
-
Qiu X, Zheng M, Song D, Huang L, Tang L, et al. (2016) Notoginsenoside Rb1 inhibits activation of ERK and p38 MAPK pathways induced by hypoxia and hypercapnia. Exp Ther Med 11(6): 2455-2461.
-
Wrobel JP, Thompson BR, Williams TJ (2012) Mechanisms of pulmonary hypertension in chronic obstructive pulmonary disease: a pathophysiologic review. J Heart Lung Transplant 31(6): 557-564.
-
Courboulin A, Ranchoux B, Cohen-Kaminsky S, Perros F, Bonnet S (2016) MicroRNA networks in pulmonary arterial hypertension: share mechanisms with cancer? Curr Opin Oncol 28(1): 72-82.
-
Lee A, McLean D, Choi J, Kang H, Chang W, et al.(2014) Therapeutic implications of microRNAs in pulmonary arterial hypertension. BMB Rep 47(6): 311-317.
-
Tan W, Madhavan K, Hunter KS, Park D, Stenmark KR (2014) Vascular stiffening in pulmonary hypertension: cause or consequence? (2013 Grover Conference series). Pulm Circ 4(4): 560-580.
-
Yamashita T, Honda M, Nakamoto Y, Hara Y, Zeng SS, et al. (2013) Discrete nature of EpCAM+ and CD90+ cancer stem cells in human hepatocellular carcinoma. Hepatology 57(4): 1484-1497.
-
Lin F, Wang N, Zhang TC (2012) The role of endothelial- mesenchymal transition in development and pathological process. IUBMB Life 64(9): 717-723.
-
Aktug Demir N, Kolgelier S, Inkaya AC, Sumer S, Demir LS, et al. (2014) Are bone morphogenetic protein-7 (BMP-7) serum levels correlated with development of hepatic fibrosis?. J Infect Dev Ctries 8(5): 605-610.
-
Mason RM (2013) Fell-Muir lecture: Connective tissue growth factor (CCN2) -- a pernicious and pleiotropic player in the development of kidney fibrosis. Int J Exp Pathol 94(1): 1-16.
-
Sommer N, Dietrich A, Schermuly RT, Ghofrani HA, Gudermann T, et al. (2008) Regulation of hypoxic pulmonary vasoconstriction: basic mechanisms. Eur Respir J 32(6): 1639-1651.
-
Yamamura A (2016) Molecular Mechanism of Dihydropyridine Ca2+ Channel Blockers in Pulmonary Hypertension. Yakugaku Zasshi 136(10): 1373-1377.
-
Deng L, Blanco FJ, Stevens H, Lu R, Caudrillier A, et al. (2015) MicroRNA-143 Activation Regulates Smooth Muscle and Endothelial Cell Crosstalk in Pulmonary Arterial Hypertension. Circ Res 117(10): 870-883.
-
Garcia-Morales LJ, Chen NY, Weng T, Luo F, Davies J, et al. (2016) Altered Hypoxic-Adenosine Axis and Metabolism in Group III Pulmonary Hypertension. Am J Respir Cell Mol Biol 54(4): 574-583.
-
Suresh K, Shimoda LA (2016) Lung Circulation. Compr Physiol 6(2): 897-943.
-
Yi-xiao Xu, Li-na Lin, Lan-lan Tang, Ma Y, Huang L, et al. (2014) Notoginsenoside R1 attenuates hypoxia and hypercapnia induced vasoconstriction in isolated rat pulmonary arterial rings by reducing the expression of ERK. Am J Chin Med 42(4): 799-816.
-
Xavier S, Vasko R, Matsumoto K, Zullo JA, Maizel J, et al. (2015) Curtailing endothelial TGF-β signaling is sufficient to reduce endothelial-mesenchymal transition and fibrosis in CKD. J Am Soc Nephrol 26(4): 817-829.
-
Rieder F, Kessler SP, West GA, Bhilocha S, de la Motte C, et al. (2011) Inflammation-induced endothelial-to- mesenchymal transition: a novel mechanism of intestinal fibrosis. Am J Pathol 179(5): 2660-2673.
-
Vasuri F, Resta L, Fittipaldi S, Malvi D, Pasquinelli G (2012) RUNX-1 and CD44 as markers of resident stem cell derivation in undifferentiated intimal sarcoma of pulmonary artery. Histopathology 61(4): 737-743.
-
Xavier S, Vasko R, Matsumoto K, Zullo JA, Chen R, et al. (2015) Curtailing endothelial TGF-β signaling is sufficient to reduce endothelial-mesenchymal transition and fibrosis in CKD. J Am Soc Nephrol 26(4): 817-829.
-
Morrell NW, Adnot S, Archer SL, Dupuis J, Lloyd Jones P, et al. (2009) Cellular and molecular basis of pulmonary arterial hypertension. J Am Coll Cardiol 30(54): 20-31.
-
Feng J, Zhang J, Jackson AO, Zhu X, Chen H, et al. (2017) Apolipoprotein A1 Inhibits the TGF-β1-Induced Endothelial-to-Mesenchymal Transition of Human Coronary Artery Endothelial Cells. Cardiology 137(3): 179-187.
-
Koćwin M, Jonakowski M, Przemęcka M, Panek M, Kuna P (2017) Selected bone morphogenetic proteins - the possibility of their use in the diagnostics and therapy of severe asthma. Adv Respir Med 85(2): 109-115.
-
Han C, Hong KH, Kim YH, Kim MJ, Song C, et al.(2013) SMAD1 deficiency in either endothelial or smooth muscle cells can predispose mice to pulmonary hypertension. Hypertension 61(5): 1044-1052.
-
Dierick F, Héry T, Hoareau-Coudert B, Mougenot N, Monceau V, et al.(2016) Resident PW1+ Progenitor Cells Participate in Vascular Remodeling During Pulmonary Arterial Hypertension. Circ Res 118(5): 822-833.
-
Chal J, Al Tanoury Z, Hestin M, Gobert B, Aivio S, et al. (2016) Generation of human muscle fibers and satellite- like cells from human pluripotent stem cells in vitro. Nat Protoc 11(10): 1833-1850.
-
Midgley AC, Duggal L, Jenkins R, Hascall V, Steadman R, et al. (2015) Hyaluronan regulates bone morphogenetic protein-7-dependent prevention and reversal of myofibroblast phenotype. J Biol Chem 290(18): 11218- 11234.
-
Ye L, Xue Y, Wang Y, Qi J, Xiao T (2017) Identification of ginseng root using quantitative X-ray microtomography. J Ginseng Res 41(3): 290-297.
-
Miao CP, Mi QL, Qiao XG, Zheng YK, Xu LH, et al. (2016) Rhizospheric fungi of Panax notoginseng: diversity and antagonism to host phytopathogens. J Ginseng Res 40(2): 127-134.
-
Nozaki T, Minaguchi J, Takehana K, Ueda H (2017) Anti- diabetic activities of traditional Chinese herbal medicine in streptozotocin-induced diabetic rats. Okajimas Folia Anat Jpn 93(4): 111-118.
- Superposition of Cryo-EM and AlphaFold Predictions of Dengue Antigen-Antibody Complexes
- Jugular-Applied Coherent Low-Level Laser Therapy Enhances Systemic Mitochondrial Metabolic Function and Antioxidant Response
- Role of OMC32 Polypeptide in Acrosin-Mediated Exocytosis during the Bovine Sperm Acrosome Reaction
- Association of Galectin-3 but not Laminin in Tamoxifen-Induced Growth Suppression in Breast Cancer MCF-7 Cells
- Effect of Different Wavelengths of Light on the Rate of Photosynthesis
- Nutritional, Therapeutic, and Environmental Effect of Oyster Mushrooms: An Editorial