Evaluation of Inflammatory Response after Treatment with the Biofield Energy Treated Proprietary Test Formulation on Combination of Cecal Slurry, LPS and E. coli Induced Systemic Inflammatory Response Syndrome (SIRS) in Sprague Dawley Rats
Sepsis is a systemic inflammatory response to a confirmed or suspected infection. The transition from sepsis to septic shock causes high rate of mortality. The aim of this experiment was to evaluate the anti-inflammatory potential of the Biofield Energy Treated Proprietary Test Formulation and Biofield Energy Treatment per se to the animals on Cecal Slurry, LPS and E. coli-induced systemic inflammatory response syndrome (SIRS) model in Sprague Dawley rats using serum inflammatory biomarkers. In this experiment, various inflammatory biomarkers such as C-reactive protein (CRP), leptin, nitric oxide (NO), substance polypeptide (substance P), matrix metalloproteinase-2 (MMP-2), and monocyte chemoattractant protein-1 (MCP-1) were analysed using ELISA assay. A test formulation was formulated including minerals (magnesium, zinc, calcium, selenium, and iron), vitamins (ascorbic acid, pyridoxine HCl, vitamin E, cyanocobalamin, and cholecalciferol), Panax ginseng extract, β-carotene, and cannabidiol isolate. The constituents of the test formulation were divided into two parts; one section was defined as the untreated test formulation, while the other portion of the test formulation and three group of animals received Biofield Energy Healing Treatment remotely for about 3 minutes by a renowned Biofield Energy Healer, Mr. Mahendra Kumar Trivedi. The results showed that the level of CRP was significantly (p≤0.001) reduced by 36.78%, 37.67%, 34.44%, 61.70%, and 43.37% in the G5 (Cecal Slurry, LPS and E. coli along with the Biofield Energy Treated test formulation); G6 (Cecal Slurry, LPS and E. coli along with Biofield Energy Treatment per se to animals from day -15); G7 (Cecal Slurry, LPS and E. coli along with the Biofield Energy Treated test formulation from day -15); G8 (Cecal Slurry, LPS and E. coli along with Biofield Energy Treatment per se plus the Biofield Energy Treated test formulation from day -15), and G9 (Cecal Slurry, LPS and E. coli along with Biofield Energy Treatment per se animals plus the untreated test formulation) groups, respectively as compared to the disease control (G2) group. Additionally, the level of leptin was significantly increased by 11.83% and 16.48% (p≤0.05) in the G5 and G7 groups, respectively as compared to the G2 group. The level of NO was increased by 25.97% in the G6 group as compared to the G2 group. The level of substance P was significantly decreased by 32.62% (p≤0.001), 11.89%, 30.5% (p≤0.001), 11.21%, and 15.64% in the G5, G6, G7, G8, and G9 groups, respectively as compared to the G2 group. Moreover, the level of MMP-2 was significantly decreased by 17.35% (p≤0.05) and 42.98% (p≤0.001) in the G8 and G9 groups, respectively as compared to the G2 group; while 28.43%, 50.62%, and 22.43% decreased in the G6, G8, and G9 groups, respectively as compared to the untreated test formulation group (G4). Additionally, the level of MCP-1 was significantly (p≤0.001) decreased by 53.42%, 53.47%, 55.30%, 54.58%, and 53.88% in the G5, G6, G7, G8, and G9 groups, respectively as compared to the G2 group. Overall, the data suggested anti-inflammatory potentials of the Biofield Energy Treated test formulation and Biofield Energy Treatment per se along with preventive measure on the animal with respect to various inflammatory conditions that might be beneficial various types of systemic inflammatory disorders specially sepsis, trauma, septic shock or any types of injuries. Therefore, the results showed the significant slowdown the inflammation-related disease progression and its complications/symptoms in the preventive Biofield Energy Treatment group per se and/or Biofield Energy Treated Test formulation groups (viz. G6, G7, G8, and G9) comparatively with the disease control group.
Introduction
Systemic inflammatory response syndrome (SIRS) is a complex pathophysiologic defense response of the body to a noxious stressor such as infection, trauma, burns, pancreatitis, surgery, acute inflammation, ischemia or reperfusion, or malignancy or any others injuries [1, 2]. Sepsis is an infection which can considered a systemic inflammatory response. Clinically, the Systemic Inflammatory Response Syndrome (SIRS) is identified by two or more symptoms including fever or hypothermia, tachycardia, tachypnoea and change in blood leucocyte count [3]. Sepsis is a systemic inflammatory response to a confirmed or suspected infection. The development from sepsis to septic shock represents a continuum with increasing mortality. Research in the last two decades explored that the inflammatory process is play a major role in the mechanism of different vital systems pathologies [4]. Proinflammatory cytokines affect nearly all tissues and organ systems. Leptin is an adipocyte-derived cytokine, which regulates the body’s energy balance. Apart from, it also help to promotes reproduction, haematopoiesis, HPA-axis endocrinology and angiogenesis [5]. It acts as a novel therapeutic target for immune response [6]. It is an important for early marker for the diagnosis and differentiation between sepsis and non-infectious systemic inflammatory response syndrome (SIRS) [7]. Substance P is secreted from nerves and inflammatory cells like macrophages, lymphocytes, eosinophils, and dendritic cells. Substance P act as a key mediator of inflammation and induced release of various inflammatory mediators like cytokines, oxygen radicals, arachidonic acid derivatives, and histamine and thus potentiates tissue injury, and stimulates further leukocyte recruitment, thereby amplifying the inflammatory response [8]. Metalloproteinases’ (MMP-2) expression was associated with the presence of erosions, architectural tissue changes, and inflammatory infiltration. Overexpression of metalloproteinases causes development of inflammatory disorders like Crohn’s disease (CD) and ulcerative colitis (UC), etc. [9]. Monocyte chemoattractant protein-1 (MCP-1) is one of the key chemokines responsible for migration and infiltration of monocytes/macrophages. Chemokines are released in response to the stimulation of proinflammatory cytokines where they play an important role in selectively recruiting monocytes, neutrophils, and lymphocytes [10].
Thus, in order to study the change in serum biomarkers in presence of Cecal Slurry, LPS and E. coli-induced systemic inflammatory response syndrome model in Sprague Dawley rats, a novel test formulation was designed with the combination of vital minerals (selenium, zinc, iron, calcium, and magnesium), essential vitamins (cyanocobalamin, ascorbic acid, pyridoxine HCl, vitamin E, and cholecalciferol), and nutraceuticals (β-carotene, Ginseng, cannabidiol isolate (CBD)). All the minerals and vitamins used in the test formulation have significant functional role to provide vital physiological roles [11]. Besides, cannabidiol itself has wide range of pharmacological profile and has been reported to role in different disorders [12, 13], while ginseng extract is regarded as the one of the best immune booster for overall immunity [14]. The present study was aimed to evaluate the anti-inflammatory potential of the Biofield Energy Treated Proprietary Test Formulation and Biofield Energy Treatment per se to the animals on Cecal Slurry, LPS and E. coli-induced systemic inflammatory response syndrome model in Sprague Dawley rats using serum biomarkers (cytokines). Biofield Energy Healing Treatment has been reported with significant effects against various disorders, and defined as one of the best Complementary and Alternative Medicine (CAM) treatment approach [15, 16, 17]. National Center for Complementary/ Alternative Medicine (NCCAM) recommended CAM with several clinical benefits as compared with the conventional treatment approach [18]. National Centre of Complementary and Integrative Health (NCCIH) accepted Biofield Energy Healing as a CAM health care approach in addition to other therapies such as deep breathing, natural products, Tai Chi, yoga, therapeutic touch, Johrei, Reiki, pranic healing, chiropractic/osteopathic manipulation, guided imagery, meditation, massage, homeopathy, hypnotherapy, special diets, relaxation techniques, movement therapy, mindfulness, Ayurvedic medicine, traditional Chinese herbs and medicines in biological systems [19, 20]. The Trivedi Effect®- Consciousness Energy Healing was scientifically reported on various disciplines such as in the material science [21, 22], agriculture science [23], microbiology [24, 25], biotechnology [26], and improved bioavailability of various compounds [27, 28], skin health [29, 30], nutraceuticals [31], cancer research [32], bone health [33, 34], overall human health and wellness. In this study, the authors sought to study the impact of the Biofield Energy Treatment (the Trivedi Effect®) on the given novel test formulation and Biofield Energy Treatment per se to the animals on serum biomarkers in presence of Cecal Slurry, LPS and E. coli-induced systemic inflammatory response syndrome model in Sprague Dawley Rats for the estimation of C-reactive protein (CRP), Leptin, Nitric oxide (NO), Substance polypeptide (Substance P), matrix metalloproteinase-2 (MMP-2), and monocyte chemoattractant protein-1 (MCP-1) using standard ELISA assay.
Material and Methods
Chemicals and Reagents
Pyridoxine hydrochloride (vitamin B6), zinc chloride, magnesium (II) gluconate, and β-carotene (retinol, provit A) were purchased from TCI, Japan. Cyanocobalamin (vitamin B12), calcium chloride, vitamin E (Alpha- Tocopherol), cholecalciferol (vitamin D3), iron (II) sulfate, and Carboxymethyl Cellulose Sodium were procured from Sigma-Aldrich, USA. Ascorbic acid (vitamin C) and sodium selenate were obtained from Alfa Aesar, India. Panax ginseng extract and Cannabidiol Isolate were obtained from Panacea Phytoextracts, India and Standard Hemp Company, USA, respectively. Dexamethasone was obtained from Clear synth, India. For the estimation of serum biomarker panel, specific ELISA kits were used such as for detection of CRP, Leptin, Nitric Oxide (NO), Substance P, MMP-2, and MCP-1 were procured from CUSABIO, USA.
Maintenance of Animal
Randomly breed male Sprague Dawley (SD) rats with body weight ranges from 200 to 300 gm were used in this study. The animals were purchased from M/s. Vivo Bio Tech, Hyderabad, India. Animals were randomly divided into nine groups based on their body weights consist of 10- 12 animals of each group. They were kept individually in sterilized polypropylene cages with stainless steel top grill having provision for holding pellet feed and drinking water bottle fitted with stainless steel sipper tube. The animals were maintained as per standard protocol throughout the experiment.
Consciousness Energy Healing Strategies
Each ingredient of the novel test formulation was divided into two parts. One part of the test compound did not receive any sort of treatment and were defined as the untreated or control sample. The second part of the test formulation was treated with the Trivedi Effect® - Energy of Consciousness Healing Treatment (Biofield Energy Treatment) by a renowned Biofield Energy Healer, Mr. Mahendra Kumar Trivedi under laboratory conditions for ~3 minutes. Besides, three group of animals also received Biofield Energy Healing Treatment (known as the Trivedi Effect®) by Mr. Mahendra Kumar Trivedi under similar laboratory conditions for ~3 minutes. The Biofield Energy Healer was located in the USA, however the test formulation were located in the research laboratory of Dabur Research Foundation, New Delhi, India. The energy transmission/Blessing (prayer) was done to the samples or animals remotely for about 3 minutes via online web-conferencing platform. After that, the Biofield Energy Treated samples was kept in the similar sealed condition and used as per the study plan. In the same manner, the control test formulation group was subjected to “sham” healer for ~3 minutes treatment, under the same laboratory conditions. The “sham” healer did not has any knowledge about the Biofield Energy Treatment. The Biofield Energy Treated animals were also taken back to experimental room for further proceedings.
Experimental Procedure
Seven days after acclimatization, animals were randomized and grouped based on the body weight. The test formulation was prepared freshly prior to dosing and administered to the animals using an oral intubation needle attached to an appropriately graduated disposable syringe. The dose volume was 10 mL/kg in morning and evening based on body weight. The experimental groups were divided as G1 as normal control (vehicle, 0.5% w/v CMC-Na); G2 as disease control (Cecal Slurry, LPS and E. coli + 0.5% CMC-Na); G3 as reference item (Cecal Slurry, LPS and E. coli + Dexamethasone); G4 includes Cecal Slurry, LPS and E. coli along with untreated test formulation; G5 as Cecal Slurry, LPS and E. coli along with the Biofield Energy Treated test formulation; G6 group includes Cecal Slurry, LPS and E. coli along with Biofield Energy Treatment per se to animals from day -15; G7 as Cecal Slurry, LPS and E. coli along with the Biofield Energy Treated test formulation from day -15; G8 group includes Cecal Slurry, LPS and E. coli along with Biofield Energy Treatment per se plus the Biofield Energy Treated test formulation from day -15, and G9 group denoted Cecal Slurry, LPS and E. coli along with Biofield Energy Treatment per se animals plus the untreated test formulation. Dosing for groups G7 and G8 were started on Day -15 and continued till end of the experiment. However, Group G1 to G5 and G9 animals were dosed with respective formulations from Day 1 and continued till the end of the experiment. Group G6 animals received Biofield Energy Treatment on Day-15 and were not dosed throughout the experimental period. At the end of the experimental period (8 weeks treatment), the animals were sacrifice and blood was collected and separate serum subjected for the estimation of CRP, Leptin, Nitric Oxide (NO), Substance P, MMP-2, and MCP-1.
Induction of Systemic Inflammatory Response Syndrome (SIRS) Model
A combination model of sepsis was developed in SD rats by administering Cecal slurry (from donor animals, intraperitoneally, at the dose of 400 mg/kg) in combination with LPS (at the dose of 100 µg/animal) and E. coli [Escherichia coli; 0.2 mL (2M CFU)/animal]). The animals were monitored for various parameters for up to 56 days after disease (SIRS) induction. Ten Donor (~20 weeks old) rats were anesthetized. A midline laparotomy was performed on them and the cecum was extruded. A 0.5 cm incision was made on the anti-mesenteric surface of the cecum, and the cecum was squeezed to expel the feces. The feces from different donor animals was collected and weighed. Immediately after collection, the feces were pooled, diluted 1:3 with 5% dextrose solution and filtered to get a homogeneous suspension. Bacterial viability in the cecal slurry was analyzed. Cecal slurry prepared from donor rats was injected intraperitoneally into experimental rats (G2 to G9) at the dose of 400 mg/kg within 2 hours of preparation. After 3 hours, lipopolysaccharide (LPS) at the dose of 100 µg/animal, and gram-negative viable bacteria such as E. coli [0.2 mL (2M CFU)/animal] were injected, intraperitoneally (G2 to G9).
Preparation of Sample for the Estimation of Serum Biomarkers
With the continued treatment to the respective groups of 8th week of the experimental period, all the animals were individually subjected for blood collection using retro-orbital route and the blood was collected in the plain vial, which was used for the separation of serum in all the animals of different experimental groups. The serum from all the groups was stored at -20°C for further estimation. Alternatively, aliquot all the samples and store samples at -20°C or -80°C. Avoid repeated freeze-thaw cycles, which may alter the level of cytokines during final calculations.
Estimation of Inflammatory Biomarkers in Serum
The serum from all the groups was subjected for the estimation of the level of inflammatory biomarkers such as CRP (CSB-E07922r), Leptin (CSB-E07433r), Nitric oxide (NO), Substance P (CSB-E08358r), MMP-2 (CSB-E07411r), and MCP-1 (CSB-E07429r). All the serum biomarker panel was estimation using ELISA method as per manufacturer’s recommended standard procedure. This was a quantitative method and the principle was based on the binding of antigen and antibody in sandwich manner assay.
Statistical Analysis
The data were represented as mean ± standard error of mean (SEM) and subjected to statistical analysis using Sigma-Plot statistical software (Version 11.0). For multiple comparison One-way analysis of variance (ANOVA) followed by post-hoc analysis by Dunnett’s test and for between two groups comparison Student’s t-test was performed. The p≤0.05 was considered as statistically significant.
Results and Discussion
Estimation of CRP in Serum
C-reactive protein (CRP) in serum was estimated in the presence of the test formulation and the data were graphically shown in Figure 1. The data suggested that the disease control (Cecal Slurry, LPS and E. coli + 0.5% CMC-Na) + 0.5% CMC) group (G2) showed value of CRP as 451.39 ± 29.58 ng/mL, which was increased by 208.76% as compared with the normal control (G1, 146.19 ± 8.84 ng/mL). However, positive control (Dexamethasone) treatment (G3) showed the level of serum CRP i.e. 161.78 ± 19.84 ng/mL, which was significantly (p≤0.001) decreased by 64.16% as compared to the G2 group. The level of CRP was significantly decreased by 13.94%, 36.78% (p≤0.001), 37.67% (p≤0.001), 34.44% (p≤0.001), 61.70% (p≤0.001), and 43.37% (p≤0.001) in the G4 (Cecal Slurry, LPS and E. coli along with untreated test formulation); G5 (Cecal Slurry, LPS and E. coli along with the Biofield Energy Treated test formulation); G6 (Cecal Slurry, LPS and E. coli along with Biofield Energy Treatment per se to animals from day -15); G7 (Cecal Slurry, LPS and E. coli + Biofield Energy Treated test formulation from day -15); G8 (Cecal Slurry, LPS and E. coli + Biofield Energy Treatment per se + Biofield Treated/Blessed test formulation from day -15), and G9 (Cecal Slurry, LPS and E. coli + Biofield Energy Treatment per se animals + untreated test formulation) groups, respectively as compared to the disease control (G2) group. Besides, the level of CRP was reduced by 26.54%, 27.57%, 23.82%, 55.5%, and 34.20% in the G5, G6, G7, G8, and G9 groups, respectively as compared to the untreated test formulation (G4). CRP is an inflammatory protein that increases at the sites of infection or inflammation. Various inflammatory conditions such as rheumatoid arthritis, cardiovascular diseases, and infection exhibits elevated expression CRP [35]. Apart from disease conditions, there are many factors that can alter the baseline of CRP levels including age, gender, smoking status, weight, lipid levels, and blood pressure [36]. Overall, in this experiment the Biofield Energy Treated test formulation and Biofield Energy Treatment per se reduced the level of CRP, which might be helpful for the management of various inflammatory disorders.
![Figure 1: The data suggested that the disease control (Cecal Slurry, LPS and E. coli + 0.5% CMC-Na) + 0.5% CMC) group (G2) showed value of CRP as 451.39 ± 29.58 ng/mL, which was increased by 208.76% as compared with the normal control (G1, 146.19 ± 8.84 ng/mL). However, positive control (Dexamethasone) treatment (G3) showed the level of serum CRP i.e. 161.78 ± 19.84 ng/mL, which was significantly (p≤0.001) decreased by 64.16% as compared to the G2 group. The level of CRP was significantly decreased by 13.94%, 36.78% (p≤0.001), 37.67% (p≤0.001), 34.44% (p≤0.001), 61.70% (p≤0.001), and 43.37% (p≤0.001) in the G4 (Cecal Slurry, LPS and E. coli along with untreated test formulation); G5 (Cecal Slurry, LPS and E. coli along with the Biofield Energy Treated test formulation); G6 (Cecal Slurry, LPS and E. coli along with Biofield Energy Treatment per se to animals from day -15); G7 (Cecal Slurry, LPS and E. coli + Biofield Energy Treated test formulation from day -15); G8 (Cecal Slurry, LPS and E. coli + Biofield Energy Treatment per se + Biofield Treated/Blessed test formulation from day -15), and G9 (Cecal Slurry, LPS and E. coli + Biofield Energy Treatment per se animals + untreated test formulation) groups, respectively as compared to the disease control (G2) group. Besides, the level of CRP was reduced by 26.54%, 27.57%, 23.82%, 55.5%, and 34.20% in the G5, G6, G7, G8, and G9 groups, respectively as compared to the untreated test formulation (G4). CRP is an inflammatory protein that increases at the sites of infection or inflammation. Various inflammatory conditions such as rheumatoid arthritis, cardiovascular diseases, and infection exhibits elevated expression CRP [35]. Apart from disease conditions, there are many factors that can alter the baseline of CRP levels including age, gender, smoking status, weight, lipid levels, and blood pressure [36]. Overall, in this experiment the Biofield Energy Treated test formulation and Biofield Energy Treatment per se reduced the level of CRP, which might be helpful for the management of various inflammatory disorders.](/fulltextimages/7645/fig_1.png)
Figure 1: Estimation the level of serum C-reactive protein (CRP) after treatment with Biofield Blessed/Unblessed proprietary test formulation and Biofield Energy Blessing to Sprague Dawley rats. G1 as normal control (vehicle, 0.5% w/v CMC-Na); G2 as disease control (Cecal Slurry, LPS and E. coli + 0.5% CMC-Na); G3 as reference item (Cecal Slurry, LPS and E. coli + Dexamethasone); G4 includes Cecal Slurry, LPS and E. coli along with untreated test formulation; G5 as Cecal Slurry, LPS and E. coli along with the Biofield Energy Treated test formulation; G6 group includes Cecal Slurry, LPS and E. coli + Biofield Energy Treatment per se to animals from day -15; G7 as Cecal Slurry, LPS and E. coli + Biofield Energy Treated test formulation from day -15; G8 group includes Cecal Slurry, LPS and E. coli + Biofield Energy Treatment per se + Biofield Treated/Blessed test formulation from day -15, and G9 group denoted Cecal Slurry, LPS and E. coli + Biofield Energy Treatment per se animals + untreated test formulation. Values are presented as mean ± SEM (n=6-9).
Estimation of Serum Leptin
Expression the level of serum leptin after administration of Biofield Treated/Untreated test formulation and Biofield Energy Healing/Blessing to Sprague Dawley rats, and the results were graphically presented in Figure 2. The disease control (Cecal Slurry, LPS and E. coli + 0.5% CMC-Na) + 0.5% CMC) group (G2) and the positive control group (G3) showed value of leptin as 3.55 ± 0.12 ng/mL and 3.03 ± 0.38 ng/mL, respectively. The level of leptin was significantly increased by 23.05%, 11.83%, 16.48% (p≤0.05), and 1.81% in the G4 (Cecal Slurry, LPS and E. coli along with untreated test formulation); G5 (Cecal Slurry, LPS and E. coli along with the Biofield Energy Treated test formulation); G7 (Cecal Slurry, LPS and E. coli along with the Biofield Energy Treated test formulation from day -15); and G9 (Cecal Slurry, LPS and E. coli along with Biofield Energy Treatment per se animals plus the untreated test formulation) groups, respectively, as compared to the disease control group (G2). Leptin is a metabolic hormone that functions almost similar to proinflammatory adipokine and modulates the immune response and inflammation. The leptin production is increased during any types of infections and inflammations which suggests that it governs the “inflammatory-immune response” and the “host-defense mechanisms” [37, 38]. Several studies have also implicated leptin causes various autoimmune inflammatory conditions, such as encephalomyelitis, type-1 diabetes, rheumatoid arthritis, osteoarthritis and intestinal inflammation [39]. Therefore, in this experiment the Biofield Energy Treated test formulation and Biofield Energy Treatment per se reduced the level of leptin, which could be beneficial in the inflammatory disease conditions.
![Figure 2: The disease control (Cecal Slurry, LPS and E. coli + 0.5% CMC-Na) + 0.5% CMC) group (G2) and the positive control group (G3) showed value of leptin as 3.55 ± 0.12 ng/mL and 3.03 ± 0.38 ng/mL, respectively. The level of leptin was significantly increased by 23.05%, 11.83%, 16.48% (p≤0.05), and 1.81% in the G4 (Cecal Slurry, LPS and E. coli along with untreated test formulation); G5 (Cecal Slurry, LPS and E. coli along with the Biofield Energy Treated test formulation); G7 (Cecal Slurry, LPS and E. coli along with the Biofield Energy Treated test formulation from day -15); and G9 (Cecal Slurry, LPS and E. coli along with Biofield Energy Treatment per se animals plus the untreated test formulation) groups, respectively, as compared to the disease control group (G2). Leptin is a metabolic hormone that functions almost similar to proinflammatory adipokine and modulates the immune response and inflammation. The leptin production is increased during any types of infections and inflammations which suggests that it governs the “inflammatory-immune response” and the “host-defense mechanisms” [37, 38]. Several studies have also implicated leptin causes various autoimmune inflammatory conditions, such as encephalomyelitis, type-1 diabetes, rheumatoid arthritis, osteoarthritis and intestinal inflammation [39]. Therefore, in this experiment the Biofield Energy Treated test formulation and Biofield Energy Treatment per se reduced the level of leptin, which could be beneficial in the inflammatory disease conditions.](/fulltextimages/7645/fig_2.png)
Figure 2: Expression the level of serum leptin after administration of Biofield Treated/Untreated test formulation and Biofield Energy Healing/Blessing to Sprague Dawley rats. G1 as normal control (vehicle, 0.5% w/v CMC-Na); G2 as disease control (Cecal Slurry, LPS and E. coli + 0.5% CMC-Na); G3 as reference item (Cecal Slurry, LPS and E. coli + Dexamethasone); G4 includes Cecal Slurry, LPS and E. coli along with untreated test formulation; G5 as Cecal Slurry, LPS and E. coli along with the Biofield Energy Treated test formulation; G6 group includes Cecal Slurry, LPS and E. coli + Biofield Energy Treatment per se to animals from day -15; G7 as Cecal Slurry, LPS and E. coli + Biofield Energy Treated test formulation from day -15; G8 group includes Cecal Slurry, LPS and E. coli + Biofield Energy Treatment per se + Biofield Treated/Blessed test formulation from day -15, and G9 group denoted Cecal Slurry, LPS and E. coli + Biofield Energy Treatment per se animals + untreated test formulation. Values are presented as mean ± SEM (n=6-9). *p≤0.05 vs. G2.
Estimation of Serum Nitric Oxide (NO)
The level of serum nitric oxide (NO) was detected in all the experimental groups and was presented in Figure 3. The data suggested that the disease control (Cecal Slurry, LPS and E. coli + 0.5% CMC-Na) group (G2) showed value of NO as 34.63 ± 2.93 µM/mL, which was decreased by 37.35% as compared with the normal control (G1, 55.27 ± 6.10 µM/mL) group.
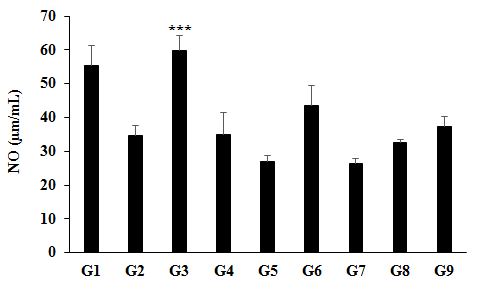
Figure 3: Expression the level of serum nitric oxide (NO) after administration of Biofield Treated/Untreated test formulation and Biofield Energy Healing/Blessing to Sprague Dawley rats. G1 as normal control (vehicle, 0.5% w/v CMC-Na); G2 as disease control (Cecal Slurry, LPS and E. coli + 0.5% CMC-Na); G3 as reference item (Cecal Slurry, LPS and E. coli + Dexamethasone); G4 includes Cecal Slurry, LPS and E. coli along with untreated test formulation; G5 as Cecal Slurry, LPS and E. coli + Biofield Energy Treated test formulation; G6 group includes Cecal Slurry, LPS and E. coli + Biofield Energy Treatment per se to animals from day -15; G7 as Cecal Slurry, LPS and E. coli + Biofield Energy Treated test formulation from day -15; G8 group includes Cecal Slurry, LPS and E. coli + Biofield Energy Treatment per se + Biofield Treated/Blessed proprietary test formulation from day -15, and G9 group denoted Cecal Slurry, LPS and E. coli + Biofield Energy Treatment per se animals + untreated test formulation. Values are presented as mean ± SEM (n=6-9). ***p≤0.001 vs. G2.
While, the positive control (Dexamethasone) treatment (G3) was significantly (p≤0.001) increased the level of NO by 72.65% i.e. 59.78 ± 4.37 µM/mL as compared to the G2 group. The level of NO was increased by 25.97% and 7.7% in the G6 (Cecal Slurry, LPS and E. coli along with Biofield Energy Treatment per se to animals from day -15) and G9 (Cecal Slurry, LPS and E. coli along with Biofield Energy Treatment per se animals plus the untreated test formulation) groups, respectively as compared to the disease control (G2) group. Moreover, the level of NO was increased by 24.64% and 6.56% in the G6 and G9 groups, respectively with reference to untreated test formulation (G4). Several experimental studies have stated the beneficial effects of NO through modulation of the Systemic Inflammatory Response Syndrome (SIRS) [40]. Overall, here the Biofield Energy Treated test formulation and Biofield Energy Treatment per se has increased the level of NO, which could be beneficial in the inflammatory symptoms.
Estimation of Serum Substance P
Expression the level of serum Substance P after administration of Biofield Treated/Untreated test formulation and Biofield Energy Healing/Blessing to Sprague Dawley rats, and the results are graphically presented in the Figure 4. The disease control (Cecal Slurry, LPS and E. coli + 0.5% CMC-Na) group (G2) showed value of substance P as 221.34 ± 14.3 pg/mL, which was increased by 99.09% as compared with the normal control (G1, 111.17 ± 6.74 pg/mL). Further, the positive control (Dexamethasone) treatment (G3) showed a significant (p≤0.001) decreased serum substance P level by 44.98% i.e., 121.77 ± 8.49 pg/ mL as compared to the G2 group. The level of substance P was significantly decreased by 42.20% (p≤0.001), 32.62% (p≤0.001), 11.89%, 30.5% (p≤0.001), 11.21%, and 15.64% in the G4 (Cecal Slurry, LPS and E. coli along with untreated test formulation); G5 (Cecal Slurry, LPS and E. coli + Biofield Energy Treated test formulation); G6 (Cecal Slurry, LPS and E. coli + Biofield Energy Treatment/Blessing to animals from day -15); G7 (Cecal Slurry, LPS and E. coli + Biofield Energy Treated/Blessed test formulation from day -15); G8 (Cecal Slurry, LPS and E. coli + Biofield Energy Treatment per se + Biofield Energy Treated test formulation from day -15), and G9 (Cecal Slurry, LPS and E. coli + Biofield Energy Treatment per se animals + untreated test formulation) groups, correspondingly with reference to disease control (G2) group. Substance P is released by nerves and inflammatory cells and acts by binding to the neurokinin‐1 receptor (NK‐1R) [41]. Substance P is one of the key factor and/or mediator of inflammatory condition and it plays a vital role in the modulation of inflammatory response [42]. All-inclusive, the Biofield Energy Treated/Blessed test formulation and Biofield Energy Treatment/Blessing per se significantly reduced the level of substance P, which could be beneficial to combat inflammatory disease conditions.
![Figure 4: The disease control (Cecal Slurry, LPS and E. coli + 0.5% CMC-Na) group (G2) showed value of substance P as 221.34 ± 14.3 pg/mL, which was increased by 99.09% as compared with the normal control (G1, 111.17 ± 6.74 pg/mL). Further, the positive control (Dexamethasone) treatment (G3) showed a significant (p≤0.001) decreased serum substance P level by 44.98% i.e., 121.77 ± 8.49 pg/ mL as compared to the G2 group. The level of substance P was significantly decreased by 42.20% (p≤0.001), 32.62% (p≤0.001), 11.89%, 30.5% (p≤0.001), 11.21%, and 15.64% in the G4 (Cecal Slurry, LPS and E. coli along with untreated test formulation); G5 (Cecal Slurry, LPS and E. coli + Biofield Energy Treated test formulation); G6 (Cecal Slurry, LPS and E. coli + Biofield Energy Treatment/Blessing to animals from day -15); G7 (Cecal Slurry, LPS and E. coli + Biofield Energy Treated/Blessed test formulation from day -15); G8 (Cecal Slurry, LPS and E. coli + Biofield Energy Treatment per se + Biofield Energy Treated test formulation from day -15), and G9 (Cecal Slurry, LPS and E. coli + Biofield Energy Treatment per se animals + untreated test formulation) groups, correspondingly with reference to disease control (G2) group. Substance P is released by nerves and inflammatory cells and acts by binding to the neurokinin‐1 receptor (NK‐1R) [41]. Substance P is one of the key factor and/or mediator of inflammatory condition and it plays a vital role in the modulation of inflammatory response [42]. All-inclusive, the Biofield Energy Treated/Blessed test formulation and Biofield Energy Treatment/Blessing per se significantly reduced the level of substance P, which could be beneficial to combat inflammatory disease conditions.](/fulltextimages/7645/fig_4.png)
Figure 4: Expression the level of serum Substance P after administration of Biofield Treated/Untreated test formulation and Biofield Energy Healing/Blessing to Sprague Dawley rats. G1 as normal control (vehicle, 0.5% w/v CMC-Na); G2 as disease control (Cecal Slurry, LPS and E. coli + 0.5% CMC-Na); G3 as reference item (Cecal Slurry, LPS and E. coli + Dexamethasone); G4 includes Cecal Slurry, LPS and E. coli along with untreated test formulation; G5 as Cecal Slurry, LPS and E. coli + Biofield Energy Treated test formulation; G6 group includes Cecal Slurry, LPS and E. coli + Biofield Energy Treatment per se to animals from day -15; G7 as Cecal Slurry, LPS and E. coli + Biofield Energy Treated test formulation from day -15; G8 group includes Cecal Slurry, LPS and E. coli + Biofield Energy Treatment per se + Biofield Treated/Blessed proprietary test formulation from day -15, and group G9 denoted as Cecal Slurry, LPS and E. coli + Biofield Energy Treatment per se animals + untreated test formulation. Values are presented as mean ± SEM (n=6-9). ***p≤0.001 vs. G2.
Estimation of Serum Matrix Metalloproteinase-2 (MMP-2)
Expression the level of serum matrix metalloproteinase-2 (MMP-2) after administration of Biofield Treated/Untreated test formulation and Biofield Energy Healing/Blessing to Sprague Dawley rats, and the results were graphically presented in Figure 5. The disease control (Cecal Slurry, LPS and E. coli + 0.5% CMC-Na) group (G2) showed value of MMP- 2 as 9.49 ± 0.48 ng/mL, which was increased by 135.41% as compared with the normal control (G1, 4.03 ± 0.21 ng/mL). Further, the positive control (Dexamethasone) treatment (G3) showed a significant (p≤0.001) decreased serum MMP- 2 level by 42.68% i.e., 5.44 ± 0.41 ng/mL as compared to the G2 group. The level of MMP-2 was significantly decreased by 17.35% (p≤0.05), 42.98% (p≤0.001), and 10.41% in the G6 (Cecal Slurry, LPS and E. coli + Biofield Treatment/Blessing directly to animals from day -15); G8 (Cecal Slurry, LPS and E. coli along with Biofield Energy Treatment per se + Biofield Energy Treated test formulation from day -15), and G9 (Cecal Slurry, LPS and E. coli along with Biofield Energy Treatment per se animals plus the untreated test formulation) groups, respectively, as compared to the disease control group (G2). Similarly, MMP-2 level was decreased by 6.36%, 28.43%, 1.41%, 50.62%, and 22.43% in the G5, G6, G7, G8, and G9 groups, respectively as compared to the untreated test formulation (G4). Matrix metalloproteinases as modulators of inflammation and its expression was increased in the inflammatory cells and modulates various inflammatory mediators like cytokines and chemokines in the inflamed tissues that regulate the movement of leukocytes at sites of infection or injury [43]. Overall, in this experiment the Biofield Energy Treated test formulation and Biofield Energy Treatment per se significantly reduced the level of MMP- 2, which could regulate the inflammatory conditions and simultaneously reduce the risks of inflammatory diseases.
![Figure 5: The disease control (Cecal Slurry, LPS and E. coli + 0.5% CMC-Na) group (G2) showed value of MMP- 2 as 9.49 ± 0.48 ng/mL, which was increased by 135.41% as compared with the normal control (G1, 4.03 ± 0.21 ng/mL). Further, the positive control (Dexamethasone) treatment (G3) showed a significant (p≤0.001) decreased serum MMP- 2 level by 42.68% i.e., 5.44 ± 0.41 ng/mL as compared to the G2 group. The level of MMP-2 was significantly decreased by 17.35% (p≤0.05), 42.98% (p≤0.001), and 10.41% in the G6 (Cecal Slurry, LPS and E. coli + Biofield Treatment/Blessing directly to animals from day -15); G8 (Cecal Slurry, LPS and E. coli along with Biofield Energy Treatment per se + Biofield Energy Treated test formulation from day -15), and G9 (Cecal Slurry, LPS and E. coli along with Biofield Energy Treatment per se animals plus the untreated test formulation) groups, respectively, as compared to the disease control group (G2). Similarly, MMP-2 level was decreased by 6.36%, 28.43%, 1.41%, 50.62%, and 22.43% in the G5, G6, G7, G8, and G9 groups, respectively as compared to the untreated test formulation (G4). Matrix metalloproteinases as modulators of inflammation and its expression was increased in the inflammatory cells and modulates various inflammatory mediators like cytokines and chemokines in the inflamed tissues that regulate the movement of leukocytes at sites of infection or injury [43]. Overall, in this experiment the Biofield Energy Treated test formulation and Biofield Energy Treatment per se significantly reduced the level of MMP- 2, which could regulate the inflammatory conditions and simultaneously reduce the risks of inflammatory diseases.](/fulltextimages/7645/fig_5.png)
Figure 5: Expression the level of serum matrix metalloproteinase-2 (MMP-2) after administration of Biofield Treated/ Untreated test formulation and Biofield Energy Healing/Blessing to Sprague Dawley rats. G1 as normal control (vehicle, 0.5% w/v CMC-Na); G2 as disease control (Cecal Slurry, LPS and E. coli + 0.5% CMC-Na); G3 as reference item (Cecal Slurry, LPS and E. coli + Dexamethasone); G4 includes Cecal Slurry, LPS and E. coli along with untreated test formulation; G5 as Cecal Slurry, LPS and E. coli along with the Biofield Energy Treated test formulation; G6 group includes Cecal Slurry, LPS and E. coli + Biofield Energy Treatment per se to animals from day -15; G7 as Cecal Slurry, LPS and E. coli + Biofield Energy Treated test formulation from day -15; G8 group includes Cecal Slurry, LPS and E. coli + Biofield Energy Treatment per se + Biofield Treated/ Blessed test formulation from day -15, and G9 group denoted Cecal Slurry, LPS and E. coli + Biofield Energy Treatment per se animals plus the untreated test formulation. Values are presented as mean ± SEM (n=6-9). *p≤0.05 and ***p≤0.001 vs. G2.
Estimation of Serum Monocyte Chemoattractant Protein-1 (MCP-1)
Monocyte chemoattractant protein-1 (MCP-1) is a potent chemoattractant for monocytes and macrophages, and responsible for multiple inflammatory diseases, act as a potential target for the treatment of inflammatory disorders [44]. The level of serum MCP-1 was detected in all the experimental groups and the data were presented in Figure 6. The disease control (Cecal Slurry, LPS and E. coli + 0.5% CMC-Na) group (G2) showed value of MCP-1 as 705.03 ± 35.14 pg/mL, which was increased by 115.46% as compared with the normal control (G1, 327.21 ± 12.42 pg/mL). Further, the positive control (Dexamethasone) treatment (G3)
showed a significant (p≤0.001) decrease the level of serum MCP-1 by 47.29% i.e., 371.64 ± 10.70 pg/mL as compared to the G2 group. The level of MCP-1 was significantly (p≤0.001) decreased by 53.42%, 53.47%, 55.30%, 54.58%, and 53.88% in the G5 (Cecal Slurry, LPS and E. coli + Biofield Energy Treated test formulation); G6 (Cecal Slurry, LPS and E. coli + Biofield Energy Treatment per se to animals from day -15); G7 (Cecal Slurry, LPS and E. coli + Biofield Energy Treated test formulation from day -15); G8 (Cecal Slurry, LPS and E. coli + Biofield Energy Treatment per se + Biofield Treated/ Blessed test formulation from day -15), and G9 (Cecal Slurry, LPS and E. coli + Biofield Energy Treatment per se animals + untreated test formulation) groups, respectively, as compared to the disease control group (G2). Similarly, MCP- 1 level was decreased by 46.55%, 46.61%, 48.71%, 47.88%, and 47.07% in the G5, G6, G7, G8, and G9 groups, respectively as compared to the untreated test formulation (G4). Overall, here the Biofield Energy Treated test formulation and Biofield Energy Treatment per se reduced the level of MCP- 1, which could be beneficial in the inflammatory symptoms.
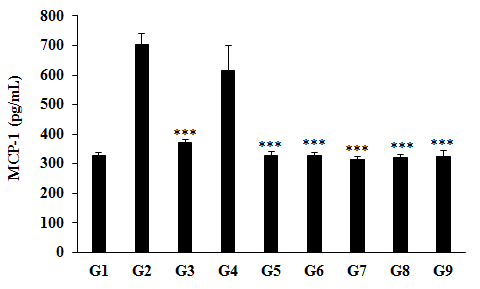
Figure 6: Expression the level of serum MCP-1 after administration of Biofield Treated/Untreated test formulation and Biofield Energy Healing/Blessing to Sprague Dawley rats. G1 as normal control (vehicle, 0.5% w/v CMC-Na); G2 as disease control (Cecal Slurry, LPS and E. coli + 0.5% CMC-Na); G3 as reference item (Cecal Slurry, LPS and E. coli + Dexamethasone); G4 includes Cecal Slurry, LPS and E. coli along with untreated test formulation; G5 as Cecal Slurry, LPS and E. coli along with the Biofield Energy Treated test formulation; G6 group includes Cecal Slurry, LPS and E. coli along with Biofield Energy Treatment per se to animals from day -15; G7 as Cecal Slurry, LPS and E. coli + Biofield Energy Treated test formulation from day -15; G8 group includes Cecal Slurry, LPS and E. coli + Biofield Energy Treatment per se + Biofield Energy Treated test formulation from day -15, and G9 group denoted Cecal Slurry, LPS and E. coli + Biofield Energy Treatment per se animals plus the untreated test formulation. Values are presented as mean ± SEM (n=6-9). ***p≤0.001 vs. G2.
Experiment includes four preventive maintenance groups (G6, G7, G8 and G9). The findings showed the significant slowdown of inflammation-related symptoms and also reduced the chances of disease susceptibility. All- inclusive, it indicate that the Trivedi Effect® was found to be most effective and benefited to protect different kinds of diseases and also improve the overall health and quality of life.
Conclusion
Inflammatory biomarkers like C-reactive protein (CRP), leptin, nitric oxide (NO), substance polypeptide (substance P), matrix metalloproteinase-2 (MMP-2), and monocyte chemoattractant protein-1 (MCP-1) were estimated and compared with respect to the disease control (G2) as well as untreated test formulation group (G4). Serum CRP level was significantly (p≤0.001) reduced by 36.78%, 37.67%, 34.44%, 61.70%, and 43.37% in the G5 (Cecal Slurry, LPS and E. coli along with the Biofield Energy Treated test formulation); G6 (Cecal Slurry, LPS and E. coli + Biofield Treatment/Blessing directly to animals from day -15); G7 (Cecal Slurry, LPS and E. coli + Biofield Energy Treated test formulation from day -15); G8 (Cecal Slurry, LPS and E. coli + Biofield Energy Treatment per se + Biofield Energy Treated test formulation from day -15), and G9 (Cecal Slurry, LPS and E. coli + Biofield Energy Treatment per se animals + untreated test formulation) groups, respectively as compared to the disease control (G2)
group. Leptin was significantly (p≤0.05) decreased by 16.48% in the G7 group as compared to the G2 group. Moreover, the level of NO was increased by 25.97% in the G6 group as compared to the G2 group. Additionally, substance P was significantly decreased by 32.62% (p≤0.001), 11.89%, 30.5% (p≤0.001), 11.21%, and 15.64% in G5, G6, G7, G8, and G9 groups, correspondingly with reference to G2 group. Further, MMP-2 was significantly decreased by 17.35% (p≤0.05) and 42.98% (p≤0.001) in the G8 and G9 groups, respectively as compared to the G2 group; while 28.43%, 50.62%, and 22.43% decreased in G6, G8, and G9 groups, correspondingly as compared to the untreated test formulation group (G4). MCP-1 was significantly (p≤0.001) decreased by 53.42%, 53.47%, 55.30%, 54.58%, and 53.88% in the G5, G6, G7, G8, and G9 groups, respectively as compared to the G2 group. Altogether, the Biofield Energy Treated test formulation and Biofield Energy Healing Treatment (the Trivedi Effect®) per se showed fruitful results with respect to different inflammatory biomarkers in the preventive maintenance group, G6 as well as other preventive maintenance groups (G7, G8, and G9) in Cecal Slurry, LPS and E. coli-induced systemic inflammatory response syndrome model rat model study. It also helped to slowdown the inflammatory disease progression and disease-related complications. The study data showed that Biofield Energy Treated Test formulation and Biofield Energy Treatment per se would be one of the best treatment strategies to prevent the manifestation of diseases. Thus, the Biofield Energy Treatment might act as a preventive maintenance therapy to maintain and improve the overall health and quality of life and simultaneously reduce the severity of acute/chronic diseases. The test formulation can also be used against rheumatoid arthritis (RA), fibromyalgia, aplastic anaemia, Addison disease (AD), multiple sclerosis, myasthenia gravis, psoriasis, Crohn’s disease, ulcerative colitis, dermatitis, hepatitis, Parkinson’s, stroke, etc.
Acknowledgements
The authors are grateful to Dabur Research Foundation, Trivedi Science, Trivedi Global, Inc., and Trivedi Master Wellness for the assistance and support during the work.
References
-
Chakraborty RK, Burns B (2020) Systemic Inflammatory Response Syndrome. StatPearls.
-
Balk RA (2014) Systemic inflammatory response syndrome (SIRS): Where did it come from and is it still relevant today?. Virulence 5(1): 20-26.
-
Comstedt P, Storgaard M, Lassen AT (2009) The systemic inflammatory response syndrome (SIRS) in acutely hospitalised medical patients: A cohort study. Scand J Trauma Resusc Emerg Med 17: 67.
-
Szekely Y, Arbel Y (2018) A review of interleukin-1 in heart disease: Where do we stand today?. Cardiol Ther 7(1): 25-44.
-
Waelput W, Brouckaert P, Broekaert D, Tavernier J (2002) A role for leptin in the systemic inflammatory response syndrome (SIRS) and in immune response. Curr Drug Targets Inflamm Allergy 1(3): 277-289.
-
Matarese G, Sanna V, Fontana S, Zappacosta S (2002) Leptin as a novel therapeutic target for immune intervention. Curr Drug Targets Inflamm Allergy 1(1): 13-22.
-
Bracho Riquelme RL, Reyes Romero MA (2010) Leptin in sepsis: A well-suited biomarker in critically ill patients? Crit Care 14(2): 138.
-
Holzer P, Holzer Petsche U (1997) Tachykinins in the gut. Part II. Roles in neural excitation, secretion, and inflammation. Pharmacol Ther 73(3): 219-263.
-
Jakubowska K, Pryczynicz A, Iwanowicz P, Niewiński A, Maciorkowska E, et al. (2016) Expressions of matrix metalloproteinases (MMP-2, MMP-7, and MMP-9) and their inhibitors (TIMP-1, TIMP-2) in inflammatory bowel diseases. Gastroenterol Res Pract 2016: 2456179.
-
Deshmane SL, Kremlev S, Amini S, Sawaya BE (2009) Monocyte chemoattractant protein-1 (MCP-1): An overview. J Interferon Cytokine Res 29(6): 313-326.
-
Beard JL, Connor JR (2003) Iron status and neural functioning. Ann Rev Nutr 23: 41-58.
-
Peres FF, Lima AC, Hallak JEC, Crippa JA, Silva RH, et al. (2018) Cannabidiol as a promising strategy to treat and prevent movement disorders? Front Pharmacol 9: 482.
-
Nagarkatti P, Pandey R, Rieder SA, Hegde VL, Nagarkatti M (2009) Cannabinoids as novel anti-inflammatory drugs. Future Med Chem 1(7): 1333-1349.
-
Kang S, Min H (2012) Ginseng, the ‘Immunity Boost’: The effects of Panax ginseng on immune system. J Ginseng Res 36(4): 354-368.
-
Maizes V, Rakel D, Niemiec C (2009) Integrative medicine and patient-centered care. Explore (NY) 5(5): 277-289.
-
Bischof M, Del Giudice E (2013) Communication and the emergence of collective behavior in living organisms: A quantum approach. Mol Biol Int 2013: 987549.
-
Cassidy CM (2004) What does it mean to practice an energy medicine?. J Altern Complement Med 10(1): 79- 81.
-
Barnes PM, Bloom B, Nahin RL (2008) Complementary and alternative medicine use among adults and children: United States, 2007. Natl Health Stat Report 12: 1-23.
-
Fan K wai (2005) National Center for Complementary and Alternative Medicine Website. J Med Libr Assoc 93: 410-412.
-
Wisneski L, Anderson L (2005) The Scientific Basis of Integrative Medicine. Evid Based Complement Alternat Med 2(2): 257-259.
-
Trivedi MK, Tallapragada RM (2008) A transcendental to changing metal powder characteristics. Met Powder Rep 63(9): 22-28,31.
-
Trivedi MK, Nayak G, Patil S, Tallapragada RM, Latiyal O (2015) Studies of the atomic and crystalline characteristics of ceramic oxide nano powders after bio field treatment. Ind Eng Manage 4(3): 161.
-
Trivedi MK, Branton A, Trivedi D, Nayak G, Mondal SC, et al. (2015) Morphological characterization, quality, yield and DNA fingerprinting of biofield energy treated alphonso mango (Mangifera indica L.). Journal of Food and Nutrition Sciences 3: 245-250.
-
Trivedi MK, Branton A, Trivedi D, Nayak G, Charan S, et al. (2015) Phenotyping and 16S rDNA analysis after biofield treatment on Citrobacter braakii: A urinary pathogen. J Clin Med Genom 3: 129.
-
Trivedi MK, Patil S, Shettigar H, Mondal SC, Jana S (2015) Evaluation of biofield modality on viral load of Hepatitis B and C viruses. J Antivir Antiretrovir 7(3): 083-088.
-
Nayak G, Altekar N (2015) Effect of biofield treatment on plant growth and adaptation. J Environ Health Sci 1: 1-9.
-
Branton A, Jana S (2017) The influence of energy of consciousness healing treatment on low bioavailable resveratrol in male Sprague Dawley rats. International Journal of Clinical and Developmental Anatomy 3(3): 9-15.
-
Branton A, Jana S (2017) The use of novel and unique biofield energy healing treatment for the improvement of poorly bioavailable compound, berberine in male Sprague Dawley rats. American Journal of Clinical and Experimental Medicine 5(4): 138-144.
-
Kinney JP, Trivedi MK, Branton A, Trivedi D, Nayak G, et al. (2017) Overall skin health potential of the biofield energy healing based herbomineral formulation using various skin parameters. American Journal of Life Sciences 5(2): 65-74.
-
Singh J, Trivedi MK, Branton A, Trivedi D, Nayak G, et al. (2017) Consciousness energy healing treatment based herbomineral formulation: A safe and effective approach for skin health. American Journal of Pharmacology and Phytotherapy 2(1): 1-10.
-
Trivedi MK, Branton A, Trivedi D, Nayak G, Plikerd WD, et al. (2017) A systematic study of the biofield energy healing treatment on physicochemical, thermal, structural, and behavioral properties of magnesium gluconate. International Journal of Bioorganic Chemistry 2(3): 135-145.
-
Trivedi MK, Patil S, Shettigar H, Mondal SC, Jana S (2015) The potential impact of biofield treatment on human brain tumor cells: A time-lapse video microscopy. J Integr Oncol 4(3): 141.
-
Anagnos D, Trivedi K, Branton A, Trivedi D, Nayak G, et al. (2018) Influence of biofield treated vitamin D3 on proliferation, differentiation, and maturation of bone- related parameters in MG-63 cell-line. International Journal of Biomedical Engineering and Clinical Science 4(1): 6-14.
-
Lee AC, Trivedi K, Branton A, Trivedi D, Nayak G, et al. (2018) The potential benefits of biofield energy treated vitamin D3 on bone mineralization in human bone osteosarcoma cells (MG-63). International Journal of Nutrition and Food Sciences 7(1): 30-38.
-
Du Clos TW, Mold C (2004) C-reactive protein: An activator of innate immunity and a modulator of adaptive immunity. Immunol Res 30(3): 261-77.
-
Hage FG, Szalai AJ (2007) C-reactive protein gene polymorphisms, C-reactive protein blood levels, and cardiovascular disease risk. J Am Coll Cardiol 50(12): 1115-1122.
-
Otero M, Lago R, Lago F, Casanueva FF, Dieguez C, et al. (2005) Leptin, from fat to inflammation: Old questions and new insights. FEBS Lett 579(2): 295-301.
-
Lago R, Gómez R, Lago F, Gómez Reino J, Gualillo O (2008) Leptin beyond body weight regulation--current concepts concerning its role in immune function and inflammation. Cell Immunol 252(1-2): 139-145.
-
Otero M, Lago R, Gomez R, Dieguez C, Lago F, et al. (2006) Towards a pro-inflammatory and immunomodulatory emerging role of leptin. Rheumatology (Oxford) 45(8): 944-950.
-
Lozano FS, Barros MB, García Criado FJ, Gomez Alonso A (2005) Exogenous nitric oxide can control SIRS and downregulate NFkappaB. J Surg Res 124(1): 52-58.
-
O’Connor TM, O’Connell J, O’Brien DI, Goode T, Bredin CP, et al. (2004) The role of substance P in inflammatory disease. J Cell Physiol 201(2): 167-180.
-
Luber Narod J, Austin Ritchie T, Hollins C, et al. (1997) Role of substance P in several models of bladder inflammation. Urol Res 25(6): 395-399.
-
Manicone AM, McGuire JK (2008) Matrix metalloproteinases as modulators of inflammation. Semin Cell Dev Biol 19(1): 34-41.
-
Melgarejo E, Medina MA, Sánchez Jiménez F, Urdiales JL (2009) Monocyte chemoattractant protein-1: A key mediator in inflammatory processes. The International Journal of Biochemistry & Cell Biology 41(5): 998-1001.
- Superposition of Cryo-EM and AlphaFold Predictions of Dengue Antigen-Antibody Complexes
- Jugular-Applied Coherent Low-Level Laser Therapy Enhances Systemic Mitochondrial Metabolic Function and Antioxidant Response
- Role of OMC32 Polypeptide in Acrosin-Mediated Exocytosis during the Bovine Sperm Acrosome Reaction
- Association of Galectin-3 but not Laminin in Tamoxifen-Induced Growth Suppression in Breast Cancer MCF-7 Cells
- Effect of Different Wavelengths of Light on the Rate of Photosynthesis
- Nutritional, Therapeutic, and Environmental Effect of Oyster Mushrooms: An Editorial