Revisiting Pyronin Y, A Classical Photostable Xanthene Dye useful for Cost Effective Multimodal Fluorescence Microscopy
In search of cost-effective alternatives for developing high-throughput imaging methods for NETosis, several classical histology dyes were revisited. It was found that the second component of the marketed premix Methyl Green-Pyronin Y (Gurr’s Certistain) has several properties compatible with this aim. Therefore, a simple purification method was developed, and the obtained Pyronin Y fraction, dried and redissolved in a biocompatible medium, was found to be photostable, selectively internalized by non-viable cells, and had spectroscopic features that make it compatible with many common fluorophores for multicolor imaging. Under certain conditions, Pyronin Y has a maximum absorption at 548nm, so it can be excited by 514nm and 561nm Laser lines, with an emission peak at 571nm. Experiments with human polymorphonuclear leukocytes (PMN) enzymatically induced to NETosis confirmed the usefulness of Pyronin Y in detecting early NETotic nuclei. By super-resolution microscopy, the compound enhances the visualization of nuclear subdomains, enabling the reduction of assay duration by detecting morphological alterations indicative of initial NETosis steps. Also, in chemically fixed resting PMN, azurophilic granules were stained by Pyronin Y, suggesting a previously unappreciated nucleic acid-independent staining mechanism. In addition, fluorescence lifetime imaging microscopy (FLIM) followed by time domain phasor analysis demonstrates the utility of the dye in differentiating between NETs released into the extracellular space and the genetic material still remaining inside the cell.
Introduction
About 20 years ago, it was discovered that polymorphonuclear neutrophils (PMNs) that have been induced to produce high amounts of reactive oxygen species (ROS) intracellularly, react by extruding chromatin decorated with bactericidal proteins into the extracellular medium [1]. Because the released chromatin forms a network-like structure (“NET” acronym for “Neutrophil Extracellular Traps”) and as this phenomenon leads to cell death, it was named “NETosis” alluding to other forms of cell death better known by that time: Necrosis, Apoptosis and Pyroptosis [2]. The same group later noted that NETs can bind and kill bacteria and yeast due to their high histone and toxic granule enzyme content [3]. In light of the evidence accumulated since then, the formation of NETs is now considered a central event in innate immunity against extracellular microorganisms, as it prevents their propagation by fixing them to a reticular matrix that contains a high local concentration of antimicrobial agents. On the other hand, excessive NET formation can also induce deleterious antiself reactions, such as vascular endothelial cell injury [4], thrombosis [5, 6] and delayed diabetic wound healing [7]. Furthermore, defects in the regulation of NETosis and ineffective removal of NETs have been shown to be involved in the pathogenesis of autoimmune diseases, including systemic lupus erythematosus (SEL) [8] and vasculitis associated with autoantibodies against neutrophil cytoplasmic antigens (ANCA) [9, 10].
Labor-intensive microscopy techniques (i.e: scanning electron microscopy (SEM), immuno-TEM, and confocal laser scanning microscopy (LSCM) combined multicolor immunofluorescence and 3D reconstruction) has played a pivotal role in the discovery and subsequent mechanistic characterization of NETosis [3]. The rigorous experimental standards tacitly imposed by the seminal studies in this field as well as the labile and reactive nature of granulocytes has marked further research and restricted the development of high throughput bioassays [11]. In recent years, using conventional methods as gold-standards, alternative assays have been validated to simplify, speed up, automate and/ or reduce the cost of the in vitro analysis of NETosis. In this context, bioassays based on flow cytometry [12], flow imagine [13], end-point LSCM [14] and time-lapse LSCM [15] demonstrated a high correlation with conventional methods and clear advantages over its possibility of miniaturization (micromethods) and its consequent applicability in high- throughput pharmacological screening. In particular, studies based on video-microscopy (time-lapse LSCM) present an additional advantage since they allow a dynamic characterization of the process, permitting discernment between the two fundamental mechanisms: i) “suicidal NETosis”, dependent on ROS and slow development (3h) and ii) “vital NETosis”, independent of ROS and rapid response (10-30min) [16, 17].
In order to identify new drugs that inhibit or promote both types of NETosis, we have decided to innovate with new experimental approaches that must be automatable and cheap. As a first step, we compared the performance of different types and combinations of DNA intercalating agents and fluorescent contrast dyes such as DAPI, PI, Evans Blue, Methyl Green, Brillant green, CFDA, Safranin O among others. In this work we propose the usability of Pyronin Y, a low cost classic histology reagent marketed in a mixture with Methyl Green, which, once easily purified, presents high performance for monitoring early steps of this particular cell death mechanism using multimodal LSCM techniques.
Results and Discussion
A previous work proposes the use of Methyl Green as an economical alternative to stain nuclei of dead or chemically fixed cells in modern LSCM systems equipped with 633nm lasers [18]. Our preliminary experiments aimed at adapting these results to a 96-well format assay with a commercial mixture of Methyl Green-Pyronin Y, led us to accidentally appreciate certain very useful spectroscopic properties in the second component of the mixture (Figure 1A). Therefore, to systematically characterize such observations, we developed a simple solid-liquid extraction method based on sequential extraction with trichloromethane, acetone and PBS (Figure 1C). The sequential solid-liquid extraction method allows for separate both major components (i.e: Methyl green and Pyronin Y) in addition to getting rid of a widely known spontaneous decomposition product of Methyl Green (i.e: Crystal violet), which has the problem of acting as a quencher for Methyl Green fluorescence, as well as been highly toxic for cells. Furthermore, the described method can be easily scaled-up to obtain larger quantities using the Soxhlet method (our data not shown). The target product (Figure 1C, PyY fraction) was dry, redissolved in a sterile biocompatible media (autoclaved PBS with less than 0.05% v/v of Molecular Biology grade DMSO, pH 7.2) and characterized by UV-visible absorbance. The PyY fraction was found to be compatible with pure Pyronin Y (Figure 2A and data not shown) with a maximum absorption peak at 548±2nm and the absence of peaks corresponding to crystal violet (585nm) and Methyl Green (631nm). The analysis of the remaining fractions corroborates the presence of Pyronin Y traces together with Crystal violet in the trichloromethane fraction and of Methyl Green almost exclusively in the PBS fraction (Figure 1D and data not shown). Coincident with the absorption spectrum obtained in solution, the peripheral human PMNs stained with the obtained Pyronin Y product show higher efficiency in the collection of the fluorescent signal at the 610/90nm band using the 561-10nm DPSS excitation line (Figure 2B and 2C) and no emission was detected above 635nm when excited with the 633nm line, unlike the commercial mix (Mix) that contains Methyl Green (Figure 1A). Besides, when a 1:1 mix of live and PFA 2% fixed PMN cells were stained with Pyronin Y and Evan’s Blue, the first dye only stained the nucleus of fixed cells (Figure 2D) demonstrating that Pyronin Y is also usable as a viability stain.
In order to optimize the imaging conditions of PMN nuclei stained with Pyronin Y, a spectral scan was performed using the 561nm laser line as excitation source and an array of photodetectors that allows a discretized acquisition of the signal in bands of 5nm (𝜆-stack mode). As it is shown in Figure 3A, the emission spectrum peaks at 579.0±2.5nm.
Based on these results, we defined an optimal detection band (≈85% area under the curve) between 570-620nm (Band Pass 595/50nm), which allows for the use of Pyronin Y in combination with other lower and higher emission fluorophores such as DAPI, Methyl Green, FITC and Evan’s Blue (Figure 2D) among many others.
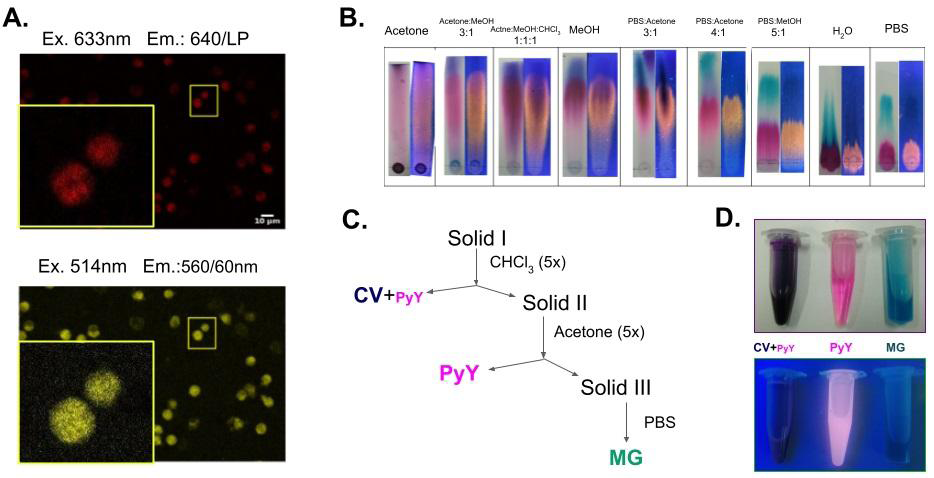
Figure 1: Obtention of Pyronin Y from a commercial mixture. A. Confocal laser scanning micrographs (LSCM) of human PMNs fixed (2% PFA) and labeled with a 1/1000 dilution of the aqueous fraction of a liquid-liquid (1:1 H2O:CHCl3) extraction of commercial reagent. The upper micrograph shows the characteristic fluorescence of Methyl Green (excited at 633nm and detected at 650nm with a long pass filter) while the lower micrograph shows a fluorescent signal consistent with that of Pyronin Y (excited at 514nm and detected with a 560/60nm band pass filter). B. Chromatographic behavior of the commercial reagent (Gurr’s Certistain, Lyon et al. 1987) when run with different solvent systems. C. A solid-liquid extraction sequence was developed to obtain pure Pyronin Y (PyY fraction) and Methyl Green (MG fraction). For further details, please refer to the appendix section. D. The purification fractions are shown illuminated under white light (top) and black light (bottom).
Having defined the optimal conditions for excitation and acquisition of the Pyronin Y fluorescent signal, the next step was to develop LSCM strategies that allow to detect structural alterations in the PMNs nucleus indicative of the early steps of NETosis process. As the objects of interest of our study (subdomains of nuclear lobes) are approaching the optical resolution limit (≈0.2 𝜇m), we decided to evaluate the performance of the Airyscan detection module (Zeiss). The improved appearance of Pyronin Y-stained nuclei images after the super-resolution image processing technique can be seen in Figure 3B. Moreover, it is only through this modality of image acquisition-processing that signals from the azurophilic granules (primary granules) become evident in the cell cytoplasm, which is an interesting finding since its affinity for Pyronin Y has not been previously reported. In this sense, a fact that is suggestive is the shared pharmacophore features between this dye and Azure A, precisely the same dye that gives the name to those intracellular granules because of its specific affinity (Figure 3C).
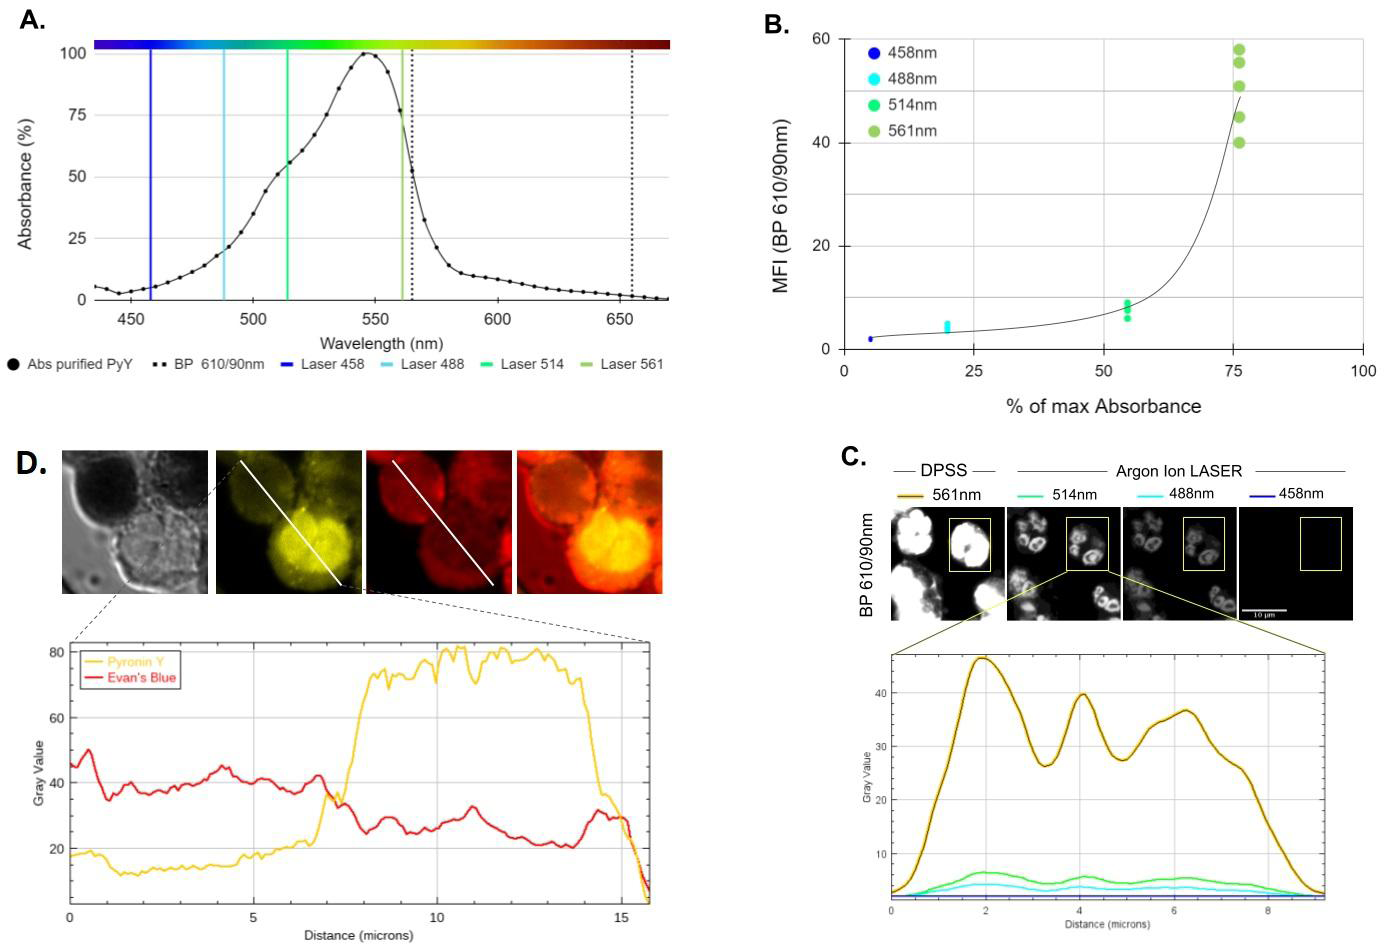
Figure 2: Spectroscopic and cell staining features of Pyronin Y. A. Absorption spectrum in the visible of the purification product obtained by Solid-Liquid extraction, dried and re-dissolved in PBS-DMSO (0.01% v/v) plotted next to 4 visible excitation lines available in the LSM880 system (Zeiss). B. Efficiency of these excitation lines set at 0.2% power on emission from Pyronin Y-labeled human PMNs detected in the 610/90(565-655)nm band at fixed gain as a function of the relative absorbance of the purification product dissolved in PBS-DMSO. C. Representative example (n=5) of a mean fluorescence intensity analysis of a Pyronin Y-labeled human PMN (highlighted rectangular area) under the excitation conditions indicated in B. For demonstration purposes, so that the signal may be eye-perceptible in suboptimal excitation conditions (488 and 458nm), the same digital contrast increase was applied to all four images. D. Pyronin Y and Evan’s Blue co-staining of live and fixed human leukocytes. Lower chart shows the fluorescence intensity profile of Pyronin Y (Ex. 561nm, Detection BP 595/50, “yellow” channel) and Evans Blue (Ex. 633nm 650/LP detection, “red” channel) along a diagonal transect (white line, 1pxl x 16 𝜇m) drawn over two cells, one live and one not.
The next step was to evaluate NETosis under the established image acquisition-processing conditions. The analysis of the fluorescence intensity in volumetric projections of the cells exposed to GO for 2.5h allows differentiating nuclei that are in different stages of the NETotic process, demonstrating that Pyronin Y is a useful reagent for end point NETosis monitoring (Figure 4A and 4B). Another property of intercalating fluorochromes that could be exploited in NETosis bioassays could be their photostability, and linked to this, the possibility of studying their interaction affinity with nucleic acids through Fluorescence Recovery After Photobleaching (FRAP) studies. Since this property has not been reported for Pyronin Y we decided to perform a series of determinations on PMN fixed and then labeled with Pyronin Y. Surprisingly, the dye showed high photostability against prolonged irradiation (≈1 min.) with high intensity 440nm violet light (100% power), presenting a lower reduction than 50% of the initial signal and a mean recovery time (𝜏½) of 10 seconds (Figure 5).
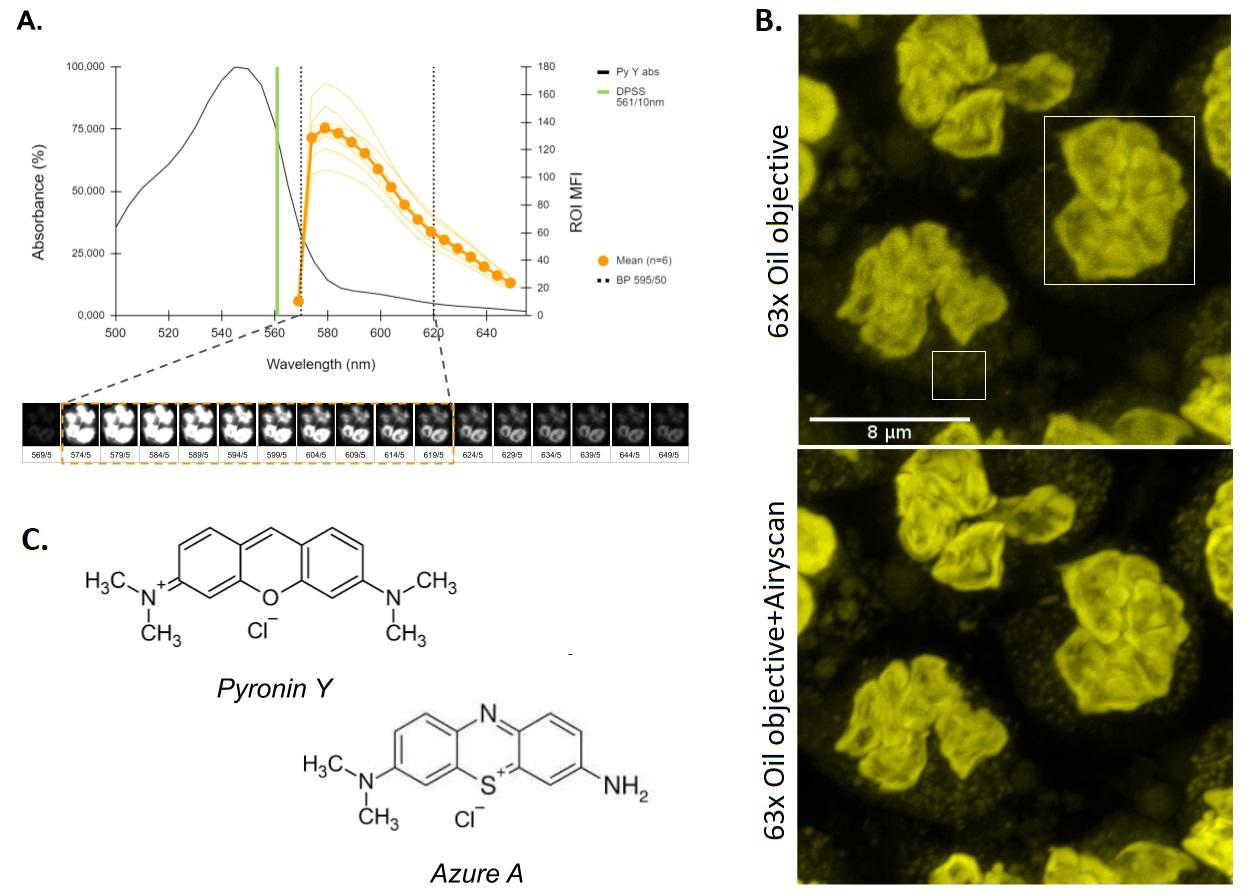
Figure 3: Image acquisition setting of human PMN stained with Pyronin Y. A. Absorption in the visible of Pyronin Y together with the emission spectrum obtained under the 𝜆-stack modality (scanning range 564-654nm, step 5nm) for spectral analysis of the fluorescence (n=6) using the DPSS 561-10nm laser at 0.2% power as excitation source. This allowed defining an optimal detection band (BP 595/50nm). B. Comparative image analysis of fixed PMNs (PFA 2%) using the excitation-detection conditions established in A. The upper micrograph is a z-axis projection of maximum fluorescence intensities (z-stack) obtained at the limit of optical resolution (Objective 63x, NA 1.4, oil immersion). The lower micrograph was acquired and processed in AiryScan® (Zeiss) super-resolution mode, which translates into an effective magnification of 1.7X over the effective optical resolution. A representative example of n=4 is presented. C. Structural similarity between two xanthene dyes: Pyronin Y and Azure A. The pharmacophore comparison is pertinent given the apparent affinity of Pyronin Y for the azurophilic granules of PMNs as shown in B.
The next objective was to evaluate the possibility of making determinations of FLIM with this dye using the configuration available in our workstation that has 2 pulsed excitation lines (405 and 440nm) and 2 photon collection channels (Ch1: 450-500 and Ch2:500-550nm) for this purpose. In theory, given the photostability of the compound (Figure 5), by increasing the illumination intensity sufficiently, we can obtain the required signal level (i.e: Chi2 >1 in the fitting model implemented for lifetime calculus) to carry out the assay using the detection Ch2 (please see the system configuration in the appendix section). To confirm this assumption, a spectral scan was performed (Figure 6A) and it was observed that a small tail of the emission spectrum (≈7% of the area under the curve) fell within the detection range. Another problem we face is that within the populations of peripheral granulocytes are Eosinophils (Eo) which exhibit high autofluorescence due to their intracytoplasmic granules (Yakimov et al. 2019). In view of this, we carried out a series of FLIM exploratory experiments where we set 3 variables of interest: i) Minimum necessary power of the excitation source; ii) minimum collection time of photons emitted by the Pyronin Y-DNA complexes and iii) Degree of interference from autofluorescent objects (i.e: Eo granules). We found that setting the 440nm laser at 4% of its intensity enables FLIM analysis in the time domain (Figure 6A-6C). Furthermore, these image acquisition-processing conditions allow us to resolve 2 fluorescent components: a component with a short half-life that is associated with the Eo granules and another with a longer half-life that is attributed to Pyronin Y bound to the DNA of the Eo. cell nuclei.
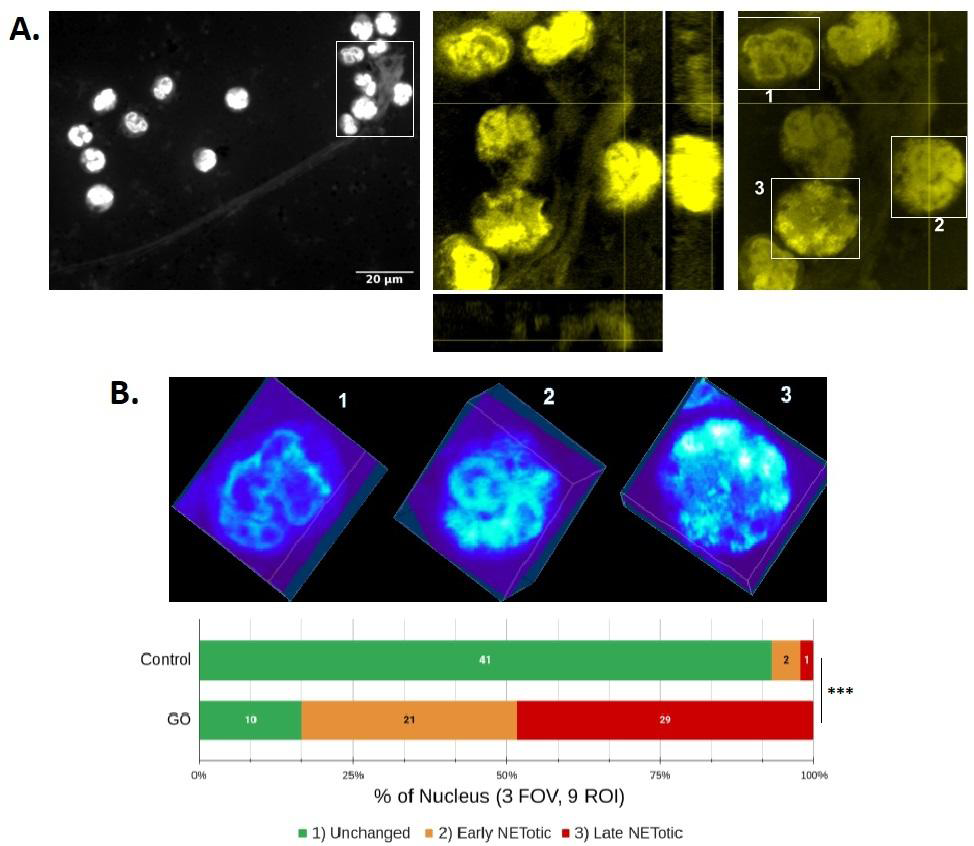
Figure 4: Analysis of NETosis stages in PMNs stained with Pyronin Y. A. Morphological analysis of PMNs incubated with glucose oxidase (GO) for 150 minutes, fixed with PFA (2%), labeled with Pyronin Y, and microphotographed and analyzed as described in Figure 3B. A region of interest (ROI) from a representative experiment (n=4) is presented on the right. To highlight the presence of NETs, the contrast was digitally intensified in the photograph on the left. Below and to the right of this image are orthogonal z-x and z-y projections of two planes centered on a protrusion of a NET. In the delimited rectangular areas in the image on the right, three examples of nuclei with different degrees of alteration in response to GO treatment are shown: 1) a nucleus without apparent changes, 2) a nucleus with altered lobular morphology and increased decondensation of chromatin (greater dye incorporation), and 3) a nucleus with total loss of lobular morphology, decondensation of chromatin, and/or spillage of genetic material into the extracellular medium. B. The upper image shows a volumetric projection of a heat map of the fluorescence intensity distribution in the boxed spaces in A. Below, the data obtained from three fields of observation (FOV) taken at random are summarized, with three ROIs chosen per FOV (approximate volume = 30x40x10 µm), accounting for nine ROIs per treatment (18 ROIs per experiment with approximately three nuclei each). *** p<0.001; Chi-squared test for trends. The results presented correspond to one independent experiment representative of four carried out.
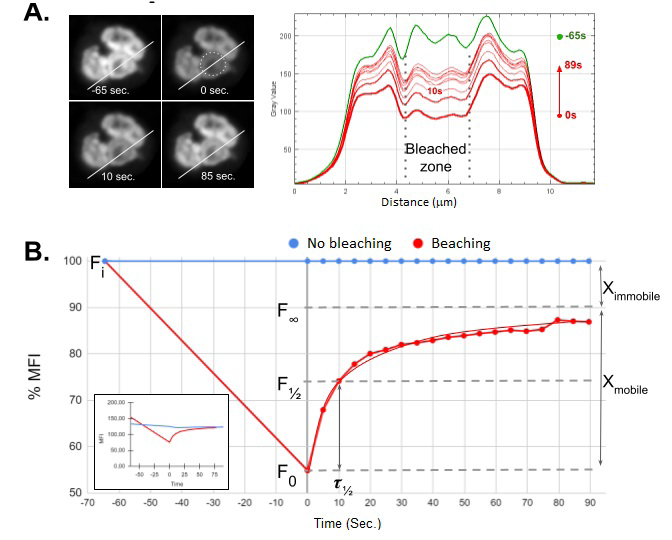
Figure 5: Photostability and FRAP analysis of Pyronin Y bound to human PMN nuclei. A. Fluorescent intensity profile of a transect (white line, 1pxl x 12𝜇m) before (-65 seconds, upper left image, green curve) and after irradiation (upper right image, area within dotted circumference ⌀ 2.5𝜇m) with 440nm pulsed diode laser at maximum power (red curves). After photobleaching, only a 50% reduction in the average initial emission of the irradiated area is observed (Fi=200±35 a.u. vs Fo=98±18 a.u). B. FRAP analysis of a representative experiment. Inset, raw data. The results show a rapid post-photobleaching recovery rate (𝜏½=10’’), which could explain the relatively low photobleaching efficiency observed in A. A representative experiment out of 12 performed is presented.
Given the great difference between the fluorescence intensity of the nucleus and that of the NET, the microphotographic recording of NETosis poses obvious problems in relation to contrast adjustment: if NETs are to be evidenced, it is necessary to increase the gain of the photodetectors, which implies the saturation of the nuclear pixels (Figure 4A). Based on this, FLIM analysis is considered a potentially useful alternative, since NETs, which are exposed to the extracellular medium, provide the bound dye with a distinct molecular environment from that within the cell nucleus, which could affect its characteristic lifetime fluorescence. To test this, the experiments with GO were repeated in the same way as in figure 4, but this time the images are acquired and processed in the FILM mode (Becker & Hickl, Germany). Analysis in the temporal domain using phasor diagrams allows us to clearly demonstrate the applicability of this technique to the field of NETosis, since the dye attached to the NETs presents an increase of fluorescence lifetime with respect to from when it is attached to the nuclei (Figure 7B). A noteworthy and recurring observation was the presence of red blood cells entrapped in the NETs. It is interesting to note that in these anucleated cells there is evidence of autofluorescence with a very short lifetime (Figures 7A and 7B) that could be explained by the emission of the Hemo group of hemoglobin and/or its oxidation products Hemin and Hemoxin [19, 20, 21, 22]. Another possibility that we cannot yet rule out is the formation of complexes or aggregates between Pyronin Y and red blood cell hemoglobin, which has not been previously reported.
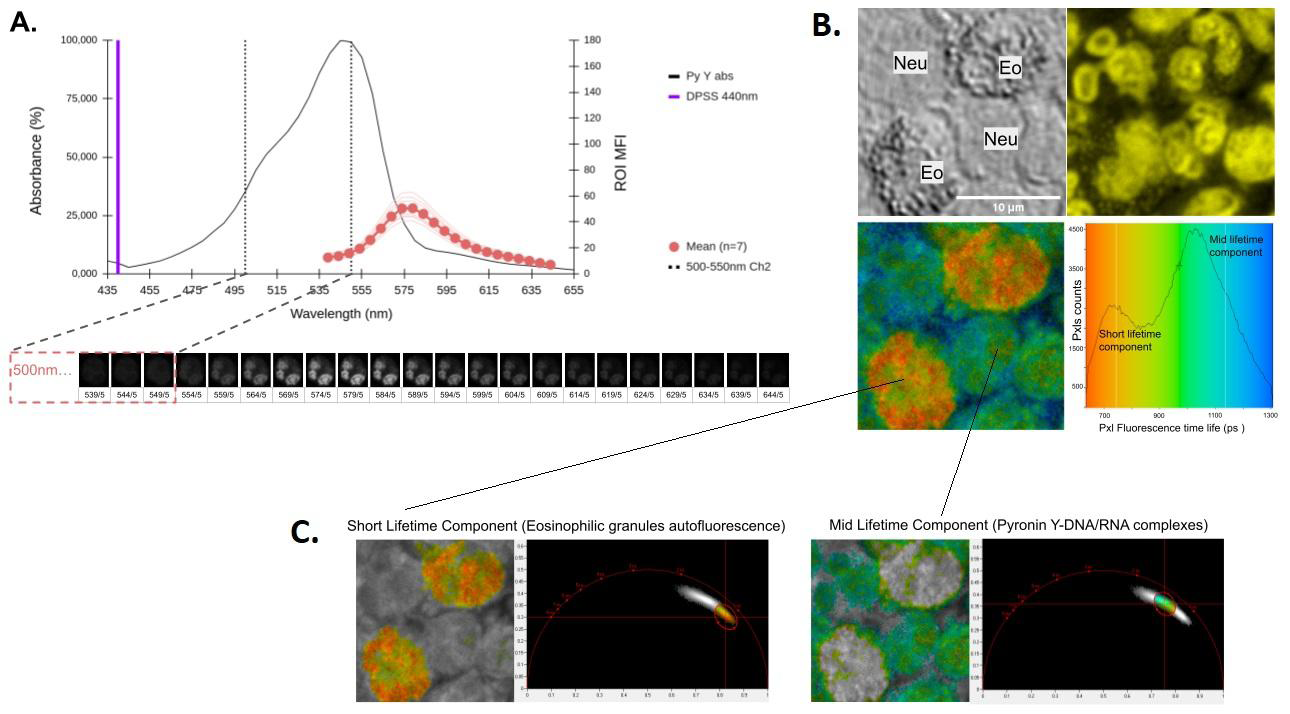
Figure 6: Acquisition setting for time-domain FLIM studies of Pyronin Y-stained human leukocytes. A. Spectral analysis (𝜆-stack, 5nm windows) of fixed (2% PFA) PMN stained with Pyronin Y and excited with a 440nm 30mW Pulsed Diode Laser at 4% power to verify detecting the signal in the interval 500-550nm (Channel 2), a necessary condition to carry out time domain FLIM studies (please see equipment configuration in the appendix section). B. Analysis of intensity (upper right image) and lifetime fluorescence (bottom left image and histogram) in fixed peripheral human Neutrophil (Neu) and Eosinophil (Eo) PMNs (2% PFA) stained with Pyronin Y. C. Phasor plots analysis in the time domain allows differentiating an autofluorescent component (C1) in the cytoplasm of Eo with shorter lifetime than Pyronin Y-nucleic acid complexes of the nucleus (C2, component with a mid-range lifetime). The observed mean lifetimes are 730ps for C1 and1050ps for C2.
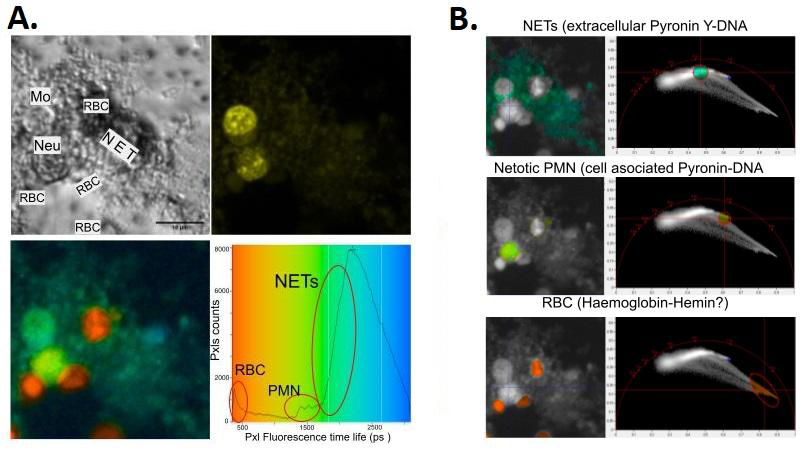
Figure 7: NETosis studies using the FLIM technique in Pyronin Y-stained human leukocytes. A. Fluorescence lifetime analysis (FLIM) in PMN peripheral human neutrophils stimulated for 2.5h with GO to induce NETosis. Once the culture was complete, the cells were fixed (PFA 2%) and stained with Pyronin Y. Mo: monocyte; RBC: red blood cell; Neu: Neutophil; NET: Extruded chromatin from NETotic cells. B. Time domain Phasor plot analysis lets us differentiate between NETs, NETotic cell nuclei, red blood cells and “viable”(live just before chemical fix) cells (Mo).
Conclusion
The utility of Pyronin Y in the detection of NETosis was clearly demonstrated using state-of-the-art multimodality microscopy methods. Finding modern applications to this low-cost, classical reagent will allow the development of novel automatable and less expensive micromethods for the high throughput screening of drugs that affect signal transduction pathways linked to different types of programmed cell death in leukocytes and other cell types.
Conflicts of Interest
The authors have no conflicts of interest to declare.
Acknowledgements
To Dr. engineer Javier Adur, Dr. Victor Casco, eng. Fernándo Balducci, Dr. Valeria Sigot, Dr. César Gonzalez and the rest of the LAMAE staff and the Bioelectricity, Physiology and Biophysics laboratories members at FING and IBB- UNER-CONICET for great support. To the 2022 Biomolecular Structure students from Bioinformatic career at UNER.
Funding
This work was possible by UNER funds (Projects PID6211 and Strengthening-2019). AC was awarded a pre-graduate scholarship by UNER (PID6211, 2021) and National Ministry of Education from Argentina (Belgrano-2022 Scholarship). PS, JIE and FU belong to the CONICET career as Researcher, technician and fellow, respectively. PS and MM are UNER professor-research-college extension agents.
References
-
Brinkmann V, Reichard U, Goosmann C, Fauler B, Uhlemann Y, et al. (2004) Neutrophil Extracellular Traps Kill Bacteria. Science 303(5663): 1532-1535.
-
Fuchs TA, Abed U, Goosmann C, Hurwitz R, Schulze I, et al. (2007) Novel cell death program leads to neutrophil extracellular traps. J Cell Biol 176(2): 231-241.
-
Papayannopoulos V, Zychlinsky A (2009) NETs: a new strategy for using old weapons. Trends Immunol 30(11): 513-521.
-
Doring Y, Weber C, Soehnlein O (2013) Footprints of Neutrophil Extracellular Traps as Predictors of Cardiovascular Risk. Arterioscler Thromb Vasc Biol 33(8): 1735-1736.
-
Fuchs TA, Brill A, Wagner DD (2012) Neutrophil Extracellular Trap (NET) Impact on Deep Vein Thrombosis. Arterioscler Thromb Vasc Biol 32(8): 1777- 1783.
-
Landoni VI, Pittaluga JR, Carestia A, Castillo LA, Martire Greco D, et al. (2022) Neutrophil Extracellular Traps Induced by Shiga Toxin and Lipopolysaccharide-Treated Platelets Exacerbate Endothelial Cell Damage. Front Cell Infect Microbiol 12: 897019.
-
Wong SL, Demers M, Martinod K, Gallant M, Wang Y, et al. (2015) Diabetes primes neutrophils to undergo NETosis, which impairs wound healing. Nature Medicine 21(7): 815-819.
-
Hakkim A, Furnrohr BG, Amann K, Laube B, Abed UA, et al. (2010) Impairment of neutrophil extracellular trap degradation is associated with lupus nephritis. Proc Natl Acad Sci USA 107(21): 9813-9818.
-
Kessenbrock K, Krumbholz M, Schonermarck U, Back W, Gross WL, et al. (2009) Netting neutrophils in autoimmune small vessel vasculitis. Nat Med 15(6): 623- 625.
-
Nakazawa D, Shida H, Tomaru U, Yoshida M, Nishio S, et al. (2014) Enhanced Formation and Disordered Regulation of NETs in Myeloperoxidase ANCA Associated Microscopic Polyangiitis. J Am Soc Nephrol 25(5): 990- 997.
-
Masuda S, Nakazawa D, Shida H, Miyoshi A, Kusunoki Y, et al. (2016) NETosis markers: Quest for specific, objective, and quantitative markers. Clin Chim Acta 459: 89-93.
-
Masuda S, Shimizu S, Matsuo J, Nishibata Y, Kusunoki Y, et al. (2017) Measurement of NET formation in vitro and in vivo by flow cytometry. Cytometry A 91(8): 822-829.
-
Lelliott PM, Momota M, Lee MS J, Kuroda E, Iijima N, et al. (2019) Rapid Quantification of NETs In Vitro and in Whole Blood Samples by Imaging Flow Cytometry. Cytometry A 95(5): 565-578.
-
Kraaij T, Tengstrom FC, Kamerling SWA, Pusey CD, Scherer HU, et al. (2016) A novel method for high throughput detection and quantification of neutrophil extracellular traps reveals ROS independent NET release with immune complexes. Autoimmun Rev 15(6): 577- 584.
-
Hoppenbrouwers T, Autar ASA, Sultan AR, Abraham TE, Houtsmuller AB, et al. (2017) In vitro induction of NETosis: Comprehensive live imaging comparison and systematic review. PLoS One 12(5): e0176472.
-
Yipp BG, Kubes P (2013) NETosis: how vital is it? Blood 122(16): 2784-2794.
-
Rochael NC, Guimaraes Costa AB, Nascimento MTC, Oliveira MP, Saraiva EM, et al. (2015) Classical ROS dependent and early/rapid ROS-independent release of Neutrophil Extracellular Traps triggered by Leishmania parasites. Sci Rep 5(1): 18302.
-
Prieto D, Aparicio G, Morande PE, Zolessi FR (2014) A fast, low cost, and highly efficient fluorescent DNA labeling method using methyl green. Histochem Cell Biol 142(3): 335-345.
-
Yakimov BP, Gogoleva MA, Semenov AN, Rodionov SA, Novoselova MV, et al. (2019) Label free characterization of white blood cells using fluorescence lifetime imaging and flow cytometry: molecular heterogeneity and erythrophagocytosis. Biomed Opt Express 10(8): 4220- 4236.
-
Bianchi M, Hakkim A, Brinkmann V, Siler U, Seger RA, et al. (2009) Restoration of NET formation by gene therapy in CGD controls aspergillosis. Blood 114(13): 2619- 2622.
-
Lyon H, Jakobsen P, Hoyer P, Andersen AP (1987) An investigation of new commercial samples of Methyl Green and Pyronin Y. Histochem J 19(6-7): 381-384.
-
Steinberg BE, Grinstein S (2007) Unconventional Roles of the NADPH Oxidase: Signaling, Ion Homeostasis, and Cell Death. Science’s STKE 2007(379): pe11.
- An Efficient and Affordable Method for Isolating Bone Marrow- Derived Mesenchymal Stem Cells from Swiss Albino Mice
- Superposition of Cryo-EM and AlphaFold Predictions of Dengue Antigen-Antibody Complexes
- Jugular-Applied Coherent Low-Level Laser Therapy Enhances Systemic Mitochondrial Metabolic Function and Antioxidant Response
- Role of OMC32 Polypeptide in Acrosin-Mediated Exocytosis during the Bovine Sperm Acrosome Reaction
- Association of Galectin-3 but not Laminin in Tamoxifen-Induced Growth Suppression in Breast Cancer MCF-7 Cells
- Effect of Different Wavelengths of Light on the Rate of Photosynthesis