Distribution of Drift Pumice as an Indicator for Pollutant Distribution and Sediment Transport in New Caledonia
In 2008 and 2010, felsic drift pumice was collected from a total of 40 beaches around the main island of New Caledonia, Southwest Pacific. This island is enclosed by a barrier reef lagoon whose 2008 designation as a UNESCO World Heritage Site brought attention to the ongoing environmental degradation caused by a century of open cast nickel mining. This type of mining is notorious for producing voluminous fine grained waste sediment that clogs rivers and bays, and may compromise the lush biodiversity of the lagoon. This study examines the use of exotic drift pumice as a visual marker of sediment transport in and around the lagoon. The frequent, voluminous pumice eruptions in the Southwest Pacific provide ample source material that is somewhat durable, highly transportable in water, and easy to collect and analyze. Geochemical and mineralogical analyses were used to identify the source of the pumice in order to map the transport vector across the open ocean and into the lagoon. Pumice characteristics (abundance, angularity, and maximum clast size) were used in conjunction with beach parameters (width, composition, distance from the reef, etc.) to identify at risk coastal areas exhibiting elevated fluvial input in conjunction with reduced marine influence.
Introduction
New Caledonia (35°S 165°W) (Figure 1) is a ~350 km long by 50 km wide island nation located in the Southwest Pacific, approximately 1500 km away from Australia and New Zealand. The main island is enclosed by a nearly continuous barrier reef creating a lagoon of over 20,000 km2 in area. The barrier reef generally grows 14 to 25 km from the coast, but can reach distances of 100 km along the axis of elongation. In 2008 the lagoon was designated a UNESCO World Heritage Site [1]. This honor brought attention to the plight of the lagoon, which has been suffering from the detrimental effects of nearly a century of open cast mining. Although nickel mining reached its peak in the 1960s to 1970s, the industry still accounts for a significant portion of the New Caledonian economy. The environmental impacts of open cast mining include acid mine drainage, destruction of littoral and coastal habitats, rapid shallowing of bays and reduced coral productivity in the presence of chronically elevated concentrations of suspended sediment [2, 3, 4, 5]. However, the full extent of environmental degradation is unknown, as there has only been one comprehensive catalog of the effects of mining on the rivers and coastline of New Caledonia [5] More recent studies of the lagoon ecosystem have focused on the southwestern part of the lagoon surrounding the population center of Nouméa [6, 7, 8, 9].
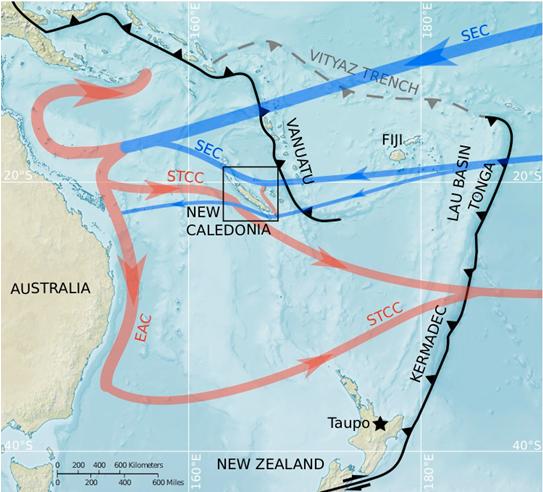
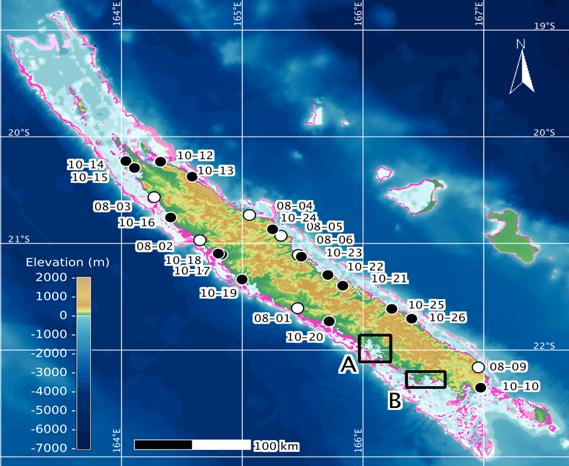
Figure 2: Map of Grande Terre, New Caledonia (after General Bathymetric Chart of the Oceans, 2010), with detailed insets of (A) the Baie de St. Vincent and (B) the Nouméan peninsula and Mt. Dore (after DTSI, 2009, 2010). Coral reefs (after Andréfouët et al., 2005) in dark pink shallow, pink (intermediate depth) , and light pink (deep). Circles represent sampling locations from 2008 (white) and 2010 (black). Legend shows elevation in meters above means sea level.
Black star marks the location of Taupo Volcanic Zone, New Zealand. Black box marks the) boundaries of Figure
2. Black and grey lines represent modern and relict tectonic margins, respectively (Colored lines represent generalized ocean currents, with arrows pointing toward the flow [10]) direction after [11, 12, 13, 14]. Ocean currents: EAC, East Australian Current; SEC, South Equatorial Current; STCC, South Tropical Counter Current. Smaller studies have also been carried out on the east coast and in the extreme north and south [6, 15, 16]. Our study used land based data collection methods to map the distribution of long shore and fluvial sediments around the island perimeter. The field study included two sample collection periods during which exotic drift pumice was collected from a total of 40 distinct locations. Samples were collected from 9 beaches in July 2008 and 33 beaches in July 2010 (Figure 2). Petrographic and geochemical compositions of the pumice samples were consistent with two recent eruptions in the Central Tonga arc. A basic drift trajectory was mapped from the proposed source, while assuming the pumice generally followed major ocean currents [17, 18]. The dominant ocean current from the equator to approximately 20°S is the SEC, which flows east to west and could potentially be enriched in pumice from Tonga, the Lau Basin, or Vanuatu prior to reaching New Caledonia [18, 19, 20]. At the eastern New Caledonian coast, the SEC bifurcates, with the North Jet recombining with the main body of the SEC and the South Jet wrapping around the southern terminus of New Caledonia to flow northward up the west coast before continuing west toward Australia [21, 14]. Upon reaching the Australian coast, the SEC bifurcates again, with the south, flowing arm transitioning into the Eastern Australian Current [22]. East flowing off shoots of the EAC combines to form the South Tropical Counter Current (STCC), which breaks against the northwestern coast of New Caledonia, but would likely be poor in pumice until passing the Kermadec is lands and New Zealand further to the east [22, 13]. Hence, ocean currents potentially rich in pumice were shown to have access to nearly the entire New Caledonian coastline except for the deeper bays and a stretch of the coastline in the northwest, which was serviced by pumice poor waters coming from Australia. The intensity of longshore waves imported from the open ocean directly corresponded to pumice abundance, allowing the energy distribution of these waves, which are critical to flushing sediment from nearshore areas, to be mapped using land based data collection methods [23]. A simplified model comparing pumice abundance to other beach parameters (width, composition, etc.) can then be used to determine whether fluvial sediments are polluting nearshore areas or being exported to the lagoon. The results were compared to previously published energy distribution maps created from a highly. Complex three dimensional hydrodynamic box model of the southwestern lagoon developed by the French- government [7, 24, 9].
Materials and Methods
Detailed field observations were recorded at all of the beaches centered around descriptions of the beach in terms of the width of the beach along its profile, the size distribution of beach sediments, the amount of subaerial sediments and pumice in the beach backshore, and the landform acting as the landward boundary. Beach widths were measured from the low tide line, including exposed bedrock but not (ephemeral) sand bars, to the upper limit of wave activity at the base of vegetation, cliffs, or a seawall. The width of the beach was initially described as narrow (<5 m), intermediate (5 to 40 m), or wide (>40 m), and later quantified using a combination of site photographs and satellite images. Satellite images were al so used to quantify the width of the lagoon from the beach to the outer barrier reef, as well as to verify the presence of fluvial sediments, as indicated by brown discoloration of nearshore waters traceable to a nearby fluvial source. Beach compositions encountered in the field included clay to silt sized mud, fine to very coarse sand, very fine pebble gravel to coarse cobble gravel, and bedrock or boulder gravel. The last two size categories were combined due to similar rarity of pumice. Pumice samples were collected with a bias toward large clasts, so only the sieve diameter, in φ, of the largest sample was recorded for each location. Pumice abundances were rated as follows: (1) very abundant meant there was a pumiceous ridge deposit, (2) abundant meant there was a pumiceous strand line or the volumetric equivalent, (3) rare meant >10 minutes were required to fill the sample bag to an acceptable level, and (4) very rare meant only one sample was encountered. Beaches without any pumice were not encountered.
Results
Coastal Geomorphology
The geology exposed along the coast strongly influences the ruggedness of the coastal topography but the shape of the coastline itself is controlled by the intensity of waves entering the lagoon through gaps in the barrier reef [9, 25]. Together, the continental geology and northeast, northwest, central west, and southwest coasts (Figure 3) [5].
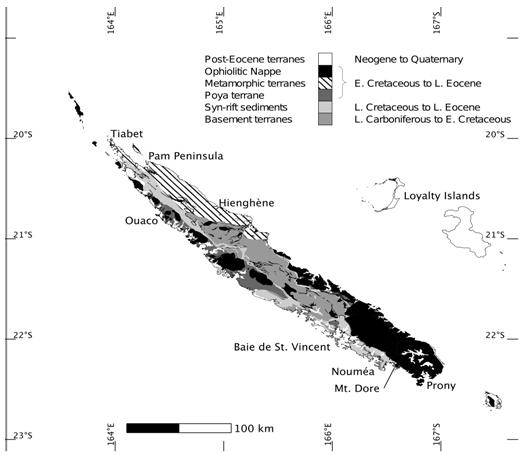
[5]. The barrier reef grows an intermediate distance from the coast and is linear and fairly continuous, broken intermittently by wide channels. The central west coast, from Ouaco to just south of the Baie de St. Vincent, features numerous small to large bays carved into the Poya and sedimentary basement terranes. The bays harbor mangrove forests and intermittent beaches of variable composition [5]. The barrier reef grows close to the shore in a piecewise arcuate manner with extensive fringing reefs growing inside the lagoon. The southwest coast, from the Baie de St. Vincent to Prony, is generally hilly, with broad bays broken intermittently by branching peninsulas [5]. North of Mt. Dore, heterogeneous syn-rift l. sediments form two competing coastal morphologies, with broad, mangrove forested bays carved into terrigenous sediments are periodically broken by outcrops of flysch forming branching peninsulas that enclose small bays lined with sandy beaches. South of Mt. Dore, the Ophiolitic Nappe produces gently sloping gravelly beaches. The barrier reef, while generally linear and continuous, encloses a funnel-shaped lagoon that opens to the southwest, allowing high energy waves from the open ocean to enter the lagoon unchecked. These waves are channeled around the Nouméa and bypass the deep bays on either side of the peninsula [11, 26, 27]. North of Nouméa, the, waves quickly lose energy and transition into the low energy wind wave characteristic of the lagoon.
Pumice Distribution and Beach Morphology
Beach and pumice characteristics are summarized in Table. Pumice deposits were universally stranded above the daily high tide line, which occurred anywhere along the beach profile depending on the beach geometry and morphology. Abundant pumice most often occurred at the traditional berm type beach, which was also the most common beach morphology, probably due to preferential, selection for voluminous backshore sediments in the absence of dunes. However, the “berms” were generally no larger than small ridges and sometimes limited to simple strand lines. True dunes were restricted to localized climbing dunes whose convex profiles were sometimes imitated by local topography (Figure 4-Figure 6).
| Location | Lagoon Width (km) | $\theta_s$* (days) | Beach Composition | Strand Type | Beach width (m) | Boundary Landform | ||||||||||||
|---|---|---|---|---|---|---|---|---|---|---|---|---|---|---|---|---|---|---|
| S.No | Latitude (S°) | Longitude (°E) | Fluvial | Mud | Sand | Gravel | Bedrock | |||||||||||
| input† | ||||||||||||||||||
| SoutheastCoast‡ | ||||||||||||||||||
| 10-Oct | 22°21'00.26" | 166°58'21.27" | Latitude (S°) | 8 | N.D. | N | Longitude (°E) | •• | Mud | Sand | Gravel | Bedrock | ••• | • | Line | 15 | Dunes | |
| 26-Oct | 21°42'19.57" | 166°24'00.02" | 9 | N.D. | N | ••• | •• | Perched. | 4 | Love cliff | ||||||||
| 25-Oct | 21°36'47.37" | 166°14'14.15" | 12 | N.D. | N | ••• | •• | Ridge | 10 | Hill | ||||||||
| 21-Oct | 21°23'45.05" | 165°49'51.05" | 16 | N.D. | Y | ••• | Perched. | 80 | LOW cliff | |||||||||
| 22-Oct | 21°17'44.20" | 165°42'29.01" | 16 | N.D. | N | •• | •••• | Perched. | 3 | Cliff | ||||||||
| 23-Oct | 21°07'25.31" | 165°29'16.32" | 16 | N.D. | Y | •••• | Line | 20 | Hill | |||||||||
| 24-Oct | 20°51'53.46" | 165°15'01.42" | 10 | N.D. | Y | •••• | •• | Perched. | 3 | Cliff | ||||||||
| Northeast coast | ||||||||||||||||||
| 13-Oct | 20°22'25.64" | 164°34'59.42" | 6 | N.D. | Y | ••• | •• | Ridge | 40 | Hill | ||||||||
| 12-Oct | 20°13'56.24" | 164°19'23.27" | 14 | N.D. | P | ••• | •• | Ridge | 5 | Hill | ||||||||
| Northwest coast | ||||||||||||||||||
| 14-Oct | 20°13'39.37" | 164°02'07.92" | 17 | N.D. | P | ••• | •• | Ridge | 20 | Hill | ||||||||
| 15-Oct | 20°17'28.25" | 164°06'24.54" | 20 | N.D. | Y | ••• | •• | Line | 50 | Dunes | ||||||||
| 16-Oct | 20°45'22.90" | 164°24'23.39" | 14 | N.D. | Y | •• | ••• | Line | 15 | Seawall | ||||||||
| Central West Coast | ||||||||||||||||||
| Open Coast | ||||||||||||||||||
| 18-Oct | 21°05'37.20" | 164°48'01.99" | 11 | N.D. | N | •• | ••• | Line | 5 | Hill | ||||||||
| 17-Oct | 21°06'07.68" | 164°49'40.70" | 13 | N.D. | Y | • | ••• | •• | Ridge | 5 | Hill | |||||||
| 19-Oct | 21°20'08.70" | 164°59'49.83" | 9 | N.D. | P | •• | ••• | Ridge | 15 | Hill | ||||||||
| 20-Oct | 21°43'43.67" | 165°43'5.39" | 12 | N.D. | N | •• | ••• | Ridge | 25 | Hill | ||||||||
| Baie de St. Vincent | ||||||||||||||||||
| 27-Oct | 21°57'14.34" | 166°00'18.65" | 9 | 4 | Y | ••• | •• | Line | 5 | Dunes | ||||||||
| 28-Oct | 21°57′18.61″ | 166°00′32.77″ | 9 | 4 | Y | ... | ... | Ridge | 20 | Hill | ||
| 29-Oct | 21°56′23.50″ | 166°00′21.09″ | 11 | 10 | Y | ... | • | ... | ... | Ridge | 60 | Hill |
| 31-Oct | 21°54.29.12″ | 166°03′55.05″ | 17 | 10 | N | ... | ... | Ridge | 10 | Cliff | ||
| 30-Oct | 21°54′46.58″ | 166°04′38.21″ | 18 | 8 | N | ... | ... | Ridge | 5 | Hill | ||
| Oct-33 | 21°57′19.84″ | 166°08′21.26″ | 20 | 10 | Y | ... | ... | Ridge | 25 | Hill | ||
| Oct-32 | 21°57′34.15″ | 166°08′25.40″ | 20 | 10 | Y | ... | Ridge | 20 | Seawall | |||
| Southwest coast | ||||||||||||
|---|---|---|---|---|---|---|---|---|---|---|---|---|
| Nouméan peninsula | ||||||||||||
| 6-Oct | 22°15′37.05″ | 166°23′21.75″ | 18 | 8 | N | ... | ... | Line | 15 | Dunes | ||
| 1-Oct | 22°17′44.73′ | 166°26′14.95″ | 18 | 8 | N | ... | ... | Ridge | 10 | Hill | ||
| 2-Oct | 22°18′12.73″ | 166°26′11.74″ | 18 | 8 | N | ... | Line | 10 | Seawall | |||
| 3-Oct | 22°18′12.14″ | 166°26′14.79″ | 18 | 8 | N | ... | Ridge | 5 | Hill | |||
| 4-Oct | 22°18′11.62″ | 166°26′42.67″ | 18 | 8 | N | ... | Perched | 5 | Hill | |||
| 5-Oct | 22°15′58.99″ | 166°23′19.16″ | 23 | 15 | Y | ... | ... | Perched | 170 | Seawall | ||
| Boulari-Pirogues Bay | ||||||||||||
| 7-Oct | 22°15′33.92″ | 166°33′23.48″ | 29 | 15 | Y | ... | ... | Perched | 3 | Cliff | ||
| 8-Oct | 22°16′15.65″ | 166°33′35.31″ | 29 | 15 | N | ... | ... | Line | 30 | Cliff | ||
| 9-Oct | 22°1624.58″ | 166°34′16.81″ | 29 | 20 | N | ... | Perched | 10 | Hill | |||
| 11-Oct | 22°17′47.21″ | 166°39′30.72″ | 32 | 20 | Y | ... | Ridge | 15 | Hill | |||
Table 2: Geomorphological Characteristics of Sample Locations and Pumice Samples from the 2010 Field Study in New Table 1: Geomor
*Ɵs is the surface sigma export time in days as shown in Figure 5A of jouon et al. (2006). †The presence of fluvial sediments as determined by satellite photos. Y = yes, N = no. P = possibly. ‡Coastal regions as follows: Southeast = Prony to Hienghene, Northeast = Hienghene to Pourn peninsula. Northwest = Pourn peninsula to Ouaco, Central west = Ouaco to Baie de St. Vincent. Southwest = Baie de St. Vincent to Prony. ** N.D. = not determined.
| Pumice Abundance | Maximum clast size (phi††) | Average Rounding | Geographical location | |||||||
| Abundant | -7 | Slightly angular | Karma Tera Ecolodge, Port Boise | |||||||
| Rare | -5 | Angular | Campground at Plage de Port Bouquet | |||||||
| Abundant | -6 | Slightly rounded | St. Philippe II Beach | |||||||
| Rare | -5 | Angular | Village park. Kouaoua | |||||||
| Rare | -5 | Slightly rounded | Beach 250 m in north of Poro | |||||||
| Abundant | -5 | Slightly angular | RPN3 at Moneo River | |||||||
| Rare | -5 | Slightly rounded | RPN3 at Tiwalca River | |||||||
| Very abundant | -7 | Well rounded | Plage de St, Mathieu, Pouebo | |||||||
| Abundant | -6 | Slightly rounded | Route de Pam, 10 km west of the north junction with RPN7 | |||||||
| Rare | -5 | Slightly angular | Pier at Poum village | |||||||
| Rare | N.D. | N.D. | Malabou Beach Hotel, Poum | |||||||
| Very rare | -7 | Very angular | Depot de Mineral. Gomen, Baie de Gomen | |||||||
| Abundant | -5 | Slightly angular | Pier at west end of Route de Foui, Komi | |||||||
| Abundant | -5 | Round | Plage de Foue, Kane |
| Abundant | -7 | Slightly angular | Nipoui Pier |
|---|---|---|---|
| Abundant | -6 | Slightly rounded | Bale de Teremba |
| Abundant | -6 | Slightly rounded | Bourake campground |
| Abundant | -6 | Slightly angular | Bourake headland |
| Abundant | -7 | Slightly rounded | Residential area 2 km north of Bourake campground |
| Rare | -6 | Slightly rounded | Ouenghi Marina, Port Ouenghi |
| Very abundant | -6 | Slightly rounded | End of southernmost street crossing Ave de Port Ouenghi |
| Rare | -4 | Slightly rounded | Quai de Tomo |
| Rare | -5 | Slightly rounded | End of the dirt road going north from Quai de Tomo |
| Rare | -6 | Round | Kuendu Beach, Noumea |
| Very abundant | -6 | Slightly rounded | Plage de Bale des Citrons, Noumea |
| Abundant | -5 | Slightly rounded | Plage de I'Anse Vata, west of Fun Beach Bar.. Noumea |
| Abundant | -6 | Round | Plage de I'Anse Vata, east of Fun Beach Bar.. Noumea |
| Abundant | -6 | Round | Plage de I'Anse Vata at Route de I'Anse Vata, Noumea |
| Abundant | -7 | Round | Plage de Magenta, Noumea |
| Rare | -5 | Slightly rounded | West end of Rue de Pointe d'Och, north of Vallon Dore on RP2 |
| Abundant | -6 | Slightly rounded | Promenade de Vallon Dore 500 rn west of Rue de Panorama |
| Rare | -5 | Well rounded | RP2 at Rue des Poinsettias, Vallon Dore |
| Rare | -5 | Slightly angular | Bale des Pirogues, 500 m west of Rue des Duillets on RP1 |
![Figure 4: Profile view of a classically defined beach [28].The beach can be broken up into at least four distinct zones based on prevalent processes: (1) the nearshore, which has an upper limit of mean low tide (MLT), with a nearshore bar present; (2) the foreshore, which is the active shore face between MLT and the berm crest at the highest tide line, a little above mean high tide (MHT); (3) the backshore, represented by the landward face of the berm; (4) the beach boundary, which is typically a hill, cliff, or seawall.](/fulltextimages/744/fig_4.png)
Figure 4: Profile view of a classically defined beach [28].The beach can be broken up into at least four distinct zones based on prevalent processes: (1) the nearshore, which has an upper limit of mean low tide (MLT), with a nearshore bar present; (2) the foreshore, which is the active shore face between MLT and the berm crest at the highest tide line, a little above mean high tide (MHT); (3) the backshore, represented by the landward face of the berm; (4) the beach boundary, which is typically a hill, cliff, or seawall.
![Figure 5: Profile view of New Caledonian beach morphotypes [29,30]. Key: (1) underlying geology forming a beach platform backed by a hill or cliff, (2) sea level as represented by mean low tide, (3) intertidal beach sediments, and (4) subaerial backshore sediment deposit (ridge, berm, or dune). Grey shading represents pumice deposit, marked by t he letter “p” with an arrow pointing toward the deposit. (A) Beach with ridge or berm; landward boundary is a hill, cliff, or seawall; pumice occurs in the backshore deposit. (B) Beach with climbing dunes; pumice occurs in strandlines in the upper foresh ore or lower backshore. (C) Bermless beach; landward boundary is hill or cliff; pumice occurs in strandlines located in one of three (1) in the backshore, (2) trapped in grass at the base of the landward hill, (3) trapped in the grass at the top of the low (<1 m tall) landward cliff. (D) Bermless beach with tall cliff; pumice occurs in small sediment deposits trapped behind trees in the foreshore. (E) Bermless beach with low seawall; pumice occurs in strandlines perched above seawall.](/fulltextimages/744/fig_5.jpeg)
Figure 5: Profile view of New Caledonian beach morphotypes [29, 30]. Key: (1) underlying geology forming a beach platform backed by a hill or cliff, (2) sea level as represented by mean low tide, (3) intertidal beach sediments, and (4) subaerial backshore sediment deposit (ridge, berm, or dune). Grey shading represents pumice deposit, marked by t he letter “p” with an arrow pointing toward the deposit. (A) Beach with ridge or berm; landward boundary is a hill, cliff, or seawall; pumice occurs in the backshore deposit. (B) Beach with climbing dunes; pumice occurs in strandlines in the upper foresh ore or lower backshore. (C) Bermless beach; landward boundary is hill or cliff; pumice occurs in strandlines located in one of three (1) in the backshore, (2) trapped in grass at the base of the landward hill, (3) trapped in the grass at the top of the low (<1 m tall) landward cliff. (D) Bermless beach with tall cliff; pumice occurs in small sediment deposits trapped behind trees in the foreshore. (E) Bermless beach with low seawall; pumice occurs in strandlines perched above seawall.
Figure 6a: Profile view of the headland about 500 m east of the Bouraké Campground looking north toward the Baie de St. Vincent (location 10-28). This is a bedrock beach with a small ridge deposit at the base of a larger berm like deposit in the backshore, backed by agrassy hill.
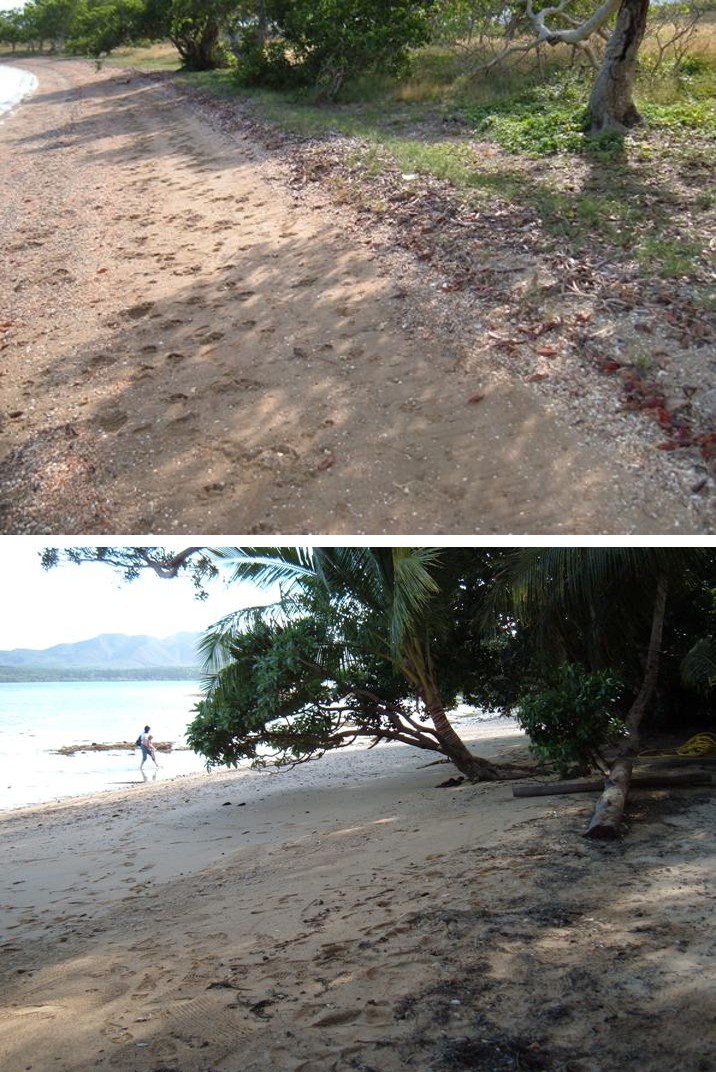
Figure 6b: Profile view looking west along a semiprivate beach in the residential area adjacent to Port Ouenghi (location 10-30). A small ridge typical of New Caledonian “berm” type beaches is visible in the backshore.
Pumice abundances ranged from very abundant to very rare, but pumice was abundant on average. The angularity of collected samples ranged from very angular to well rounded, with an average of slightly rounded. The maximum size of collected samples ranged from medium pebbles (4φ) to small cobbles (7φ), with an average of very coarse pebbles (6φ). Abundant pumice tended to be of average size (6 φ) and angularity (slightly rounded). Rare pumice tended to be slightly smaller than average (5φ), with bimodal angularity (angular or slightly rounded). Abundant to very abundant pumice occurred in every coastal region except the northwest, where pumice was always rare to very rare (10-14 to 16). Otherwise, pumice abundance was loosely tied to the width of the lagoon, the size distribution of beach sediments, and beach morphology. Abundant pumice tended to occur at berm type beaches on the open coast, where the lagoon was narrower, typically at either slightly embayed sandy to muddy beaches (Figure 6b) or intermediate width bedrock beaches along bay headlands (Figure 6a). Rare pumice tended to occur well inside the deepest bays, such as in the Baie de St. Vincent (10-30 to 33), the Dumbéa (10-06) and Boulari Pirogues (10-07 to 09, 10-11) bays adjacent to the Nouméan peninsula, and the rias (10-21) and estuaries (10-24) of the east coast. However, even the deepest days, anomalously abundant pumice occurred at localized sandy beaches (10-08, 10-30). Narrow, cliffed beaches had rare pumice regardless of reef proximity, probably because pumice could only be found in perched strand deposits on top of low (<1 m) cliffs (Figure: 5C3, 30; 10-21, 10-26), or trapped behind obstructions in the upper foreshore (Figure 5D, 24; 10-07, 10-22, 10-24). In contrast, narrow beaches without cliffs tended to have pumice abundances consistent with regional values, as pumice could become stranded at any elevation on grass covered hills above the backshore (Figure 5C2; 10-04, 10- 09).
Beach Sediments and Morphology
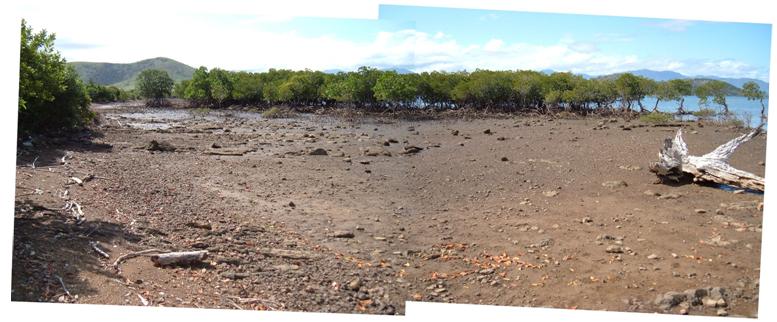
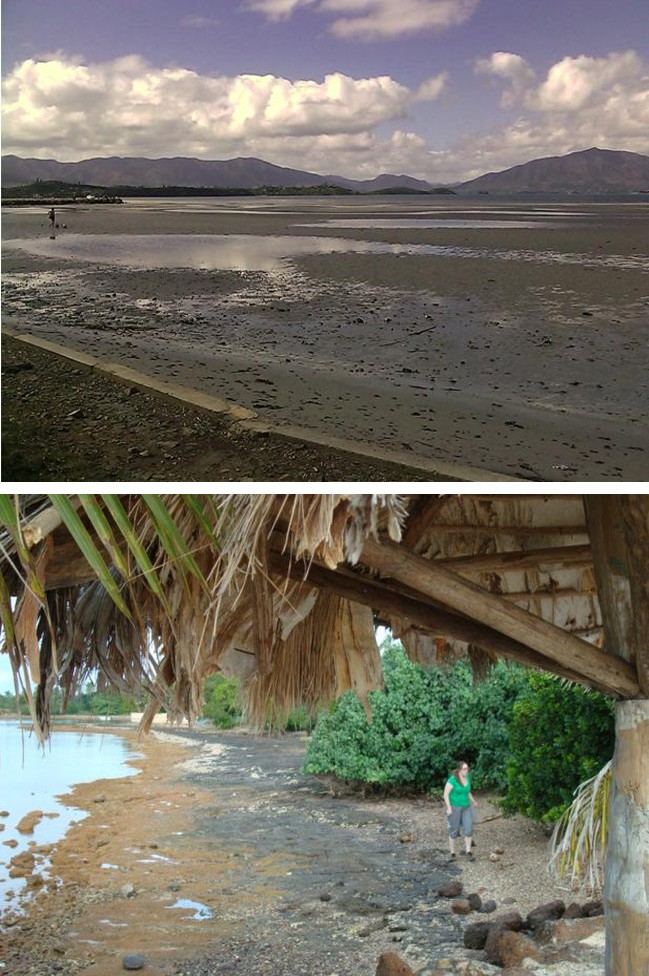
The size distribution of beach sediments was somewhat indicative of the amount of wave energy available to a beach, e.g. gravel tended to occur on the open coast or along bay headlands, sand tended to accumulate in shallow bays on the open coast, and mud tended to occur deep inside bays. However, the presence of fluvial sediments tended to increase the proportion of either gravel or mud, such as at tidal lagoons hosting mangrove forests (Figure 7a) or estuarine mud flats (Figure 7b).
boulder gravel. This distinction is important because artificial boulder gravel occurred without regard to wave energy, but the presence of boulder gravel often significantly reduced the size of the supratidal depositional area. At some of these beaches, pumice deposits only occurred in localized gullies (10-02, 10-16), on the leeward side of jetties, or on top of short seawalls.
Figure 7c: Profile view of the beach at Poum, looking southeast from the pier (location 10-14). This beach has developed beach rock in the foreshore. The backshore contains unconsolidated sediments.
Discussion
On the macro scale, pumice abundance was directly related to the width of the lagoon adjacent to the beach. However, this relationship did not continue into the meso scale. For example, there were localized sandy beaches in the deeper bays with anomalously abundant pumice, and there were also narrow, cliffed beaches on the open coast with anomalously rare pumice. Furthermore, pumice was always rare to very rare in the northwest, regardless of other factors. A simple explanation is that on the macro scale, lagoon width was directly proportional to longshore wave energy, which in turn was inversely proportional to the distance from the barrier reef [7, 24]. However, on the meso scale, bathymetric and topographic irregularities created fluctuations in the wave energy distribution that were reflected in the pumice distribution [11, 8, 24]. Modeled the energy distribution of surface currents in the New Caledonian lagoon from the Baie de St. Vincent south. Wave energies were reported in terms of the surface water export time, θ, which is the number of days needed to replace an initial volume of surface water in the lagoon with new water from the open ocean. Pumice was abundant wherever θ was below a threshold value that varied by region. Specifically, in the Baie de St. Vincent, pumice was abundant wherever θ was less than 8 days, which increased to 15 days in the bays surrounding the Nouméa peninsula. Only two beaches in the modeled area did not conform to this model (10-06, 10-29), possibly due to unmodeled complexities in water flow at the micro scale in structurally controlled bays [30]. In Boulari Bay and the Baie de St. Vincent, two sandy beaches that were previously described as having anomalously abundant pumice (10-08, 10-30) actually corresponded to localized energy highs where θ dropped below the regional threshold values. Additionally, in one of these high energy areas, there was a narrow, cliffed beach with rare pumice (10-07), similar to ones on the open coast, supporting the idea that pumice was rare at these beaches not because of a low θ but because there was no supratidal depositional area. Extrapolating to the rest of the island perimeter, pumice should have been abundant wherever θ was below the regional threshold value, provided there were no topographical restriction ns to pumice deposition. However, since the beach characteristics observed in the northwest did not deviate significantly from other beaches around the island, there must have been some other, unidentified factor involved in pumice distribution.
Since most of the beaches around the island were supplied pumice by long shore waves derived from the SEC, it could be that pumice was universally rare in the northwest because of a lack of pumice in long shore waves derived from the STCC. In addition to supplying pumice, long shore waves provided the dominant means of removing sediment from a beach, as well as supplying sand produced by sorting during long shore drift [28]. Sandy beaches were typically of intermediate width (5 to 40 m) and had abundant pumice, suggesting that long shore sediments only accumulated where θ was below the regional threshold (e.g on the open coast). Where long shore input lagged behind removal, either due to low θ (e.g. deep in bays) or headland bypass, beaches were composed of bare bedrock or locally derived gravels. Conversely, beaches near fluvial point- sources became dominated by fluvial mud or gravel that could potentially overwhelm long shore sediment removal, increasing beach widths to well above the 40m attained by sand beaches. Taking narrow (0 to 5 m) to intermediate (5 to 40 m) width beaches as “healthy”, it becomes apparent that of the beaches with fluvial sediments, “healthy” beaches tended to be located on the open coast (i.e. θ < threshold value, pumice abundant unless restricted by topography; 10-12, 10-17, 10-19, 10-23, 10-27 to 28). If embayed, “healthy” beaches were either somewhat removed from the dominant fluvial source (i.e. θ > threshold value, pumice rare; 10-11, 10-32 to 33), or situated within a localized energy high (10-07, 10-24). Conversely, “unhealthy” beaches (i.e. those wider than 40 m) tended to be situated very near the river mouth (10-21) or in secondary depositional areas downstream, such as mangrove swamps (not sampled), tidal lagoons (10-29), or mudflats (10-05). However, for “healthy” beaches with low values and either abundant pumice or rare pumice with cliffs in the backshore, further research would be needed to determine the volume of sediment bypassing each beach as well as to determine the ultimate destination of the sediment, such as a secondary depositional area downstream, or out to the lagoon, where elevated turbidity could affect corals.
Conclusion
The pumice samples collected in 2008 and 2010 from beaches around New Caledonia were of fairly uniform geochemistry and were shown to be from two recent eruptions in Central Tonga. The 2008 samples were dominantly from a 2006 eruption of Metis Shoal, but the
2010 samples were dominantly from a 2001eruption of an unnamed volcano. From 2008 to 2010, the Metis Shoal samples were likely removed from beaches by storms, exposing older pumice at higher elevations as the dominant pumice deposits. This natural attenuation of pumice by high energy waves caused pumice abundances to naturally mimic wave energies, providing a land based method of measuring wave intensities. On a macro scale, pumice abundance corresponded inversely with the width of the lagoon from the barrier reef to the beach. However, this relationship broke down on the meso scale, where bathymetric and topographic irregularities altered the wave energy distribution. On the meso scale, pumice abundance no New Caledonia drift pumice: implications for sediment transport 10 longer corresponded to lagoon width, but continued to correspond directly to wave energy. Furthermore, this relationship continued into the micro scale, to a resolution not attained by a published energy distribution map by Jouon et al. (2006) [24]. By using beach width as an indicator of the presence and extent of hyper sedimentation in the near shore area, pumice abundance can be used to determine whether sedimentation is restricted to the area immediately surrounding the beach, or whether sediment bypass might be contributing to hyper sedimentation downstream. This application could be useful for determining where to search for the places worst hit by mining or urban waste.
Acknowledgements
The authors would like to thank the National Science Foundation (OISE IRES Grant 0727323 to Dr. K.N. Nicholson), and Ball State University (ASPiRE Research Grant I215 10 to Ariel Stewart).
References
-
World Heritage Committee (2009) Decision: 32 COM 8B.10, in Decisions, Convention Concerning the Protection of the World Cultural and Natural Heritage, 32nd, Quebec City, Canada, July 2008: Paris, United Nations Educational Scientific & Cultural Organization, pp: 153-155.
-
Schwartz MO, Kgomanyane J (2008) Modelling natural attenuation of heavy metal ground water contamination in the Selebi Phikwe mining area, Botswana. Environmental Geology 54(4): 819-830.
-
Dumas P, Printemps J, Mangeas M, Luneau G (2010) developing erosion models for integrated coastal zone management: A case study of the New Caledonia west coast. Mar Pollut Bull 61(7-12): 519- 529.
-
Marchand C, Allenbach M, Lallier-Vergès E (2011) Relationships between heavy metals distribution n and organic matter cycling in mangrove sediments (Conception Bay, New Caledonia). Geoderma 160(3- 4) : 444-456.
-
Bird ECF, Dubois JP, Iltis JA (1984) the impacts of opencast mining on the rivers and coasts of New Caledonia: Tokyo, Japan, The United Nations University pp: 64.
-
Ambatsian P, Fernex F, Bernat M, Parron C, Lecolle J (1997) High metal inputs to closed seas: the New Caledonian lagoon. Journal of Geochemical Exploration 59(1): 59-74.
-
Douillet P (1998) Tidal dynamics of the south west lagoon of New Caledonia: Observations and 2D numerical modeling. Oceanologica Acta 21(1): 69-79.
-
Jouon A, Ouillon S, Douillet P, Lefebvre JP, Fernandez JM, et al. (2008) Spatio-temporal variability in suspended particulate matter concentration and the role of aggregation on size distribution in a coral reef lagoon: Marine Geology 256: 36-48.
-
Ouillon S, Douillet P, Lefebvre JP, Gendre RL, Jouon A, et al. (2010) Circulation and suspended sediment transport in a coral reef lagoon: The south west lagoon of New Caledonia. Mar Pollut Bull 61(7-12): 269-296.
-
Bird P (2003) An updated digital model of plate boundaries. Geochemistry Geophysics Geosystems 4(3): 1027.
-
Douillet P, Ouillon S, Cordier E (2001) A numerical model for fine suspended sediment transport in the southwest lagoon of New Caledonia. Coral Reefs 20(4): 361-372.
-
Davis RE (2005) Intermediate depth circulation of the Indian and South Pacific Oceans measured by autonomous floats. JPO 35: 683-707.
-
Marchesiello P, Lefèvre J, Vega A, Couvelard X, Menkes C (2010) Coastal upwelling, circulation and heat balance around New Caledonia's barrier reef. Marine Pollution Bulletin 61(7-12): 432-448.
-
Gasparin F, Ganachaud A, Maes C (2011) A western boundary current east of New Caledonia: Observed characteristics. Deep Sea Research Part I, Oceanographic Research Papers 58(9): 956-969.
-
Tenório MMB, Borgne, RL, Rodier M, Neveux J (2005) The impact of terrigeneous inputs on the Bay of Ouinné (New Caledonia) phytoplankton communities: A spectrofluorometric and microscopic approach. Estuar Coast Shelf Sci 64: 531-545.
-
Neveux J, Lefebvre JP, Gendre RL, Dupouy C, Gallois, F, et al. (2010) Phytoplankton dynamics in the southern New Caledonian lagoon during a southeast trade winds event: Journal of Marine Systems 82(4): 230- 244.
-
Richards AF (1953) Transpacific distribution of floating pumice from Isla San Benedicto, Mexico. Deep-Sea Research 5(1): 29-30.
-
Bryan SE, Cook A, Evans JP, Colls PW, Wells MG, et al. (2004) Pumice rafting and faunal dispersion during 2001-2002 in the Southwest Pacific: Record of a dacitic submarine explosive eruption from Tonga. Earth and Planetary Science Letters 227(1-2): 135- 154.
-
Ward WT, Little IP (2000) Sea-rafted pumice on the Australian east coast: Numerical classification and stratigraphy. Australian Journal of Earth Sciences 47(1): 95-109.
-
Webb DJ (2000) Evidence for shallow zonal jets in the South Equatorial Current region of the Southwest Pacific. Journal of Physical Oceanography 30(4): 706- 720.
-
Ganachaud A, Gourdeau L, Kessler W (2008) Bifurcation of the Subtropical South Equatorial Current against New Caledonia in December 2004 from a Hydrographic Inverse Box Model. Journal of Physical Oceanography 38(9): 2072-2084.
-
Schiller A, Oke PR, Brassington G, Entel M, Fiedler R, et al. (2008) Eddy-resolving ocean circulation in the Asian Australian region inferred from an ocean reanalysis effort. Prog Oceanogr 76(3): 334-365.
-
Brinkman R, Wolanski E, Deleersnijder E, McAllister F, Skirvinga W (2001) Oceanic inflow from the Coral Sea into the Great Barrier Reef. Estuar Coast Shelf Sci 54(4): 655-668.
-
Jouon A, Douillet P, Ouillon S, Fraunié P (2006) Calculations of hydrodynamic time parameters in a semi opened coastal zone using a 3D hydrodynamic model. Continental Shelf Research 26(12-13): 1395- 1415.
-
Jouon A, Lefebvre JP, Douillet P, Ouillon S, Schmied L (2009) Wind wave measurements and modelling in a fetch limited semi enclosed lagoon. Coastal Engineering 56: 599-608.
-
Pinazo S, Bujan S, Douillet P, Fichez R, Grenz C, et al. (2004) Impact of wind and fresh water inputs on phytoplakton biomass in the coral reef lagoon of New Caledonia during the summer cyclonic period: a coupled three dimensional biogeochemical modeling approach. Coral Reefs 23(2): 281-296.
-
Ouillon S, Douillet P, Andréfouët S (2004) Coupling satellite data with in situ measurements and numerical modeling to study fine suspended sediment transport: a study for the lagoon of New Caledonia. Coral Reefs 23: 109-122.
-
Davis RA (1978) Beach and nearshore zone, in Davis RA (ed), Coastal sedimentary environments. New York, Springer Verlag, pp: 237-285.
-
Hesp PA, Short AD (1999) Barrier morphodynamics, in Short AD, (ed.) Handbook of beach and shoreface morphodynamics. John Wiley and Sons, New York, pp: 307-333.
-
Short AD, Masse link G (1999) Embayed and structurally controlled beaches, in Short AD, (ed.,) Handbook of beach and shoreface morphodynamics. John Wiley and Sons, New York, pp: 230-250.
- Genetic Improvement of Nile Tilapia (Oreochromis niloticus): Advances in Selective Breeding and Genomic Approaches for Sustainable Aquaculture
- Microplastics, Contaminants, and Waste Hotspots: Divergences and Faults in Prioritizing Control Efforts
- Creating a Healthier, More Vibrant Open and Closed Aquatic Environment. A Submersible, Centrifugal Magnetically Affixed Current Changing Aquarium Pump
- An Attempt to Assess Alpha Diversity and Sample Size: Using the Ostracod Assemblages off Kumamoto Port, Japan
- Assessment of the Efficiency of Common Fishing Gears and Crafts Used at Mohananda River of Chapai Nawabganj, Bangladesh
- Fish Productivity and Biodiversity Status of Sundarban Mangrove in Bangladesh