An Attempt to Assess Alpha Diversity and Sample Size: Using the Ostracod Assemblages off Kumamoto Port, Japan
Micropalaeontologists often encounter select the appropriate number of individuals per sample based on the study objectives and consider the trade-offs between analysing more samples with fewer individuals and analysing a larger sample size with fewer samples. The relationship between a number of individuals and Shannon’s index using rarefaction is useful for finding this compromise. However, previous methods of calculating the Shannon index using rarefaction have not discussed how to determine the number of individuals required for sampling. Here, we present a new empirical relationship between the specimen number and alpha diversity using the extant ostracod assemblage of Kumamoto Port, Kyushu, Japan. If we define a gradient of 0.002 or less as the rarefaction curve being sufficiently flat, then when Shannon’s index calculated from the number of individuals extracted is plotted in the area below the line with a gradient of 0.002, we can consider that a sufficient number of individuals have been picked up. In the case of Kumamoto Port, the maximum number of individuals required was calculated to be 229, a result consistent with the number of individuals required to extract microfossils, which has been statistically estimated so far. However, since the explanatory coefficient between the number of individuals and Shannon’s index is extremely high, even when a gradient of 0.005, it can be said that 116 individuals are sufficient for Kumamoto Port. This study presented a new method for determining the number of individuals required to estimate species diversity from rarefaction curves.
Seishiro Higashi¹* and Gengo Tanaka2#
¹Faculty of Science, Kumamoto University, Japan ²Center for Water Cycle, Marine Environmental and Disaster Management, Kumamoto University, Japan
Introduction
In the field of micropalaeontology, the Shannon’s index [1] is often used to calculate alpha diversity (e.g. [2, 3, 4]). Shannon’s index, H(S), is expressed by the following Equation 1:
i i i H s p lnp = = −∑ (1)
1 ( ) s where S = number of species; pi = the relative abundance of i-th species, the number of individuals of species i in the community divided by the total number of individuals of all S species. The H’ is a nonparametric index that does not assume a constant distribution pattern for population size, and is characterised by its sensitivity to the number of rare species in a population. However, it has been pointed out that alpha diversity is sensitive to sample size [5].
In the case of micropalaeontology, the number of individuals obtained in the field is often sufficient, but because they are so numerous, it takes a lot of time to extract and count them. Therefore, when extracting and counting in the laboratory, it is necessary to set in advance a number of individuals that reflects the total population. Phleger suggested 300 specimens as a sufficient number to determine the relative abundances of foraminiferal species [2], based on Dryden’s results on heavy minerals [6]. Shaw arrived at a similar answer from a binomial distribution [7]. Revets summarises the probability of sampling and oversight and discusses the importance of displaying confidence intervals when calculating diversity indices (here Fisher’s diversity index) [8]. Foraminiferal studies have recommended a sampling target of 300 individuals [9].
Patterson and Fishbein generated a logarithmic contour plot of the percentage of abundance against the total number of specimens to show the error in abundance at the 95% confidence level [10]. They state that at least 50 counts should be used for indicator species with abundances of about 50% or more, 300 counts for species that make up about 10 percent of the samples, 500 to 1,000 counts for species that make up 5 percent of the samples, and several thousand counts are needed to define species that make up 1 percent of the samples. Fatela and Taborda calculated binomial confidence limits for deep-sea benthic foraminiferal assemblages and showed that samples of around 100 individuals are sufficient for character-species-based studies [11].
In the case of deep-sea ostracod assemblages from deep- sea cores, averaging 60 specimens per sample is enough for reconstructing the detail of palaeoenvironmental change [12]. Danielopol, et al. [13] state that the number of individuals needed per sample is influenced by many factors, including material availability, grain size distribution, geographic considerations, number of cores, availability of other proxy methods (e.g., stable isotopes, other microfossil data), and desired time resolution. Thus, researchers should select the appropriate number of individuals per sample based on the study objectives and consider the trade-offs between analysing more samples with fewer individuals and analysing a larger sample size with fewer samples.
Methods to capture the response of diversity to sample size include rarefaction [14], which estimates the response of species diversity below the observed sample size, and extrapolation [15], which estimates the response above it. This allows us to calculate diversity between communities fairly, regardless of differences in sample size, based on subsamples of size ([16], but see McMurdie PJ [17] for the need to calculate rarefaction). However, when it comes to rarefaction, no specific value has been proposed that would be considered to be sufficient to extract and flatten (rarefaction) the actual sample.
The statistical software Past Hammer Ø [18] also incorporates programs for diversity and rarefaction, making it extremely useful for micropaleontological research. In this study, we present a new empirical relationship between the specimen number and alpha diversity using the extant ostracod assemblage of Kumamoto Port, Kyushu, Japan. By doing so, the rarefaction curve produces a value for species diversity that can be considered to represent a sufficient number of individuals.
Method
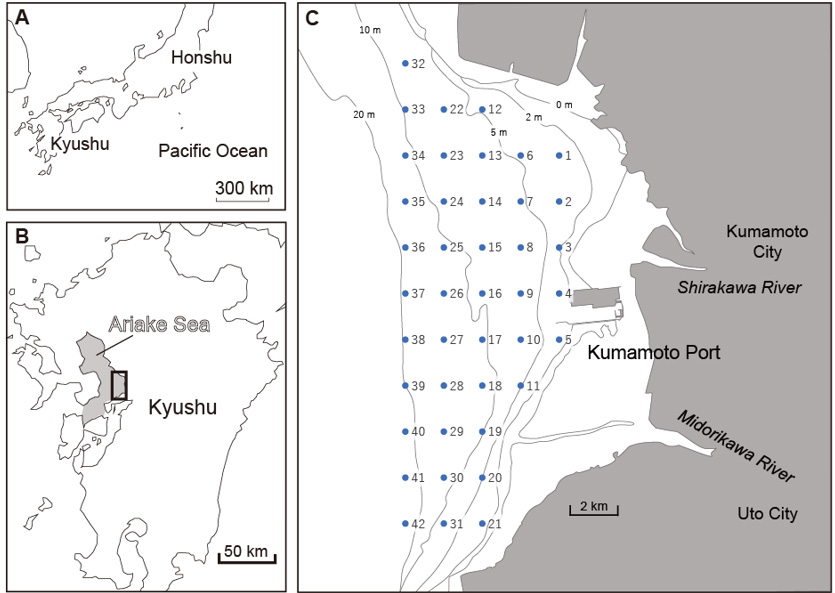
A total of 42 sediments were collected at one-minute intervals in latitude and longitude off Kumamoto Port using a Grab Sampler (Figure 1). During collection, approximately 1 cm of the surface sediments was scooped on board the ship. Samples for ostracod observation were passed through sieves with openings of 1 mm and 63 μm, and the remaining samples of 1 mm to 63 μm were dried in an incubator for at least one day.
The dried samples were divided into appropriate amounts using a divider. The divided samples were observed under a binocular stereo microscope, and the following previous studies [19, 20, 21], we aimed to select 200 individuals per location. When counting the number of individuals, no distinction was made between carapace (bivalve), valve, adults, juveniles, and fragments, and each that could be identified was counted as one individual.
To confirm whether the number of ostracod individuals identified at each site adequately represented the species diversity at that site, we performed rarefaction [22] using the statistical software Past 5.0.2 [18] and calculated the Shannon’s index S(H) for each rarefaction sample size. The difference between S(H) when sample size n+1 and n was calculated and used as the gradient when sample size n was used. The sample size for which the gradient was 0.002 or less was considered to be the sample size for which S(H) was sufficiently flat.
Result
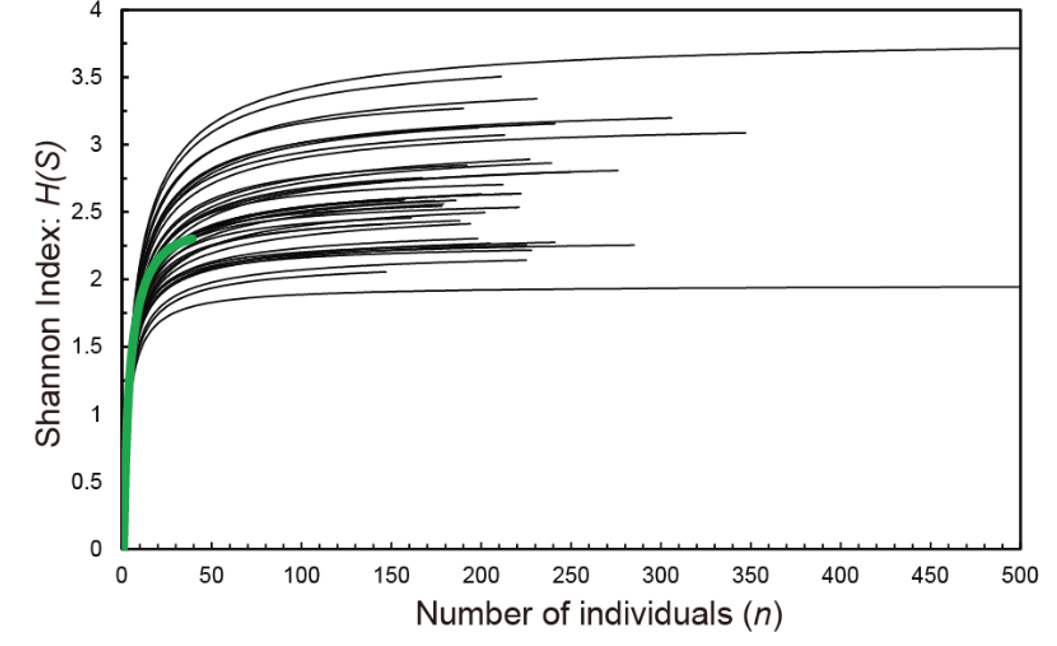
As a result of microscopic examination of 42 locations in the surveyed sea area, 59 genera, 139 species, 9188 individuals of ostracods were identified (Appendix A). St.3 did not produce any ostracods. Rarefaction was performed on 41 locations (Figure 2). Among these, St.4 (thick green line in Figure 2), which had a small number of individuals and did not produce a gradient (gr) of S(H) of 0.002 or less for the number of samples, was excluded from the following analysis.
Discussion
Since there is no defined saturation point for rarefaction, we assumed that the relationship between population size and H(S) was sufficiently flat (saturated) using the criterion that the slope of H(S) for diluted samples was 0.002 or less. When the criterion was set to gr = 0.005, 0.004, 0.003, 0.002, and 0.001, we found that there was a strong correlation between Shannon’s index H(S) and the number of samples that met this criterion (Figure 3A). The larger the gradient, the larger the explanatory coefficient (R2) value, but this is due to the assumption that saturation occurs at low population numbers. Even with a gradient of 0.002.
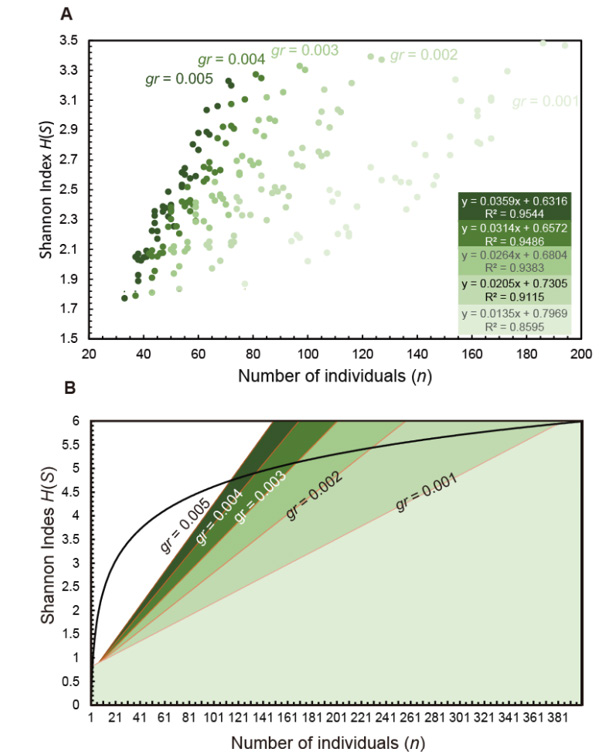
Figure 3: Relationship between number of individuals and Shannon’s index among five different gradients (gr =0.005, 0.004, 0.003, 0.002, 0.001) of Recent ostracods off Kumamoto Port, Ariake Sea, Kyushu, Japan. A. Plots of 40 sites and its approximation line with explanatory coefficient (R2) when gr = 0.005, 0.004, 0.003, 0.002, and 0.001. B. Five thresholds between the population size and S(H). The curve shows the maximum value of Shannon’s index H(S) when one individual of each species is occurred.
which is assumed to be sufficiently small, the R2 value exceeds 0.91. Therefore, by using the relationship between the number of individuals and S(H) when the gradient is 0.002 or less, it is possible to consider whether the number of individuals collected in the future, at least off the coast of Kumamoto Port, will be sufficient to calculate S(H). Figure 3B shows the relationship between the gradient, the number of individuals, and S(H) based on the approximation line for each gradient. If we define a gradient of 0.002 or less as the rarefaction curve being sufficiently flat, then when S(H) calculated from the number of individuals extracted is plotted in the area below the line with a gradient of 0.002, we can consider that a sufficient number of individuals have been picked up (Figure 3B). Assuming that one individual of each species is found in a sample, it is possible to find the maximum possible value of Shannon’s index S(H) (curve in Figure 3B). In this case, the intersection of the line for each gradient (gr) and the S(H) curve indicates the upper limit of the number of individuals required for extraction. According to the calculation results, 229 individuals are required when gr = 0.002, and 381 individuals when gr = 0.001, which is in good agreement with previous studies that recommend 300 individuals to be extracted [2, 7, 9]. In reality, S(H) varies depending on the ocean area, so considering the time and effort involved [12, 13], it is more realistic to adopt the straight line for gr = 0.002, at least for Kumamoto Port. However, since the explanatory coefficient between the number of individuals and S(H) is extremely high (R2 =0.9544), even when gr = 0.005, it can be said that 116 individuals are sufficient for an inland bay like Kumamoto Port. This result is close to the number of individuals extracted for microfossils in deep-sea areas [11]. To make the method of evaluating α diversity using the sample size and S(H) more reliable, data collection in other bays and seas is necessary. This study proposed a new method for determining reasonable values of species richness using rarefaction curves. The results are consistent with existing statistical methods.
Conclusion
We presented a new method for determining the number of individuals required to estimate species diversity from rarefaction curves. In the case of Kumamoto Port, the maximum number of individuals required was calculated to be 229, which is consistent with the number of individuals required for microfossil collection that has been statistically estimated so far. However, because the explanatory coefficients for the number of individuals and the Shannon index are very high, it can be said that 116 individuals are sufficient even when the slope is 0.005.
Data Availability
Original data is listed in Appendix A.
Sample Availability
Specimens are available from GT.
Author Contributions
SH conceived and GT designed the research. SH and GT carried out the research and analyses. GT wrote the paper with contributions from SH.
Competing Interests
Authors declare there are no competing interests.
Acknowledgements
Hideyuki Shimazaki (Aitsu Marine Station, Kumamoto University) provided us with a lot of help during the survey, including manoeuvring the ship. Ayari Yanagihara and Kyohei Yoshimoto (Kumamoto University) provided assistance with the survey. We would like to express our gratitude to all of these people.
References
-
Shannon CE (1949) A Mathematical theory of communication. Illinois, University of Illinois Press.
-
Phleger FB (1960) Ecology and distribution of Recent Foraminifera. Baltimore: John Hopkins University Press.
-
Ottens JJ, Nederbragt AJ (1992) Planktonic foraminiferal diversity as indicator of ocean environments. Mar Micropaleontol 19: 13-28.
-
Blanco S, Olenici A, Ortega F, Jiménez-Gómez F, Guerrero F (2020) Identifying environmental drivers of benthic diatom diversity: the case of Mediterranean mountain ponds. Peer J 8: e8825.
-
Lande R (1996) Statistics and partitioning of species diversity, and similarity among multiple communities. Oikos 76: 5-13.
-
Dryden AL (1931) Accuracy in percentage representations of heavy mineral frequencies. Proc Nat Acad Sci 17: 233-238.
-
Shaw AE (1964) Time in Stratigraphy. New York, McGraw-Hill, USA.
-
Revets SA (2004) On confidence intervals from micropalaeontological counts. J Micropalaeontol 23: 61- 65.
-
Schönfeld J, Alve E, Geslin E, Jorissen F, Korsun S, et al. (2012) The FOBIMO (FOraminoferal Bio-Monitoring) initiative–Towards a standardised protocol for soft- bottom benthic foraminiferal monitoring studies. Mar Micropaleontol 94-95: 1-13.
-
Patterson RT, Fishbein A (1989) Re-examination of the statistical methods used to determine the number of point counts needed for micropaleontological quantitative research. J Paleontol 63: 245-248.
-
Fatela F, Taborda R (2002) Confidence limits of species proportions in microfossil assemblages. Mar Micropaleontol 45: 169-174.
-
Cronin TM, Raymo ME (1997) Orbital forcing of deep- sea benthic species diversity. Nature 385: 624-626.
-
Danielopol DL, Ito E, Wansard G, Kamiya T, Cronin TM, et al. (2002) Techniques for collection and study of Ostracoda, In The Ostracoda: Applications in Quaternary Research pp: 65-95.
-
Sanders HL (1968) Marine benthic diversity: a comparative study. Am Nat 102: 243-282.
-
Chao A, Jost L (2012) Coverage-based rarefaction and extrapolation: standardizing sample by completeness rather than size. Ecology 93(12): 2533-2547.
-
Weiss S, Xu ZZ, Peddada S, Amir A, Bittinger K, et al. (2017) Normalization and microbial differential abundance strategies depend upon data characteristics. Microbiome 5: 27.
-
McMurdie PJ, Holmes S (2014) Waste not, want not: Why rarefying microbiome data is inadmissible. PLOS Computational Biol 10: e1003531.
-
Hammer Ø, Harper DAT, Ryan PD (2001) PAST: Paleontological statistics software package for education and data analysis. Palaeontol Electro 4: 1-9.
-
Ozawa H, Kamiya T, Kato M, Tsukawaki S (2004) A preliminary report on the Recent ostracodes in sediment samples from the R.V. Tansei-mru Cruise KT01-14 in the southwestern Okhotsk Sea and the northeastern Japan Sea off Hokkaido. Bull Japan Sea Res, Institute 35: 33-45.
-
Irizuki T, Seto K, Nomura R (2008) The impact of fish farming and bank construction on Ostracoda in Uranouchi Bay on the Pacific coast of southwest Japan- Faunal changes between 1954 and 2002/2005. Paleontol Res 12: 283-302.
-
Tian SY, Yasuhara M, Condamine FL, Huang HSM, Fernando AGS, et al. (2024) Cenozoic history of the tropical marine biodiversity hotspot. Nature 632: 343- 349.
-
Chao A, Gotelli NJ, Hsieh TC, Sander EL, Ma KH, et al. (2014) Rarefaction and extrapolation with Hill numbers: A framework for sampling and estimation in species diversity studies. Ecol Monogr 84: 45-67.
- Genetic Improvement of Nile Tilapia (Oreochromis niloticus): Advances in Selective Breeding and Genomic Approaches for Sustainable Aquaculture
- Microplastics, Contaminants, and Waste Hotspots: Divergences and Faults in Prioritizing Control Efforts
- Creating a Healthier, More Vibrant Open and Closed Aquatic Environment. A Submersible, Centrifugal Magnetically Affixed Current Changing Aquarium Pump
- Assessment of the Efficiency of Common Fishing Gears and Crafts Used at Mohananda River of Chapai Nawabganj, Bangladesh
- Fish Productivity and Biodiversity Status of Sundarban Mangrove in Bangladesh
- Assessment of Population Growth and Fishing Vulnerability of Helicolenus dactylopterus along the Syrian Coast (Eastern Mediterranean Sea)