Length-Weight Relationship for 15 Commercially Important Fish Species of Portonovo Coast, Tamil Nadu, South East of India
Synoptic length-weight observation on fifteen finfish species Sardinella longiceps, Leiognathus splendens, Rastrelliger kanagurta, Carangoids malabaricus, Liza parsia, Thryssa mystax, Epinephelus tauvina, Trachinocephalus myops, Nemipterus randalli, Cheilopogon cyanopterus, Decapterus russelli, Lutzanaus erythropterus, Mugil cephalus, Thryssa purava, Sillago sihama, Arius dussumieri and Terapon jarbua collected along Portonovo coast, Tamilnadu was analysed. The slope b in the length-weight relationships ranged from 2.216 to 3.11, with mean value of 11.96 to 28.94 and R2 ranged from 0.5660 to 0.941.
Introduction
Fish play an important role in the economic development of a nation as it is directly linked to socio- economic status of local fisher folk. Apart from being a cheap source of protein, it also contains other essential nutrients required for human health. The biometric data obtained from the present study is required for proper exploitation and management of fish population and for estimating growth rate, feeding stages, age structures and other essential components of fish population dynamics [1, 2]. Thus length-weight relationship can also be used in setting yield equations for comparing the population in space and time and in understanding the ontogenetic development onset of maturity and spawning and general well being of the populations of different localities [3, 4, 5, 6]. The length-weight relationship can also be used in setting yield equations for estimating and comparing the population in space and time [3]; allow inter alia and estimation of average weight of the fish in a given length group [7]; conversion of length-growth equations to weight-growth equivalents (i.e., length-at-age to weight- at-age) in yield-per-recruit and related models; interspecific and inter populational morphometric comparison of fish species. The knowledge of length-weight relationship has a vital role in developing aquaculture techniques for commercial scale productions of such economically and commercially important fish species [8]. In east coast of Indian waters, these differences occurs more frequently in fish due to seasonal variation, multiple spawning and food availability and composition [9]. However very few researchers have carried out biometric relationship studies though there is an abundant fish population available that are commercially important. In fisheries, the conditional factor is used for compare the “condition”, “fatness” or wellbeing of fish. It is useful as an index for the monitoring of feeding intensity, age and growth rates in fish [10]. The fifteen species investigated in the present study are contributing a major portion in commercial fisheries of this region. Moreover information on length weight of most of these fishes is not available for the scientific and fishery management of the region. Considering all these factors the present study was carried out during 2009 – 2010.
Materials and Methods
Samples were collected from the Portonovo (11˚29’ N; 79˚ 46’ E) south east coast of India. Monthly surveys were carried using bottom trawling fishing vessels, covering an area of 60 Km2 between 25 to 60 m depth. Data on length and weight of the fishes caught in the net were collected from August 2015 to October 2016. During this period a total of 10 such trawling operations were made. The trawl net was 300m long with a mesh size of 110mm, 75mm and 28mm. Most of the catch was made during late night hours and only one 5hours haul was made in each survey. After hauling, fishes were sorted group wise and preserved in ice, so as to keep them in fresh conditions.
Length statistics obtained for each species are given in Table 1, along with the estimated parameters of the length-weight relationships of 15commercially important fish species belonging to 14 different families. The Table.1 shows the sample size, the minimum, maximum and mean length (±S.E.), the minimum and maximum weight for each fish species, the LWR (Length Weight Relationship) parameters a and b, the standard error of the slope and the coefficient of determination for each relationship. Information on the growth type (isometric, +Allometric and - Allometric) of each species is also provided.
Specimens were identified and the total length (from tip of the snout up to the end of caudal fin) was measured (in cm) and the weight was measured with a precision balance to the nearest 0.1g whenever possible. Nomenclature of the fish taxa was confirmed using FAO sheets of Western Indian Ocean region. The observations on length and weight from all these fishes were subjected to statistical analysis. The mathematical relationship between total length and weight was calculated using the b and using the logarithmic transformation log W= log a + b log L, via least square linear regression [11, 12]. The condition factor (K) must typically used by fishery researchers is computed by following formula, K = 100 W/L3 [13] where K= Conditional factor W = is the weight of the fish in gram, L = is the total length of the fish measured in centimeters and the parameters ‘a’ and ‘b’ were calculated by least-squares regression, as was the coefficient of determination (R2). The relationship between the length (L) and weight (W) of a fish is usually expressed by the equation W = aLb, values of the exponent b provide information on fish growth. When b = 3, increase in weight is isometric. When the value of b is other than 3, weight increase is allometric (positive if b > 3, negative if b <3) [14]. Result conventional formula W= aL
| C | Weight | s | ||||||||||||||||||||||||||||||||||||
|---|---|---|---|---|---|---|---|---|---|---|---|---|---|---|---|---|---|---|---|---|---|---|---|---|---|---|---|---|---|---|---|---|---|---|---|---|---|---|
| Length | ||||||||||||||||||||||||||||||||||||||
| haracteristic | Parameter of the relationship | |||||||||||||||||||||||||||||||||||||
| S | ampl | e | Characteristics(cm) | |||||||||||||||||||||||||||||||||||
| Species | (gm) | |||||||||||||||||||||||||||||||||||||
| size n | ||||||||||||||||||||||||||||||||||||||
| t-test Conditional | ||||||||||||||||||||||||||||||||||||||
| m | ea | n | S.E | Min | Ma | x | Min | Max | a | b | S.E | R2 | ||||||||||||||||||||||||||
| factor K SD | ||||||||||||||||||||||||||||||||||||||
| 1.Sardinella longiceps | 247 | 17.5 | 0.06 | 12 | 19.4 | 15 | 59 | 0.0288 | 2.507 | 0.0542 | 0.58 | -Allometric 0.710 0.0963 | ||||||||||||||||||||||||||
| 2.Leiognathus splendens | 186 | 11.96 | 0.097 | 9.2 | 14.2 | 10 | 55 | 0.041 | 2.529 | 0.102 | 0.619 | - Allometric 1.600 0.373 |
| 3.Rastralliger kanagurta | 191 | 22 | 0.1619 | 15 | 29.8 | 30 | 275 | 0.0863 | 2.363 | 0.0281 | 0.591 | - Allometric 1.200 0.220 |
|---|---|---|---|---|---|---|---|---|---|---|---|---|
| 4.Carangoides malabaricus | 114 | 14.83 | 0.3553 | 11.1 | 25.7 | 15 | 180 | 0.0119 | 2.947 | 0.0706 | 0.941 | - Allometric 1.049 0.174 |
| 5.Mugil cephalus | 179 | 19.5 | 0.274 | 12 | 27 | 15 | 1400 | 0.0125 | 2.96 | 0.1466 | 0.7414 | - Allometric 1.163 0.748 |
| 6.Cheilopogon cyanopterus | 131 | 20.14 | 0.1082 | 18 | 24 | 47 | 118 | 0.0812 | 2.216 | 0.0509 | 0.566 | - Allometric 0.779 0.107 |
| 7. Epinephelus tauvina | 104 | 25.07 | 0.368 | 14.5 | 30.5 | 25 | 398 | 0.0128 8 | 3.022 | 0.1044 | 0.818 | Isometric 1.424 0.382 |
| 8.Trachinocephalu s myops | 100 | 18.32 | 0.367 | 13.9 | 26.5 | 20 | 210 | 0.0067 | 3.11 | 0.083 | 0.904 | +Allometric 0.966 0.231 |
| 9.Thryssa mystax | 105 | 16.77 | 0.196 | 11 | 19.6 | 14 | 61 | 0.038 | 2.459 | 0.0545 | 0.869 | - Allometric 0.854 0.134 |
| 10.Nemipterus randalli | 141 | 18.12 | 0.2135 | 13 | 25.9 | 31 | 210 | 0.0309 | 2.677 | 0.0751 | 0.819 | - Allometric 1.238 0.265 |
| 11.Decapterus russelli | 105 | 14.14 | 0.1203 | 11.2 | 17.4 | 15 | 54 | 0.0105 | 2.962 | 0.0815 | 0.648 | - Allometric 0.969 0.185 |
| 12.Lutzanaus erythropterus | 109 | 17.14 | 0.368 | 10.5 | 27.5 | 20 | 250 | 0.0301 | 2.715 | 0.1049 | 0.85 | - Allometric 1.497 0.385 |
| 13.Sillago sihama | 103 | 18.26 | 0.226 | 13.4 | 27 | 23 | 125 | 0.0677 | 2.262 | 0.105 | 0.549 | - Allometric 0.829 0.293 |
| 14.Arius sp. | 114 | 28.94 | 0.55 | 18.1 | 42 | 54 | 824 | 0.024 | 2.8 | 0.1361 | 0.782 | - Allometric 1.307 0.519 |
| 15.Terapon | 145 | 13.7 | 0.108 | 11 | 17.7 | 15 | 87 | 0.021 | 2.845 | 0.0745 | 0.639 | - Allometric 1.490 0.314 |
Table 2: Descriptive statistics and estimated parameters of the length-weight relationships for 15 fish species from the Table 1:
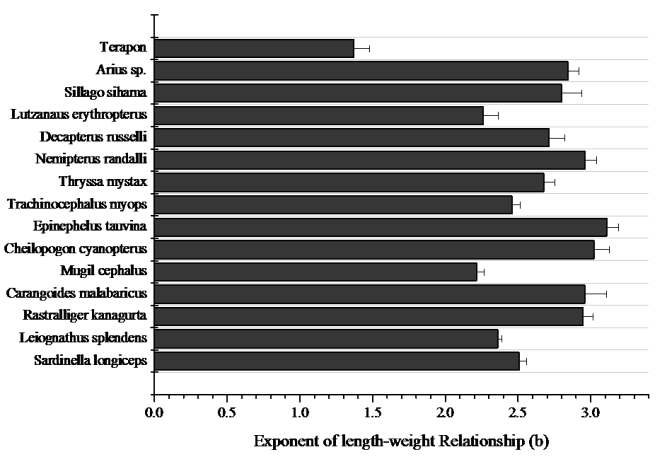
Table 1: Descriptive statistics and estimated parameters of the length-weight relationships for 15 fish species from the Table 1: Descriptive statistics and estimated parameters of the length-weight relationships for 15 fish species from the Tamilnadu coast. min, minimum; max, maximum.; S.E, standard error; n, No. of sample; a, the intercept of the relationship; b, the slope of the relationship; r, coefficient of correlation. The total 15 fish species examined R2 values were ranged from 0.549 to 0.941. All regressions were highly significant (P<0.001). Trachinocephalus myops and Carangoides malabaricus R2 values greater than 0.9, while four of them presented R2 less than 0.6, Sardinella longiceps, Leiognathus splendens, Sillago sihama and Cheilopogon cyanopterus, “a” value ranged from 0.0105 for Decapterus russelli to 0.0812 for Cheilopogon cyanopterus, “b” values ranged from 2.216 for Cheilopogon cyanopterus to 3.11 for Trachinocephalus myops (Figure 1) Among all the tested species only one species Epinephelus tauvina b value 3.022 showed Isometric length weight relationship, b value 3.11 shows positive allometric length weight relationship, and while all the other species Sardinella longiceps, Leiognathus splendens, Rastrelliger kanagurta, Carangoides malabaricus, Thryssa mystax, Nemipterus randalli, Decapterus russelli, Lutjanaus erythropterus, Mugil cephalus, Sillago sihama, Cheilopogon cyanopterus, Arius dussumieri and Terapon puta showed negative allometric length weight relationship.
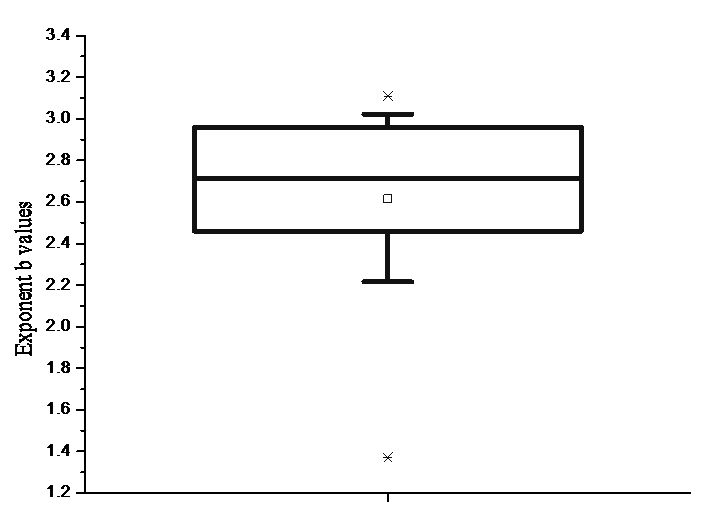
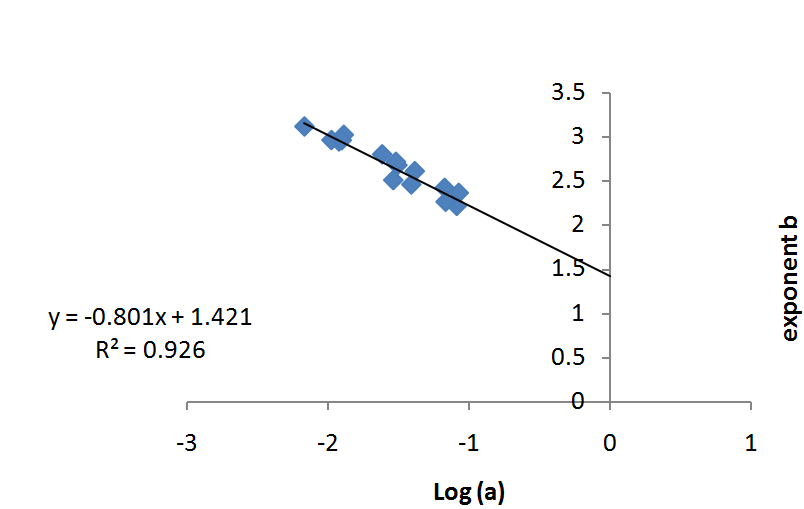
Figure 1: Box–Whiskers plot of the exponent b of the LWR for the 15 fish species. The Conditional factor for all species were significantly different and it’s ranged between 0.710 ±0.0963 was recorded in Sardinella longiceps to 1.60 ± 0.373 was observed in Leiognathus splendens. Box-whiskers plots of the exponent b of the Length- Weight Relationship indicated percentiles of 80.0% of the b values comes under (2.36-3.02) (Fig. 1). The exponent WLR (b) presented an inverse relationship with the logarithm of the intercept (log a). This negative correlation curve is represented by the following equation: y = –0.8012x + 1.4211 (r2 = 0.926) (Figure 2, 3). The tendency is that the higher b occurs with lower a value.
Discussion
Samples were collected over an extended period of time so as to avoid the seasonal variation in data representation. For comparison purposes data should be considered only as mean annual values, as suggested by [15]. L-W relationships are not constant over the whole year, varying according to factors such as food availability, feeding rate, gonad development and spawning period [16]. Even though the change of b values depends primarily on the shape and fatness of the species various factors may be responsible, for the differences in parameters of the length/weight relationships among seasons and years, such as temperature, salinity, food (quantity, quality and size), sex, time of year and stage of maturity [11, 17]. The growth measures of an allometric model was practical; linear regression using log-log transformed data facilitated statistical comparisons of gender and seasonal relationships, and allowed a single method to be applied to all species within the study, regardless of sample size in previous study [18]. In the present finding, the kind of growth was determined by the t-test. 12 species showed negative allometric and three species showed positive allometric growth (Fig. 1). Though the study was carried out over a period of 1 year change in length weight relationship was not considered. This study updates length-weight parameters for available species characteristically encountered during surveys. Analysis of these data provided insights into areas, such as length range or sample size for some commercially important species, in which additional sampling can be targeted in future surveys so as to come to as concrete understanding of the survey. Presence of more negative allometric growth rate in several fish species is a warning to the fishing area that the growth rate of these commercially important species are less. This could be due to over exploitation of fishery resources especially fishing of immature or under grown fishes.
References
-
Anene A (2005) Condition factors of four cichlid species of a man-made lake in Imo state, Southeast, Nigeria. Turkish Journal Fish Aquat Sci 5(1): 43-47.
-
Kolher N, Casey J, Turner P (1995) Length - weight relationships for 13 species of sharks from the western North Atlantic. Fish Bull 93(2): 412-418.
-
Beverton RJH, SJ Holt (1957) On the dynamics of exploited fish populations. Fish Investment Series II, London. Ministry of Agriculture Fisheries and Food G.B. 92. Sea Fisheries 19: 533.
-
Le Cren ED (1951) The Length-Weight Relationship and Seasonal Cycle in Gonad Weight and Condition in the Perch (Perca fluviatitlies). Journal of Animal ecology 20(2): 201-219.
-
Pauly D (1993) Editorial Fish byte. Naga, ICLARM Quarterly.16-26.
-
Petrakis G**,** Stergion KI (1995) Weight-length relationships of 33 fish species in Greek waters. Fisheries Research 21: 465-469.
-
Beyer JW (1987) On length-weight relationships. Part I: Computing the mean weight of the fish of a given length class. Fish Byte 5: 11-13.
-
Rajkumar M, Antony PJ, Trilles JP (2006) Length- weight Relationship of Asian Seabass (Lates calcarifer Bloch, 1970) from Pichavaram Mangrove Waters, South East Coast of India. Asian Fisheries Science 19: 177-183.
-
Das NG, Majumder A, Sarwar SMM (1997) Length- weight relationship and condition factor of catfish, Arius tenuispinis Day, 1877. Indian Journal of Fisheries 44(1): 81-85.
-
Oni SK, Olayemi JY, Adegboye JD (1983) Comparative physiology of three ecologically distinct freshwater fishes, Alestes nurse Ruppell, Synodontis schall Broch & Schneider and Tilapia zillii Gervais. Journal of Fish Biology 22(1): 105-109.
-
Pauly D(1984) Fish population dynamics in tropical waters: a manual for use with programmable calculators. ICLARM Studies and Reviews 8: 325p
-
Zar JH (1984) Biostatistical Analysis. Prentice Hall, New Jersey, pp: 718.
-
Pauly D (1983) Some simple methods for the 1983 assessment of tropical fish stocks. FAO Fisheries Tech. Pap, 234: 52.
-
Morey G, Moranta J, Massuti E, Grau A, Linde M, et al. (2003) Weight- Length relationships of littoral to lower slope fishes from the Wertern Mediterranean. Fisheries Research 62: 89-96.
-
Gonçalves JMS, Bentes L, Lino PG, Ribeiro J, Canario AVM, et al. (1997) Weight length relationships for selected fish species of the small-scale demersal fisheries of the south and south-west coast of Portugal. Fisheries Research. 30(3): 253-256.
-
Bagenal TB, Tesch FW (1978) Age and growth. In: Bagenal T (Editor). Methods for Assessment of Fish Production in Fresh Waters. IBP Handbook No. 3, 3rd (edn). Blackwell Science Publications, pp. 101-136.
-
Sparre P (1992) Introduction to Tropical Fish Stock Assessment. Part I- Manual. FAO Fisheries Technical Paper 306/1. Rev 1.1992 Rome.
-
Mourad C, Rafik Z, Gharbi H, Missaout H, Jarboui O (2008) Length-weight relationships for 11 fish species from the Gulf of Tunis (SW Mediterranean Sea, Tunisia). Pan-American Journal of Aquatic Science 3(1): 1-5
-
Agboola JI, Anetekhai MA (2008) Length-weight relationships of some fresh and brackish water fishes in Bad agry Creek, Nigeria. Journal of Applied Ichthyology 24(5): 623-625.
-
Fafioye OO, Oluajo OA (2005) Length-weight relationships of five fish species in Epe Lagoon, Nigeria. African Journal of. Biotechnology 4(7): 749- 751.
-
Gokhan G, Mustafa C, Halit F (2010) Length- Weight relationship of marine fishes off Yumartalik coast (Iskenderon Bay). Turkish Journal of Zoology 34: 101- 104.
-
Mayrat A (1970) Allometric et taxinomie. Rev Stat Appl 18: 47-58.
- Genetic Improvement of Nile Tilapia (Oreochromis niloticus): Advances in Selective Breeding and Genomic Approaches for Sustainable Aquaculture
- Microplastics, Contaminants, and Waste Hotspots: Divergences and Faults in Prioritizing Control Efforts
- Creating a Healthier, More Vibrant Open and Closed Aquatic Environment. A Submersible, Centrifugal Magnetically Affixed Current Changing Aquarium Pump
- An Attempt to Assess Alpha Diversity and Sample Size: Using the Ostracod Assemblages off Kumamoto Port, Japan
- Assessment of the Efficiency of Common Fishing Gears and Crafts Used at Mohananda River of Chapai Nawabganj, Bangladesh
- Fish Productivity and Biodiversity Status of Sundarban Mangrove in Bangladesh