Herbal Plants as a Promising Future in Raising Growth and Immunity Compared with Antibiotic in Sea Bream Sparus Auratus
This study was assigned to evaluate the comparative effects of XTRACT® extracts and antibiotic supplementation on growth performance and immune status in sea bream (Sparus auratus). A total of four hundred sea bream with an average body weight of 40.0 ± 2.0 g were assigned at random to 8 treatments with 2 replicates (25 per replicate) in a randomized complete block design. Dietary treatments consisted of basal diet with no additives (group1as control) or basal diet supplemented with 100 mg /kg diet Flumequine (group 2), 200 mg/kg diet of XTRACT® extract (group 3) , 200 mg/kg diet of XTRACT® extract plus 100 mg/kg diet Flumequine (group 4), 400 mg/ kg diet of XTRACT® extract (group 5), 400 mg/kg diet XTRACT® extract plus 100 mg/kg diet Flumequine to (group 6), 200 mg/kg diet of XTRACT® extract and 400 mg/kg diet of XTRACT® extract (group 7) and 200 mg/kg diet of XTRACT® extract, 400 mg/kg diet of XTRACT® extract and 100 mg/kg diet of Flumequine (group 8). The results revealed that groups treated with XTRACT® extracts by both dose were significantly higher in weight gain % than groups treated with these extracts with Flumequine. the nonspecific immune parameters revealed that the total leukocytic count of groups treated with XTRACT® extracts were significantly higher than groups treated with these extracts with Flumequine, and these later groups were also higher than group treated with Flumequine alone. In conclusion, this study showed that the addition of XTRACT® extracts or both to the sea bream diets could be suggested as effective alternative for Flumequine as a growth promoters, also they can be used as immunostimulants for sea bream with respect that XTRACT® extract is the most potent one of them.
Introduction
Antibiotics have been used to prevent diseases and to improve feed efficacy for long time, but there are many problems associated with the use of antibiotics in aquaculture, such as the residues of antibiotics left in the tissue of treated fish, the generation of antibiotic-resistant bacteria and the imbalance of the normal beneficial intestinal flora [1]. The restriction on the use of in-feed antibiotics in many countries has fueled the interest in alternative products [2]. Common feed additives used in animal diets include immunostimulators, antimicrobials, antioxidants and herbal plants. In recent years, herbal plants serve as a new class of growth promoters that provide an alternative feeding strategy to replace antibiotic growth promoters Hashemi SR, et al. [3], Rijkers GT, et al. [4] investigated the effect of feeding with oxytetracycline containing pellets on the immune system of carp and found that the cellular immunity was not affected while the humoral immune response was depressed. Rijkers GT, et al. [5] reported the immunosuppressive effect of oxytetracycline in carp. It was shown that both cellular and humoral immunity were depressed after feeding or injecting the antibiotic. Grondel JL, et al. [6] reported that oxytetracycline and other similar compounds may interfere with normal immunological processes in fish, birds and mammals. Yonar ME, et al. [7] concluded that oxytetracycline had a suppressive effect on specific and non-specific immune system parameters of rainbow trout (Oncorhynchus mykiss), such as leucocyte counts, nitroblue tetrazolium activity, total plasma protein and immunoglobulin levels, and phagocytic activity. There is traditional herbal medicine that used as herbal immune stimulants such as Ginseng. Tan BK, et al. [8] stated that the active ingredients of Ginseng are ginsenosides, mono and polysaccharides. Song JY, et al. [9] showed that ginsan polysaccharide isolated from the root of panax Ginseng has been shown to be a potent immunomodulator, producing several cytokines (TNF-α, IL1β, IL2, IL6, INFγ, and GMCSF) and stimulate lymphoid cells to proliferate. Tan BK, et al. [8] revealed that the steroidal saponins (ginsenosides) enhance both B and T-cell mediated immune responses. Yun YS, et al. [10] examined the immunomodulatory activity of the ethanol-insoluble fraction of an aqueous extract of panax Ginseng and found that it induced proliferation of splenocytes and generated activated killer cells in vitro. Wilasrusmee C, et al. [11] investigated the immunomodulatory effect of Ginseng and found that it enhanced lymphocyte proliferation only in the mitogen stimulation assay. Nakagawa H, et al. [12] investigated the immune response induced by dietary supplementation of 2% panax Ginseng on Nile tilapia for 84 days. These investigation were done at 2, 4, 6, 8, 10 and 12 weeks of supplementation of diet and found that the average body weight, complement activity, bactericidal activity against Escherichia coli, lysozyme activity and adherent phagocyte activity were high in fish. Bauer R [13] stated that Echinacea seems to activate the macrophages and other immunological function in lab animals and humans and there is considerable evidence for the role played by the polysaccharides fraction in the immunostimulating effect of Echinacea preparations, as it is able to activate macrophages and other components of the immune system in mice, rats and humans. Jurkstiene V, et al. [14] investigated the mechanism of action of purple cornflower (Echinacea purpurea (L) preparation on the immune system by injection of (1 ml/kg) of extracts from over ground parts and roots of purple cornflower into rabbits. They observed that there is significant increase in the number of leukocytes and lymphocytes especially T- lymphocytes with significant increase in phagocytosis. Zhai Z, et al. [15] stated that Echinacea preparations are commonly used as non- specific immunomodulatory agents and also stated that Echinacea is a wide-spectrum immunomodulator that modulates both innate and adaptive immune responses. Mesalhy SA, et al. [16] studied the effect of Echinacea (Echinacea purpurea) on Nile tilapia and found that fish were fed Echinacea showed an increase in body weight gain, specific growth rate, hematocrite values, lysozyme activities and total leukocytic counts, especially in terms of lymphocytes and eosinophils when compared with control groups. It was found also that the survival rate was significantly increased in Echinacea treated group with and without challenge by I/ P inoculation of fish with 0.5 ml suspension culture of the pathogen Pseudomonas fluorescens (1X10⁸ bacteria ml-1), while no significant changes in the monocytes numbers and the nitroblue tetrazolium test occurred. This study was aimed to evaluate the effects of XTRACT® extracts or both in comparison with Flumequine on growth performance and immune parameters of sea bream.
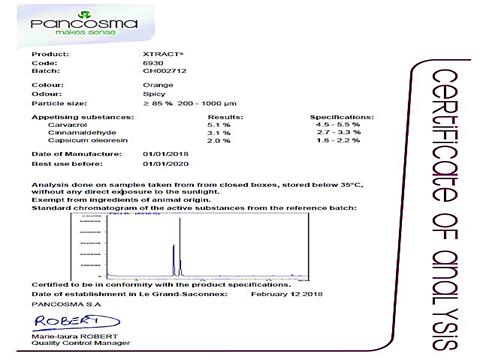
Flumesol-200 WS Flumequine 20% water-soluble powder Contains per gram powder: Flumequine 200 mg. Excipients ad 1 g. Description Flumequine belongs to the group of quinolones and acts bactericidal against mainly Gram-negative bacteria. The antibiotic was added by the rate of 100 mg/Kg feed. XTRACT® was obtained from PANCOSMA Additive Company. Egypt and dissolved in water then added to the feed by the rate of 200 and 400 mg/ kg feed. Composition of XTRACT® they have 3 main families of raw materials: No essential oils namely; Capsicum Oleoresin; Chilli pepper; Turmeric Oleoresin; Turmeric Roots; Eugenol: Essential oil; Rectified by fractionation; Carvacrol; Naturally occuring in Oregano, thyme and other; Mediterranean herbs; Garlic tincture; Cinname aldehyde In Cinnamon.
Material and Methods Experimental Fish
Fish
A total number of four hundred apparently healthy of cultured sea bream Sparus auratus L with an average body weight of 40.0 ± 2. g were obtained from private fish farms at Borg-El Arab, Alexandria Governorate and acclimated in full prepared cage cultured (5×10×2 m) and maintained in aerated marine water at 28 ± 2°C for 14 days. They seemed healthy and had a uniform size. The experimental period lasted 2 months. Fish were transported a live to the private laboratory for carrying the different immune parameters.
Cage Cultured System
Fish were kept in prepared cages (5×10×2 m). These cages were used for holding the experimental fish throughout the period of the present study, (duplicate each treatment). All fish were placed in cages and acclimatized for 2 weeks prior to the experiments.
Supplements
Bacterial Strains
Bacterial strain Aeromonas hydrophila was kindly supplied by department of poultry and fish diseases Fac. of Vet. Alex. Univ. This is used for the Serum bactericidal activity study. Bacterial strain lyophilized Micrococcus lysodekticus which is used for serum lysozomal activity (Sigma M 3770). Vibrio algenolyticus was kindly supplied by department of poultry and fish diseases Fac. of Vet. Alex. Univ. This is used for the challenge study.
Fish Diets and Feeding
Fish were fed on a commercial fish diet containing 45% crude protein obtained from private factory in Egypt (Alar aqua Egypt®). The diets were daily provided at a fixed feeding ratio of 3 % of body weight of fish as described by Eurell, et al. 1978 and were made into fine granules mechanically. The fine granules were then, made into powder by using a mixer. The sea bream were fed a complete diet that was specially formulated to meet their requirements, which comprised 45 % crude protein; the diet was unchanged throughout the experimental period. The diets of the experimental groups were supplemented with both Flumequine by the dose of 100 mg/kg in ration and XTRACT® extract added to the ration by 200 mg and 400 mg/kg feed. The quantity of feed related to fish weight was adjusted weekly by weighing early morning before feeding. The daily amount of food was offered as two equal meals /day on five occasions over the day (At 8, 10 AM and 12, 2 and 4 PM). Moreover, the fish mortality was recorded daily and so, the quantity of food was decided. The experiment was extended to 6 weeks where fish samples were taken at the beginning and at the end of the experiment from all cages for analyses. Water temperature was kept at 25 ± 1°C and 35‰ salinity.
Experimental Fish Design
As shown in Table 1, these experiments were carried out in private farm at Borg El-Arab, Alexandria governorate, Egypt, and extended for 3 months in the summer season (June-September).
| Group Diet | (1) | (2) | (3) | (4) | (5) | (6) | (7) | (8) |
| Fish number | 50 | 50 | 50 | 50 | 50 | 50 | 50 | 50 |
| Basal diet (45% protein) | + ve | + ve | + ve | + ve | + ve | + ve | + ve | + ve |
| Flumequine 20% (100 mg/kg diet) | - ve | + ve | - ve | + ve | - ve | +ve | - ve | + ve |
| XTRACT® extract (200 mg/kg diet) | - ve | - ve | + ve | + ve | - ve | - ve | + ve | + ve |
| XTRACT® extract (400mg/kg diet) | - ve | - ve | - ve | - ve | + ve | + ve | + ve | + ve |
Table 1: Experimental Fish Design.
Diets and Feeding
A balanced dietary ration formulation was prepared to meet the requirements of sea bream according to NRC [17]. The amount of feed (on dry matter basis) delivered per day was adjusted at the beginning and after one month of the experiment as 3% of body weight Eliott JM [18].
Measurement of Survival and Growth Performance Parameters
Average body weight of fish for each group was weighed after one and two month of the feeding experiment according to Windell JT, et al. [19], Siddiqui AQ, et al. [20] as: a) Average body weight = the total weight of fish / the number of fish in each group. b) Weight gain % was calculated according to Jauncey K, et al. [21] as: Weight gain % = Final average body weight – Initial average body weight/ Initial average body weight x100. c) Specific growth rate (SGR) was determined according to Sveier H, et al. [22] as: d) Specific growth rate (SGR) = 100 (ln W2 – ln W1) / T e) Where W1 and W2 are the initial and final fish weight, respectively, and T was the number of days in the feeding period.
Evaluation of Feed Utilization
Feed intake was calculated as the total weight diet offered in a given period divided by the number of survival fish. Feed conversion ratio (FCR) was calculated according to Sveier H, et al. [22] as: FCR = (dry feed intake by gm) / (live weight gain by gm). Condition factor (CF) was calculated according to Gjedrem T, et al. [23] as: CF = (body weight by gm) / (total length cm) 3 x 100
Survival rate was calculated according to the following formula: Survival % = (No. of fish counted) / (No. of stocked fish) x100.
Blood and Serum Samples
Blood and serum samples were taken after one and two months of the feeding experiment, 3 fish of each replicate were randomly taken.
Evaluation of Immunological Parameters
Nonspecific Immune Parameters
Total leukocytic count was performed using the improved Neubaur chamber, Natt and Herrick's solution as diluting fluid and 1:100 diluted bloods according to the method described by Stoskopf MK [24] 1993. Nitroblue tetrazolium activity (NBT) was performed according to Studnicka M, et al. [25]. Lysozyme activity, true lysozymes have the ability to lyse Micrococcus lysodeikticus cells [26]. The Lysozyme concentrations in the samples were determined from a plotted standard curve against the corresponding clear zone ring diameter on the linear axis [27]. a) Serum Bactericidal Activity (SBA) It examines the ability of the fish's serum that fed some plant extracts and oxytetracycline with its diet to kill the pathogenic organisms. The turbidity of bacterial suspension of A.hydrophila was adjusted by comparing with 0.5 McFarland turbidity standards (1.5x10⁸). The number of viable bacteria was calculated by counting the colonies of resultant incubated mixture [28]. The bactericidal activity of the tested serum was expressed as the percentage of colony forming units in test the group to that in the control group [29]. Determination of total globulin was estimated by the method of Murray DL, et al. [30]. Specific Immune Parameters The quantitative determination of IgM was made by using nephelometry technique, according to Barta O [31]. Lymphocyte transformation test Boyum A, [32] was carried out according to the following steps:
a) Separation of Lymphocytes [33] b) Viability of Lymphocytes: by using 0.4% trypan blue stain according to the technique described by Hanks JH, et al. [34], Chi DS, et al. [35]. The number of lymphocytes per ml was calculated according to the following equation, No. of lymphocytes /ml = No. of counted lymphocytes / No. of triple ruled squares x 25 x 104 x dilution factor; where the dilution factor is 2. c) Standardization of the Lymphocytes Concentration:
The required final concentration could be adjusted to reach 2 x 10⁶ lymphocytic cell / ml by adding RPMI- 1640 medium with 10% foetal bovine serum (RPMI- 10) [36]. d) Evaluation of the Lymphocyte Transformation Test The extent of lymphocyte transformation rate was calculated according to Ruangroupan L, et al. [37].
Transcript Expression Analysis of Gen Expressions of Glutathion-s- Transferase in Liver of Sea Bream Sparus Auratus After 8th Weeks After Treatment with Flumequine and XTRACT® Extract
At the end of the experiment (8th week) liver samples were collected from different treatments for Real-time reverse transcription polymerase chain reaction (RT-PCR) analysis of mRNA expression of antioxidant related gene (glutathion-s- transferase) was performed Table 2. The total mRNA was extracted from tissue samples from the control and treated groups (n = 3 per group) using an mRNA extraction kit according to the manufacturer’s instructions. The quality of the extracted RNA was confirmed with 2 % agarose electrophoresis following the manufacturer's protocol [38].
a) Quantitative Real Time-PCR The first strand cDNA from different samples was used as templates for RT-PCR with a pair of specific. The sequences of specific primer and product sizes are listed in Table 2. β- actin was used as a housekeeping gene for normalizing mRNA levels of the target genes. The relative expression was calculated by using method Schmittgen TD, et al. [39].
| Gene Name | Forward Primer | Reverse Primer | ||||||
|---|---|---|---|---|---|---|---|---|
| β-actina | CCTCACCCTCAAGTACCCCAT | TTGGCCTTTGGGTTGAGTG | ||||||
| GST | ATGATCTATGGCAACTATGAGACAGG | GAAGTACAAACAGATTGTATCCGC |
Table 2: Primer Sequences used for RT-PCR.
aHousekeeping gene Table 2: Primer Sequences used for RT-PCR.
Challenge Test
The challenge test was done at the end of the feeding experiment where 20 fish each group were transferred to eight glass aquaria , then were inoculated with 0.5 ml culture suspension (2 x 10⁶ bacteria ml-1) of pathogenic V. algenolyticus via intraperitoneal route. The challenged fish were observed for 7 days in order to record the mortalities [37].
Statistical Analysis
Data were statistically analyzed using the Analysis Of Variance (ANOVA) and Duncan multiple range test to determine differences between treatments and standard errors of treatment means. Differences were considered significant when (P <0.05).All statistics were carried out using Statistical Analysis Systems (SAS) program [40].
Results
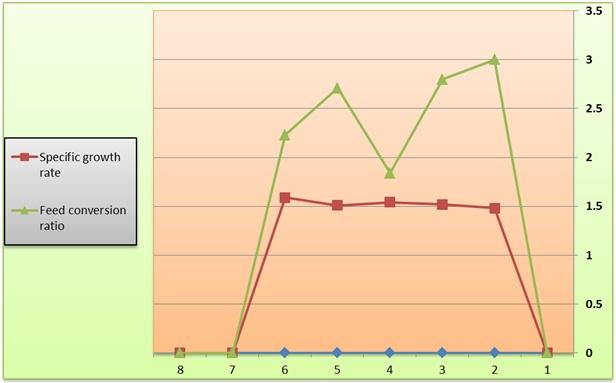
After 8 weeks of the feeding experiment all treated groups showed a significant increase in weight gain % and FCR in comparison with untreated control, while all treated and control untreated groups showed no significant change in SGR (P<0.05). Group treated with Flumequine alone showed a significant increase in feed intake in comparison with control untreated group and other groups, while groups treated with XTRACT® extract with or without Flumequine showed a significant increase in condition factor (CF) as shown in Table 3 & Figure 2. All treated groups showed a significant increase in total leukocytic count except Flumequine treated group that showed a significant decrease in comparison with control untreated group (P<0.05). All treated groups showed a significant increase in NBT, lysozyme in comparison with control untreated group (P<0.05). Serum bactericidal activity (SBA) of groups that treated with two dose of XTRACT® extracts against V. algenolyticus was significantly higher than that of control untreated group (P<0.05), as shown in Table 4.
| Treatments | ||||||||
|---|---|---|---|---|---|---|---|---|
| Parameter | Treatments | |||||||
| G1 | G2 | G3 | G4 | G5 | G6 | G7 | G8 | |
| Initial average b. wt | 43.16 ± 0.14 | 43.56 ± 0.09 | 40.3 ± 0.17 | 40.76 ± 0.14 | 41.08 ± 0.53 | 41.42 ± 0.01 | 40.78 ± 0.43 | 40.96 ± 0.12 |
| Final average b. wt | 54.5 ± 0.29 | 57.9 ± 2.57 | 57.61 ± 0.12 | 56.27 ± 1.14 | 56.65 ± 0.19 | 57.53 ± 0.27 | 57.48 ± 1.01 | 56 95 ± 0.51 |
| Wt. gain % | 26.25 ± 0.23 g | 32.92 ± 0.01 f | 44.44 ± 0.27 a | 37.27 ± 1.19 e | 41.29 ± 0.06 b | 38.87 ± 0.16 c | 38.14 ± 0.14 d | 39.09 ± 0.18 c |
| Specific growth rate | 0.92 ± 0.06 c | 1.03 ± 0.03 b | 1.17 ± 0.03 a | 1.09 ± 0.01 ab | 1.10 ± 0.02 ab | 1.04 ± 0.02 b | 1.10 ± 0.03 ab | 1.12 ± 0.01 ab |
| Feed intake | 41.65 ± 0.49 bc | 43.73 ± 0.74 a | 42.98 ± 0.28 ab | 36.24 ± 0.11 d | 41.87 ± 0.13 bc | 37.41 ± 0.62 d | 43.73 ± 0.14 a | 40.81 ± 0.64 c |
| Feed conversion ratio | 3.69 ± 0.08a | 3.03 ± 0.05 b | 2.48 ± 0.04 cd | 2.35 ± 0.02 d | 2.66 ± 0.08 c | 2.60 ± 0.02 c | 2.58 ± 0.13cd | 2.55 ± 0.02cd |
| Condition factor | 1.63 ± 0.01 c | 1.78 ± 0.02 b | 1.85 ± 0.02 a | 1.68 ± 0.00 c | 1.75 ± 0.02 b | 1.68 ± 0.02 c | 1.85 ± 0.02 a | 1.77 ± 0.05 b |
| Survival % | 96.0 ± 2.31 a | 96.0 ± 2.31 a | 97.33 ± 1.33 a | 94.67 ± 1.33 a | 97.33 ± 1.33 a | 96.0 ± 2.31 a | 98.67 ± 1.33 a | 96.0 ± 2.31 a |
Table 3: Growth performance parameters and survival percentage of sea bream 8 weeks after treatment with Flumequine *Rows with th
Table 3: Growth performance parameters and survival percentage of sea bream 8 weeks after treatment with Flumequine *Rows with the same litter are not significant different (P<0.05). G1=control; G2= FLM; G3 = 200mg/kg XTRACT® extract; G4 = 200 mg/kg XTRACT® extract and FLM; G5=400mg/ kg XTRACT® extract; G6 = 400 mg/kg XTRACT® extract and FLM; G7= 200 mg/ kg XTRACT® extract and 400mg/kg XTRACT® extract ; G8= 200 mg/kg XTRACT® extract,400mg/kg XTRACT® extract and FLM. Table 3: Growth performance parameters and survival percentage of sea bream 8 weeks after treatment with Flumequine and XTRACT® extract.
*Rows with the same litter are not significant different (P<0.05). G1=control; G2= FLM; G3 = 200 mg/ kg XTRACT® extract; G4 = 200 mg/ kg XTRACT® extract and FLM; G5=400 mg/ kg XTRACT® extract; G6 = 400 mg/ kg XTRACT® extract and FLM; G7= 200 mg/ kg XTRACT® extract and 400 mg/kg XTRACT® extract ; G8= 200 mg/ kg XTRACT® extract,400 mg/kg XTRACT® extract and FLM.
After 8 weeks all treated groups showed a significant increase in weight gain %, feed intake, FCR, CF and SGR in comparison with control untreated group (P<0.05) as shown in Table 4. Groups treated with 200 mg/ kg XTRACT® extract or 400 mg/ kg XTRACT® extract showed a significant increase in total leukocytic count, lysozyme activity, SBA, total globulin, lymphocyte stimulation index and NBT in comparison with groups treated with these extracts with Flumequine (P<0.05) as shown in Table 5.
| Treatments | ||||||||||||||||||||||||||
|---|---|---|---|---|---|---|---|---|---|---|---|---|---|---|---|---|---|---|---|---|---|---|---|---|---|---|
| Parameter | ||||||||||||||||||||||||||
| G1 | G2 | G3 | G4 | G5 | G6 | G7 | G8 | |||||||||||||||||||
| Total leukocytic count (103 / μl) | 63.13 ± 2.48 d | 84.22 ± 3.26 e | 84.39 ± 4.51 a | 60.23 ± 2.66 d | 77.71 ± 2.07 b | 68.27 ± 3.33 c | 84.35 ± 6.29 a | 67.48 ± 4.29 c | ||||||||||||||||||
| Nitroblue tetrazolium activity (OD at 620 nm) | 0.044 ± 0.002 d | 0.045 ± 0.003 d | 0.097 ± 0.004 a | 0.050 ± 0.001 cd | 0.074 ± 0.006 b | 0.053 ± 0.003cd | 0.064 ± 0.006 bc | 0.063 ± 0.005 bc | ||||||||||||||||||
| Lysozyme activity (μg/ml) | 106.21 ± 3.88 c | 109.19 ± 4.11 c | 126.52 ± 2.97 a | 116.63 ± 3.18 b | 131.63 ± 2.56 a | 109.29 ± 3.91 c | 128.73 ± 2.56 a | 107.39 ± 3.47 c | ||||||||||||||||||
| Serum bactericidal activity (% of CFU/ control) | 34.33 ± 1.44 de | 57.62 ± 1.32 a | 17.29 ± 0.84 f | 41.55 ± 1.57 b | 28.99 ± 1.63 e | 36.51 ± 1.73 bc | 27.66 ± 1.38 e | 33.74 ± 1.55 cd | ||||||||||||||||||
| Total globulin (gm/dl) | 2.22 ± 0.03 d | 2.51 ± 0.14 c | 4.22 ± 0.04 a | 2.13 ± 0.03 d | 2.59 ± 0.03 c | 2.84 ± 0.23 c | 3.73 ± 0.47 b | 2.14 ± 0.17 d |
Table 4: Non - specific immune parameters of sea bream 8 weeks after treatment with Flumequine and XTRACT® extract.
*Rows with the same litter are not significant different (P<0.05). G1=control; G2= FLM; G3= 200 mg/kg XTRACT® extract; G4 = 200 mg/ kg XTRACT® extract and FLM; G5=400 mg/kg XTRACT® extract; G6 = 400 mg/ kg XTRACT® extract and FLM;G7=200 mg/ kg XTRACT® extract and 400 mg/kg XTRACT® extract;G8= 200 mg/kg XTRACT® extract, 400mg/kg XTRACT® extract and FLM Table 4: Non - specific immune parameters of sea bream 8 weeks after treatment with Flumequine and XTRACT® extract.
| Treatments | ||||||||||||||||||||||||||
|---|---|---|---|---|---|---|---|---|---|---|---|---|---|---|---|---|---|---|---|---|---|---|---|---|---|---|
| Parameter | ||||||||||||||||||||||||||
| G1 | G2 | G3 | G4 | G5 | G6 | G7 | G8 | |||||||||||||||||||
| Lymphocyte stimulation index (4 week) | 1.40 ± 0.03 d | 1.37 ± 0.02 d | 2.93 ± 0.04 a | 1.87 ± 0.03 bc | 2.51 ± 0.07 b | 1.63 ± 0.03 cd | 2.83 ± 0.04 ab | 2.91 ± 0.05 ab | ||||||||||||||||||
| Lymphocyte stimulation index (8 week) | 1.39 ± 0. 02 e | 1.56 ± 0.02 e | 3.52 ± 0.07 a | 2.36 ± 0.04 d | 3.50 ± 0.05 a | 2.72 ± 0.03 c | 3.23 ± 0.04 b | 2.88 ± 0.03 ab | ||||||||||||||||||
| Ig M (gm/L) (After challenge) | 0.186 ± 0.002 e | 0.182 ± 0.003 d | 0.259 ± 0.002 b | 0.242 ± 0.001 c | 0.277 ± 0.002 a | 0.266 ± 0.001 b | 0.255 ± 0.001 bc | 0.197 ± 0.002 d |
Table 5: Specific immune parameters of sea bream 8 weeks after treatment with Flumequine and XTRACT® extract.
*Rows with the same litter are not significant different (P<0.05). G1=control; G2= FLM; G3 = 200 mg/ kg XTRACT® extract; G4 = 200 mg/kg XTRACT® extract and FLM; G5=400 mg/kg XTRACT® extract; G6 = 400 mg/kg XTRACT® extract and FLM; G7= 200 mg/ kg XTRACT® extract and 400 mg/kg XTRACT® extract ; G8= 200 mg/kg XTRACT® extract,400mg/kg XTRACT® extract and FLM.
Results of Gen Expressions of Glutathion-s- Transferase in Liver of Sea Bream Sparus Auratus After 8th Weeks After Treatment with Flumequine and XTRACT® Extract
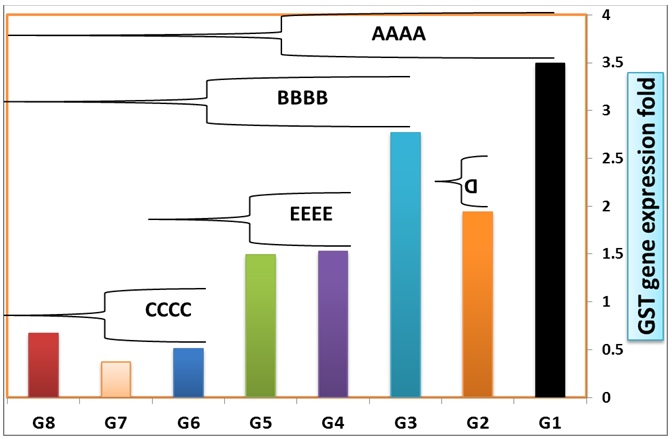
XTRACT® extract were indistinguishable from controls. These data indicate that Flumequine seems to be a poor GSR inducer sea bream, whereas liver seem to respond better at the long term. Changes in GSR mRNA levels were in general mild and restricted to particular subsets of samples. GSR mRNA levels significantly decreased at the end of feeding ration with Flumequine. Bivariate correlation analysis of mRNA abundance levels of different genes in liver tissues defined different clusters of co-regulated genes. Levels of mRNA from oxidative metabolism-related genes (GST) showed a very high correlation in.
Feeding of sea bream to Flumequine and XTRACT® extract for 8th weeks resulted in significant changes in mRNA abundance for a limited subset of the analyzed of hepatic sea bass genes (Figure 3). GSR mRNA levels decrease significantly upon incubation with Flumequine, in liver, irrespectively to the length of the treatment, whereas the corresponding levels of fish treated with
| Treatments | ||||||||
|---|---|---|---|---|---|---|---|---|
| Parameter | G1 | G2 | G3 | G4 | G5 | G6 | G7 | G8 |
| Parameter | ||||||||
| No. of fish | 20 | 20 | 20 | 20 | 20 | 20 | 20 | 20 |
| No. of mortality | 18 | 10 | 12 | 8 | 8 | 2 | 2 | 3 |
| Mortality % | 90 %a | 50 %c | 60 %d | 40 %e | 40 %e | 10 %g | 10 %g | 15 %f |
Table 6: Mortality percentage of sea bream treated with Flumequine and XTRACT® extracts for 8 weeks then challenged with pathogen
*Rows with the same litter are not significant different (P<0.05). G1=control; G2= FLM; G3 = 200 mg/kg XTRACT® extract; G4 = 200 mg/ kg XTRACT® extract and FLM; G5=400 mg/kg XTRACT® extract; G6 = 400 mg/ kg XTRACT® extract and FLM; G7= 200 mg/kg XTRACT® extract and 400 mg/kg XTRACT® extract ; G8= 200 mg/ kg XTRACT® extract, 400 mg/ kg XTRACT® extract and FLM.
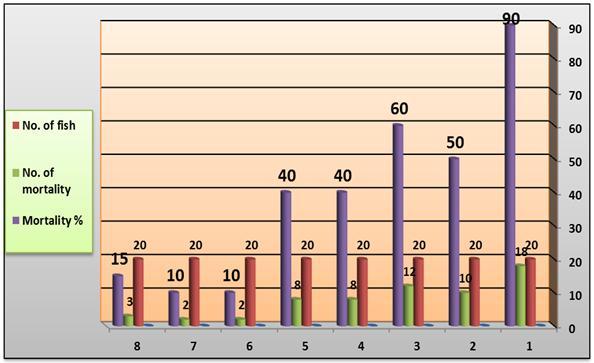
After challenge with pathogenic V. algenolyticus all treated groups showed a significant increase in the amount of IgM in comparison with control untreated group (P<0.05) while groups treated with 200 mg/kg XTRACT® extract or 400 mg/kg XTRACT® extract with Flumequine showed a significant increase in IgM than that treated with Flumequine alone (P<0.05) (Table 4). After challenge with pathogenic V. algenolyticus the mortalities were recorded for 7 days, groups that received Flumequine alone showed no significant change in comparison with control untreated group, while groups received 200 mg/ kg XTRACT® extract or 400 mg/kg XTRACT® extract or both doses with or without Flumequine showed a significant decrease in mortalities than that treated with Flumequine alone or control untreated group (P<0.05) (Table 4).
Discussion
In this study, XTRACT® extracts were used as feed additives to evaluate its role as immunomodulators and alternatives to Flumequine as growth promoters. The weight gain % of group that received XTRACT® extract was significantly higher than other groups; these findings were consistent with Mesalhy SA, et al. [16], Kasiri M, et al. [41] and Goda S [42]. All groups that received XTRACT® extract by both doses or combined with Flumequine were significantly higher in weight gain % than group that received Flumequine alone, these agree with Choi I, et al. [43], Nakagawa H, et al. [12], while disagree with Sanchez-Martínez JG, et al. [44]. The specific growth rate of all treated groups in our work was significantly higher than control untreated group, these results correspond with Choi I, et al. [43] while disagree with Maass N, et al. [45] who examined the effect of feeding oxytetracycline on the growth of catfish for 11 weeks and found that the specific growth rate showed no significant change in the oxytetracycline treated fish. Group received Echinacea extract showed a significantly higher value in comparison with other groups, these work in with Nakagawa H, et al. [12], Kasiri M, et al. [41], Goda S, [42]. The best feed utilization was for groups received XTRACT® extract by both doses with Flumequine followed by groups received XTRACT® extract by both doses then group received Flumequine alone and finally the control group, these findings consistent with Przybilla P, et al. [46], Choi I, et al. [43]. On the other hand conflict with Sanchez-Martínez JG, et al. [44], Maass N, et al. [45]. As regard the condition factor of all groups was significantly higher than control group. These data work in with Maass N, et al. [45] and contradict with Nakagawa H, et al. [12] who recorded no significant change in the condition factor of Nile tilapia fed Echinacea at a rate of 0.25 ppt on a dry weight basis for 6 months. The survivability of all groups showed no significant change in comparison with control group. These results agree with Nakagawa H, et al. [12]. The total leukocytic count of all treated groups were significantly increased in comparison with control untreated group except group received Flumequine alone that showed a significant decrease, these findings correspond with Grondel JL, et al. [6], Yonar ME, et al. [7]. However, it conflict with Liu XL, et al. [47]. Groups received XTRACT® extract by both doses showed a significant increase in NBT than those with Flumequine, these findings agree with Zhai Z, et al. [15] and disagree with Mesalhy, et al. [16] 2008. Groups received XTRACT® extract by both doses showed a significant increase in lysozyme activity in comparison with groups received the extract with Flumequine or group received Flumequine alone. These findings consistent with Mesalhy SA, et al. [16], Nakagawa H, et al. [12], Choi I, et al. [43] and Hayashi I, et al. [48]. The bactericidal ability of serum of group that received XTRACT® extract by both doses was significantly higher than control untreated group. These findings agree with Bany J, et al. [49], Zhai Z, et al. [15]. Groups received XTRACT® extract by both doses showed a significant increase in SBA in comparison with groups received the extract with Flumequine, and these later groups showed a significant increase in SBA in comparison with groups fed Flumequine alone. These findings agree with Nakagawa H, et al. [12], Freier DO, et al. [50]. The total globulin of all groups showed a significant increase in comparison with control untreated group, these findings interfere with Yonar ME, et al. [7], Freier DO, et al. [50]. The results revealed a potential enhancement of humeral immune response, these agree with Tan BK, et al. [8]. Groups that were fed XTRACT® extract by both doses showed a significant increase in total globulin than that was fed Flumequine alone or with the extract. The level of IgM after the challenge with pathogenic V. algenolyticus was significantly increased in all treated groups in comparison with control untreated group; these findings disagree with Yonar ME, et al. [7]. The lymphocyte stimulation index of all treated groups showed a significant increase except group received Flumequine alone that showed no significant change in comparison with control untreated group, these findings agree with Wilasrusmee C, et al. [11].
After challenge with pathogenic V. algenolyticus groups that received XTRACT® extract by both doses with or without Flumequine showed a significant decrease in mortalities than that treated with Flumequine alone or control untreated group that indicates a good disease resistance, these findings was explained by Zhai Z, et al. [15]. Group that received Flumequine alone showed a non-significant change in mortalities in comparison with control untreated group; this may be due to the effect of Flumequine and other similar compounds that may interfere with normal immunological processes in fish as mentioned by Grondel JL, et al. [6].
Conclusion
From obtained results we concluded that, using of XTRACT® extract as feed additives for sea bream diets for 8 weeks can improve growth performance parameters and stimulate its specific and non-specific immune parameters. So addition of XTRACT® extract to the sea bream diets can be served as a natural alternatives for Flumequine as a growth promoters, also they can be used as immunostimulants for sea bream with respect that XTRACT® extract is the most potent one of them [51, 52, 53].
Acknowledgments
The work in the author’s laboratory is supported by grants marine hatchery production in Egypt by Master/Medhat El-Sherif, Egypt. This research did not receive any specific grant from funding agencies in the public, commercial or not-for-profit sectors.
Conflict of Interest
The authors declare no conflict of interest.
References
-
Subasinghe R (1997) Fish Health and Quarantine. In: Review of the state of the world aquaculture. FAO fisheries Department, circular No 886, Food and Agriculture Organization of the United Nations, Rome, Italy.
-
Jacela YJ, DeRouchey MJ, Tokach DM, Goodb DR, Nelssen LJ, et al. (2010) Fact Sheet: Phytogenic feed additives (phytobiotics or botanicals). J Swine Health Prod 18(3): 132-136.
-
Hashemi SR, Davoodi H (2011) Herbal plants and their derivatives as growth and health promoters in animal nutrition. Vet Res Commun 35(3): 169-180.
-
Rijkers GT, Teunissen AG, Van Oosterom R, Van Muiswinkel WB (1980) The immune system of cyprinid fish. The immunosuppressive effect of the antibiotic oxytetracycline in carp (Cyprinus carpio L.). Aquaculture 19(2): 177-189.
-
Rijkers GT, Van Oosterom R, Van Muiswinkel WB (1981) The immune system of cyprinid fish. Oxytetracycline and the regulation of humoral immunity in carp (Cyprinus carpio). Vet Immunol Immunopathol 2(3): 281-290.
-
Grondel JL, Van Muiswinkel WB (1986) Immunological defense mechanisms as a target for antibiotics. Comparative Veterinary Pharmacology, Toxicology and Therapy: 263-282.
-
Yonar ME, Yonar SM, Silici S (2011) Protective effect of propolis against oxidative stress and immunosuppression induced by oxytetracycline in rainbow trout (Oncorhynchus mykiss, w.). Fish shellfish immunol 31(2): 318-325.
-
Tan BK, Vanitha J (2004) Immunomodulatory and antimicrobial effects of some traditional Chinese medicinal herbs: a review. Curr Med Chem 11(11): 1423-1430.
-
Song JY, Han SK, Bae KG, Lim DS, Son SJ, et al. (2003) Radioprotective effects of ginsan, an immunomodulator. Radiat Res 159(6): 768-774.
-
Yun YS, Lee YS, Jo SK, Jung IS (1993) Inhibition of autochthonous tumor by ethanol insoluble fraction from Panax Ginseng as an immunomodulator. Planta Med 59(6): 521-524.
-
Wilasrusmee C, Kittur S, Siddiqui J, Bruch D, Wilasrusmee S, et al. (2002) In vitro immunomodulatory effects of ten commonly used herbs on murine lymphocytes. J Altern Complement Med 8(4): 467-475.
-
Nakagawa H, Sato M, Gatlin DM (2007) Dietary Supplements for the Health and Quality of Cultured Fish. CAB International, UK: 109-116.
-
Bauer R (1999) Chemistry, analysis and immunological investigations of Echinacea phytopharmaceuticals. Immunomodulatory agents from plants 41-88.
-
Jurkstiene V, Kondrotas AJ, Kevelatitis E (2004) Compensatory reactions of immune system and action of purple coneflower (Echinacea purpurea (L.) Moench) Preprations. Medicina (Kaunas) 40(7): 657- 662.
-
Zhai Z, Liu Y, Wu L, Senchina DS, Wurtele ES, et al. (2007) Enhancement of innate and adaptive immune functions by multiple Echinacea species. J Med Food 10(3): 423-434.
-
Mesalhy SA, Mohamed FM, John G (2008) Echinacea as immunostimulatory agent in Nile tilapia (Oreochromis niloticus) via earthen bond experiment. In: Elghobashy, H., Fitzsimmons, K., Diab, A.S. (eds.) Proceedings of 8th International Symposium on Tilapia in Aquaculture, Cairo, Egypt, pp: 1033-1042.
-
NRC (National Research Council) (1993) Nutrient requirements of fish. National Academy Press. Washington, DC: 112.
-
Eliott JM (1975) Number of meals in a day, maximum weight of feed consumed in a day and maximum rate of feeding for brown trout, Salmo trutta L. Freshwater Biology 5(3): 287-303.
-
Windell JT, Foltz JW, Sarokon JA (1978) Methods of fecal collection and nutrient leaching in digestibility studies. The Progressive Fish-culturist 40(2): 51-55.
-
Siddiqui AQ, Howlader MS, Adam AA (1988) Effects of dietary protein levels on growth, feed conversion and protein utilization in fry and young Nile Tilapia, Oreochromis niloticus. Aquaculture 70(2): 63-73.
-
Jauncey K, Ross B (1982) A guide to Tilapia feeds and feeding. Institute of Aquaculture, University of Stirling, Stirling.
-
Sveier H, Raae AJ, Lied E (2000) Growth and protein turnover in Atlantic salmon (Samo salar L.); the effect of dietary protein level and protein particle size. Aquaculture 185: 101-120.
-
Gjedrem T, Gunnes K (1978) Comparison of growth rate in Atlantic salmon, Pink salmon, Arctic char, Sea trout and Rainbow trout under Norwegian farming condition. Aquaculture 13(2): 135-141.
-
Stoskopf MK (1993) Fish Medicine, WB Saunders Company, Philadelphia, pp: 113-131&149-159.
-
Studnicka M, Siwicki AK, Ryka B, Phayka B (1985) Phagocytic ability of neutrophils in carp. Bamidgeh 37: 123-128.
-
Iwama G, Nakanishi T (1987) The Fish Immune System, organism, Pathogen and Environment. Academic Press, San Diego, pp: 742-746.
-
Rao YV, Das BK, Jyotymayee P, Chakraborli R (2006) Effect of Achyranthes Aspera on the immunity and survival of Labeo rohita infected with aeromonas hydrophila. Fish Shellfish Immunol 20(3): 263-273.
-
Maqsood S, Singh P, Hassan MS, Khansaheb AB (2010) Effect of dietary chitosan on non-specific immune response and growth of Cyprinus carpio challenged with Aeromonas hydrophila. International Aquatic Research 2(2): 77-85.
-
Lim C, Yildirim-Aksoy M, Klesius PH (2009) Growth response and resistance to Edwardsiella ictaluri of channel catfish, Ictalurus punctatus fed diets containing distiller's dried grains with solubles. J World Aquacult Sci 40(2): 182-192.
-
Murray DL, Ryu E, Snyder RM, Katzmann JA (2009) Quantitation of serum monoclonal proteins: relationship between agarose gel electrophoresis and immunonephelometry. Clin Chem 55(8): 1523-1529.
-
Barta O (1981) Laboratory Techniques of Veterinary Clinical Immunology: A review. Comp Immunol Microbiol Infect Dis 4(2): 131-160.
-
Boyum A (1968) Isolation of mononuclear cells and granulocytes for human blood. Scand J Clin Invest 21(97): 77-89.
-
Hudson L, Hay FC (1980) Immunology 2nd (edn), Blackwell Scientific publication, Oxford, London, Edinburgh, Boston, Melboure, pp: 31.
-
Hanks JH, Wallace JH (1985) Determination of T-cell viability. Proc Soc Exp Biol Med 98: 183-192.
-
Chi DS, Bhogal BS, Fox GJ, Thorbecke GJ (1984) Effect of temperature and lymphokines on mixed lymphocyte and mitogen responses of chicken lymphoid cell in vitro. Dev Comp Immunol 8(3): 683- 694.
-
De Cock W, Decree J, Van Wauwe J, Verhaegen H (1980) Measurement of mitogen stimulation of lymphocytes with a glucose consumption test. J Immunol Methods 33(2): 127-131.
-
Ruangroupan L, Kiato T, Yoshida T (1986) Protective efficacy of Aeromonas hydrophila vaccines in Nile tilapia. Vet Immunol Immunopathol 12(1-4): 345- 350.
-
Puerto M, Gutierrez-Praena D, Prieto AI, Pichardo S, Jos A, et al. (2011) Subchronic effects of cyanobacterial cells on the transcription of antioxidant enzyme genes in tilapia (Oreochromis niloticus). Ecotoxicology 20(2): 479-490.
-
Schmittgen TD, Livak KJ (2008) Analyzing real-time PCR data by the comparative C(T) method. Nature Protocols 3(6): 1101-1108.
-
Chris H, Igorsiveroni S (2005) Static Analysis, 12th International Symposium, SAS, London, UK, September 7-9, Proceedings. Springer lecture notes in computer science ISBN 3-540-28584-9.
-
Kasiri M, Farahi A, Sudagar M (2011) Effects of supplemented diets by levamisole and of Echinacea purpurea extract on growth and reproductive parameters in angelfish (Pterophyllum scalare). AACL Bioflux 4(1): 46-51.
-
Goda S (2008) Effect of Dietary Ginseng Herb (Ginsana® G115) Supplementation on Growth, Feed Utilization, and Hematological Indices of Nile Tilapia, Oreochromis niloticus (L.), Fingerlings. J of the World Aqua Soc 39(2): 205-214.
-
Choi I, Tea KK, Bang IC, Kwon M, Lee JH, et al. (2010) Effects of dietary inclusion of Red Ginseng byproduct on growth, body composition, serum chemistry and lysozyme activity in juvenile olive flounder(Paralichthys olivaceus). Fish Aqua Sci 13(4): 300-307.
-
Sanchez-Martínez JG, Pérez-Castañeda R, Rábago- Castro JL, Aguirre‐Guzmán G, Vázquez‐Sauceda ML (2008) A Preliminary Study on the Effects on Growth, Condition, and Feeding Indexes in Channel Catfish, Ictalurus punctatus, after the Prophylactic Use of Potassium Permanganate and Oxytetracycline. J World Aqua Soc 39(5): 664-670.
-
Maass N, Bauer J, Paulicks BR, Bohmer BM, Rot-Maier DA (2005) Efficiency of Echinacea purpurea on growth performance and immune status in pigs. J Anim Physiol Anim Nutr (Berl) 89(7-8): 244-252.
-
Przybilla P, Weib jB (1998) Pflanzliche Futterzusatzstoffe in der Schweinemast. Die Mastleistung natürlich verbessern, DGS-Magazin 40: 52-57.
-
Liu XL, Xi QY, Yang L, Li HY, Jiang QY, et al. (2011) The effect of dietary Panax Ginseng polysaccharide extract on the immune responses in white shrimp, Leptomonas vannamei. Fish shellfish immunol 30(2): 495-500.
-
Hayashi I, Ohotsuki M, Suzuki I, Watanab T (2001) Effect of oral administration of Echinacea purpurea (American herb) on incidence of spontaneous leukemia caused by recombinant leukemia viruses in AKR/J mice. Nihon Rinsho Meneki Gukkai Kaishi 24(1): 10-20.
-
Bany J, Siwicki AK, Zdanowsak D, Sokolincka I, Skopinska-Rosewska E, et al. (2003) Echinacea purpurea stimulates cellular immunity and anti- bacterial defense independently of the strain of mice. Pol J Vet Sci 6(3): 3-5.
-
Freier DO, Wright K, Klein K, Voll D, Dabiri K, et al. (2003) Enhancement of the humoral immune response by Echinacea purpurea in female swiss mice. Immunopharmacol Immunotoxicol 25 (4): 551- 560.
-
Charles RC, Rubin AS, Henry RB (1978) Suppression of the mitogen-stimulated blastogenic response during reticuloendotheliosis of virus-induced tumorigenesis: Investigations into the Mechanism of Action of the Suppressor. J Immunol 120(4): 1313- 1320.
-
Ali SM, Mohamed MF (2010) Echinacea purpurea and allium sativum as immunostimulants in fish culture using Nile tilapia (Oreochromis niloticus). J Anim Phisiol Anim Nut (Berl) 94(5): 31-39.
-
Ramazan S, Hasmet C, Ibrahim O, Suleyaman A, Fikri B (2005) The effect of oxytetracycline on non-specific immune response in sea bream (Sparus aurata L. 1758). Turk J Vet Ani Sci 29: 31-35.
- Genetic Improvement of Nile Tilapia (Oreochromis niloticus): Advances in Selective Breeding and Genomic Approaches for Sustainable Aquaculture
- Microplastics, Contaminants, and Waste Hotspots: Divergences and Faults in Prioritizing Control Efforts
- Creating a Healthier, More Vibrant Open and Closed Aquatic Environment. A Submersible, Centrifugal Magnetically Affixed Current Changing Aquarium Pump
- An Attempt to Assess Alpha Diversity and Sample Size: Using the Ostracod Assemblages off Kumamoto Port, Japan
- Assessment of the Efficiency of Common Fishing Gears and Crafts Used at Mohananda River of Chapai Nawabganj, Bangladesh
- Fish Productivity and Biodiversity Status of Sundarban Mangrove in Bangladesh