Tracking Environmental Changes in Manzala Lake Integrating Landsat Data Based on Interpolation Nonlinear Models
Change detection is one of the most significant indicators that serve the sustainable development of the ecosystem. The aim of study is to make spatial interpolation prediction models for environmental changes of Manzala Lake based on Landsat images, different indices and statistical models. This aim is to assess the environmental changes in the Lake from 1992 to 2019. Vegetation cover was increased tremendously from 19.36 to 35.18 %. Water bodies were decreased from 52.45 to 45.50 % and bare lands were decreased from 28.19 to 19.32 %. Results indicated the order of models efficiency and accuracy as follow; quadratic > logarithm > Linear > Exponential. Consequently, the quadratic model was selected for assessing the environmental changes in the study area. Quadratic model was used to expect changes from 2020 to 2042. There will not be change in the area of the lake, when surface water and urban areas are equally within the studied area. The obtained data from used statistical models at the end of 2042 give assumption that the vegetation cover will disappear. While in the following period, models failed to describe what will be occur. This is ensured from the value of absolute error that less than one. The analyzed data for some physiochemical parameters showed different water quality between 2016 and 2019, as it is more suitable in 2019. MODIS/Aqua data indicate lower chlorophyll concentrations at 2018 and higher in 2015. The study can aid decision makers within solutions to manage and keep area and biodiversity of Lake Manzala using new technologies.
Introduction
Studying land use/cover changes of Manzala Lake is very important for sustainable development of biodiversity. Anthropogenic activities are responsible for controlling change in the uses of land. Assessment and detection of environmental changes serve the ecosystem of Manzala Lake. Ecosystem services contribute to human well-being in various ways and can be subdivided into provisioning, regulating and cultural services. Adverse impacts on socio-economic, biological, climatic and hydrological aspects of the environment may be related to land use/cover changes. Where environmental changes may be increased due to numerous sources of pollution. Change detection in land use/land cover is one of the most fundamental key issues to monitor the environment change and natural resource management, and critical factor to properly understand the interaction and the relationship between human activities with the environment. Also, change detection across spatial and temporal scales is indispensable to achieve precisely sustainable environmental management. Manzala Lake typically occupies a significant role for fish consumption by a human. Fundamental changes may also occur by the government of Egypt that drained large areas of the lake to convert it to farmland. Manzala Lake may be exposed to environmental changes within different impacts by Human activities. The lake changed from a connected regenerated saline water body to semi-closed sub-basins as far as the narrow water exchange inlets are not sufficient. Also, the lake typically receives large amounts of untreated sewage and irrigation returns [1]. Domestic, agricultural and industrial effluents are brought from urban centers along the lengths of main drains such as Bahr El Baqar through which more than 30% of the inflow passes to the lake [2]. Manzala Lake was chiefly affected by the continuous discharge of wastewaters. Recently, using remote sensing and modeling of environmental changes has been applied universally. Remote Sensing is the science of obtaining information about surface features and their creative process from a distance without direct contact with the earth. Remote sensing applications are good tools for instantly improving and detecting environmental changes. It was recorded that human activities, represented by wastewater discharge, have dramatically affected the quality of water. Domestic and agricultural activities in the surrounding area to Burullus Lake have remarked a great impact on the nutrient concentrations [3]. Remote sensing characterized by a high variety of spatial and temporal scales. Remote Sensing techniques have been successful in mapping and detecting land use and land cover changes. The spatial and temporal distribution of land use/cover using satellite images is critically important to recognize and explain the phenomenon of global environmental change. Depending of remote sensing images, spatial Interpolation was applied for resolving many problems of prediction. One of the problems facing environmental changes is the accuracy of area accurately calculating because the data are missing or the considerable difficulty of measurement or it is impossible to make measurements for the continuous area studied because this work is costly materially or morally. These mathematical models are called spatial interpolation [4]. Therefore, spatial interpolation models can be defined as a set of statistical methods used to predict the values of phenomena in sites where accurate measurements are not available based on a limited number of measured points. Many researchers have typically published scientific studies on Lake Manzala with linear regression lines that predict the surface area of the lake as a relationship with time sees [5, 6]. However, after several years and marked changes in the conditions of the lake, it became clear that the linear relations do not accurately describe the surface area of the lake. Based on a set of statistical criteria, the best spatial interpolation model can be determined precisely to represent the reality of the environmental changes in the study area. The aim of the present study is to positively predict the environmental changes in Manzala Lake in the future using spatial interpolation based on data acquired from remote sensing and GIS techniques.
Materials and Methods
Study Area
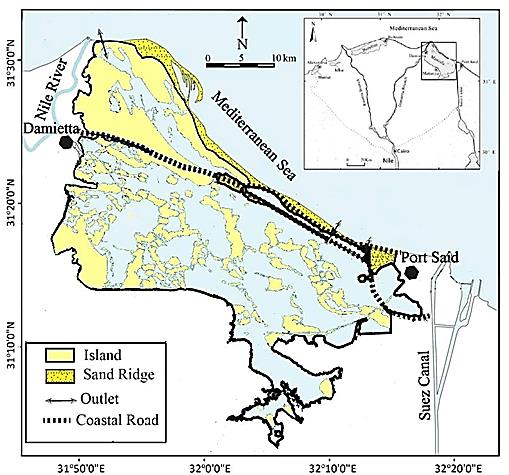
Manzala Lake is the largest coastal lake in Egypt, a shallow brackish lake extending between the Damietta Nile River branch and the Suez Canal with a maximum length of 50 km along the vulnerable Mediterranean coast. Manzala Lake is located at the northeastern part of the Nile Delta, a sandy beach ridge separate the lake from the sea. While it connected to the Mediterranean Sea through Boughaz El-Gamil inlets 1 & 2 (Figure 1). It is typically located between longitudes 31° 45ʹ and 32° 22ʹ E and latitudes 31° 00ʹ and 31° 35ʹ N. Km2. The lake is shallow, typically ranging from 0.7 to 1.5 m in considerable depth. It connected to the North by the Mediterranean Sea, East by Suez Canal, South by El-Salam Canal and West by Damietta Branch of River Nile.
Water samples collected at two periods (2016 & 2019) and are analyzed according to Table 1.
| Parameter | Method &Reference |
| Depth and Transparency | APHA [7] |
| Temperature and Dissolved Oxygen | Lutron YK-22 DO meter |
| pH | Electrical-pH meter (Model Lutron YK-2001pH meter) |
| Conductivity (EC), Total dissolved salts (TDS) and salinity | Conductivity meter (Model Corning, NY 14831 USA) |
| Nutrients (NH4, PO4, NO2, NO3 and SiO4) | For ammonium determination, samples were fixed in the field. All are measured according the methods described by Grasshoff, et al. [8] |
Table 1: Methods of water parameters analysis.
Remote Sensing Applications
Data Collection: Three Landsat images were acquired using http://glovis.usgs.gov/, Path: 176 and Row: 38. Landsat Thematic Mapper (TM), Enhanced Thematic Mapper Plus (ETM+) and Operational Land Imager and Thermal Infrared Sensor (OLI/TIRS) images were acquired on 1992, 1994, 1997, 2000, 2003, 2006, 2009, 2014, 2017 and 2019, respectively have been selected for mapping and detecting environmental changes of Manzala Lake (Table 2). A field investigation was applied universally and instantly confirmed typically using a topographic map with scale 1: 50,000.
| Sensor | Year | Resolution (m) |
| TM | 1992 | 30 |
| TM | 1994 | 30 |
| ETM | 1997 | 30 |
| ETM | 2000 | 30 |
| ETM | 2003 | 60 |
| ETM | 2006 | 30 |
| ETM | 2009 | 30 |
| OLI | 2014 | 30 |
| OLI | 2017 | 30 |
| OLI | 2019 | 60 |
Table 2: Characteristics of Landsat images from 1992 to 2019.
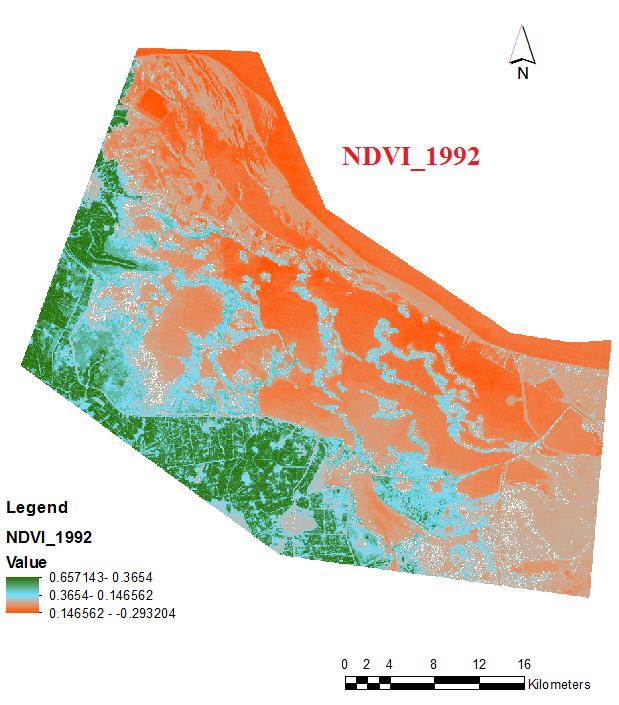
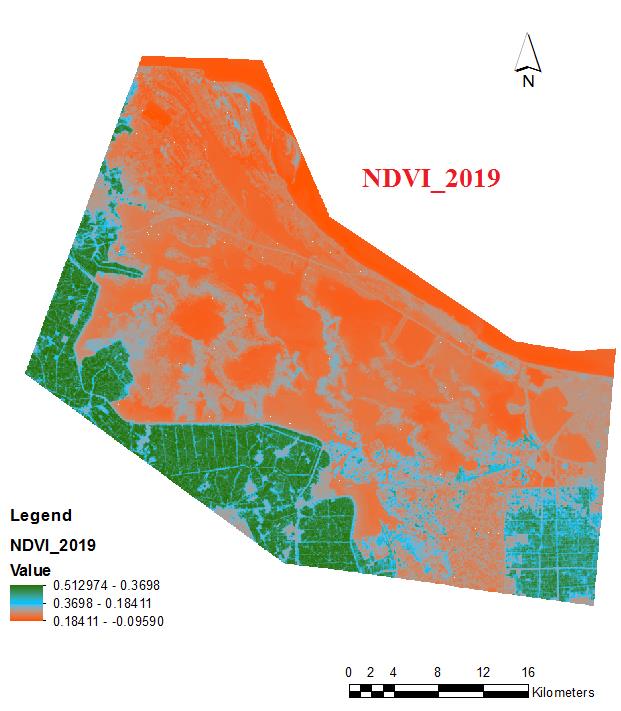
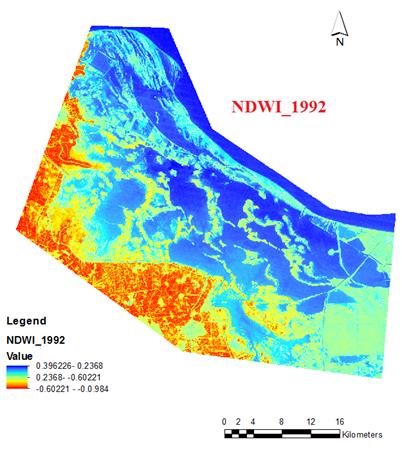
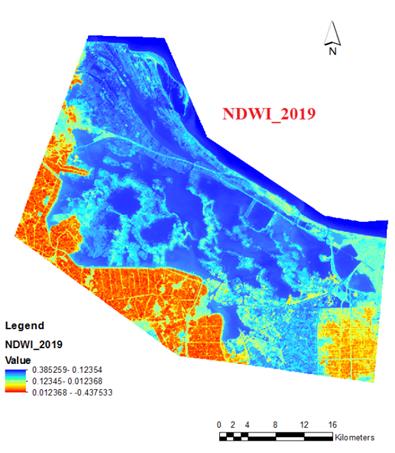
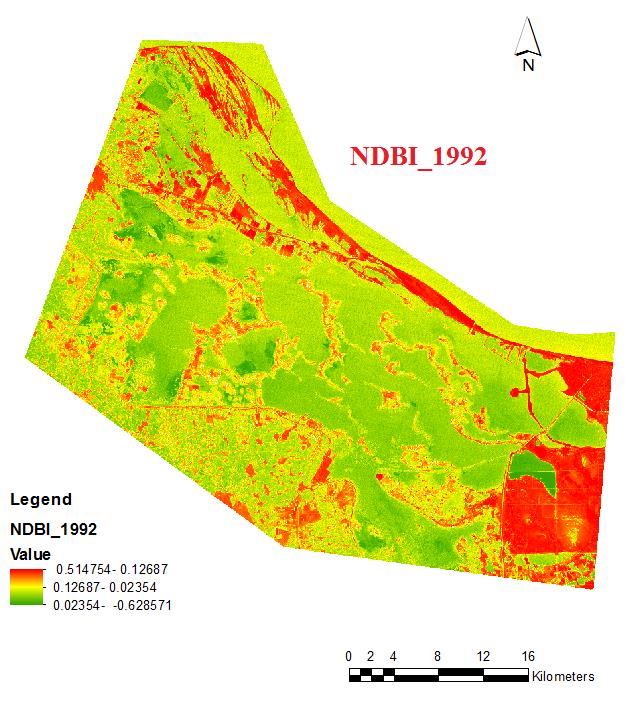
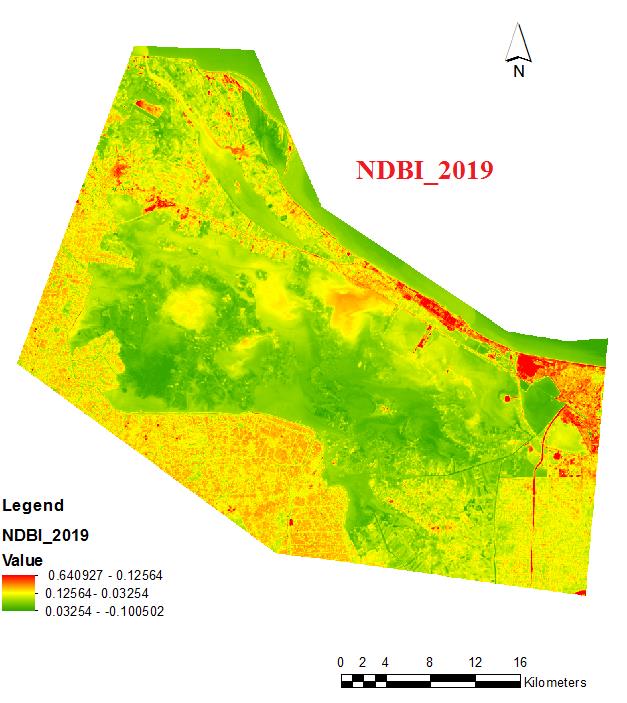
Table 2: Characteristics of Landsat images from 1992 to 2019. Image pre-processing and enhancement: Preprocessing applications as; atmospheric correction, radiometric calibration, geometric correction was typically applied to all images for further interpretation and enhancement using ERDAS Imagine. The geographical coordinates are unified by the latitude and longitude coordinate system WGS_1984_UTM_Zone_36N, and the projection mode is the horizontal axis Mercator projection. After images correction, Principal component analysis (PCA) was applied to reduce interferences for sustainable development of change detection. Image Classification: Maximum likelihood supervised classification was applied as the most accurate method in this present study to instantly detect different features of Manzala Lake. Supervised classification technique can studiously avoid digital problems resulting from the fundamental difference in the sensor and the atmosphere. Land Use and Land Cover: Land use and land cover are one of the most important natural resources. Remote sensing is one of the most important mechanisms of monitoring changes at different time periods. Vegetation cover was applied using Normalized different vegetation index (NDVI) as equation 1. While water surface area was calculated from normalized different water index NDWI (equation 2) according to the Modeler Function in ERDAS. The values of these indexes varies from -1 to 1, based on the vegetation density and water cover areas, and resembles high when the value close to one. NDWI was applied using the ERDAS molder to sufficiently reduce any noise pixels [9]. It's difficult to carefully distinguish between built-up areas and bare lands in any area; therefore, an index to map bare lands in the selected study area. The bare area can be detected using normalized built up area index (NDBI) (equation 3). The appropriate methodology comprised three arithmetic computations [10].
𝑁𝑒𝑎𝑟 𝑖𝑛𝑓𝑟𝑎𝑟𝑒𝑑−𝑅𝑒𝑑
NDVI=
𝑁𝑒𝑎𝑟 𝑖𝑛𝑓𝑟𝑎𝑟𝑒𝑑+𝑅𝑒𝑑 (1)
Green−Near infrared
NDWI =
Green+Near infrared (2)
SWIR−NIR
NDBI =
SWIR+NIR (3) Change detection analysis: Change detection determines the place and the considerable amount of fundamental change in a certain land cover at different times. Most of the change detection techniques rely on images classification, whether supervised classification or unsupervised classification. In this study, drilling and drying were applied to averaged time images between 1992 and 2019, to identify the occurred changes in Manzala Lake within different time. Chlorophyll a concentration according to MODIS- Aqua: The data of chlorophyll from 2002 to 2019 is available as the site of Giovanni v. 3.41. Acquired available data were selected in different years of 2005, 2008, 2012, 2015 and 2018 in 12 months. The selected region involved Manzala Lake with coastal area nearby the lake with coordinates of (31.7725 E, 31.0666 N and 32.3822 E, 31.5417 N). This data acquired from https://giovanni.gsfc.nasa.gov/giovanni/.
Statistical Models
Regression lines are helpful to know what interstitial values we could not practically know. It is useful to predict future values theoretically and can be trusted in statistical ways. The main advantage of these models is that they allow the reproduction of large-scale systems and long timescales. Statistical models vary from simple linear to complexity nonlinear depending on the nature of the phenomenon to be modeled. Four models were tested in this study for prediction of environmental changes: Linear, quadratic, Exponential and logarithm using Origin software 8.5. Linear model: Linear model is used in different ways according to the context. The most common occurrence is in connection with regression models, and the term is often taken as synonymous with linear regression model. They can help you understand and predict the behavior of complex systems or analyze experimental, financial, and biological data. Linear regression is a statistical method used to create linear model.
A quadratic regression: It is the process of finding the equation of the parabola that best fits a set of data. Exponential model: It is exhibited when the change the change per instant or unit of time of the value of a mathematical function of time is proportional to the function's current value, resulting in its value at any time being an exponential function of time. Exponential decay occurs in the same way when the growth rate is negative. A logarithmic Model: It is a model that measures the magnitude of the thing it's measuring. It can also be seen as the inverse of an exponential model. Assessment Methods: The accuracy of spatial interpolation models was assessed depending on three Statistical criteria: Root Mean Square Error (RMSE), coefficient of determination (R2) and residual sum of squares (RSS). The model can be validated with low RSS, low RMSE and with R2 value near to one. RMSE: It is used as an essential indicator that assesses the accuracy of spatial analysis in geographic information system and remote sensing (Lower (RMSE) is mainly to give most reliable values in the areas with no data. The minimum (RMSE) calculated by Cross Validation can be used to find the best spatial interpolation model control parameters [11]. The root mean square error (RMSE) was calculated for each model prediction using the formula:
RSS: it is also known as the sum of squared residuals (SSR) or the sum of squared errors of prediction (SSE) is the sum of the squares of residuals (deviations predicted from actual empirical values of data). It is a measure of the discrepancy between the data and an estimation model. A small RSS indicates a tight fit of the model to the data. It is used as an optimality criterion in parameter selection and model selection.
$$ \mathrm {R S S} = \sum_ {\mathrm {i} = 1} ^ {\mathrm {n}} \left(\mathrm {f} _ {\mathrm {i}} - \mathrm {O} _ {\mathrm {i}}\right) ^ {2} $$ i=1 Where n is he number of predicted value and 𝑓𝑖 denoted to our estimation of observed value𝑂𝑖. And so, 𝑂̅ and 𝑓̅ are mean values of observed and estimation respectively.
Results and Discussion
Lab Analysis
- RMSE = √∑
- (fi −Oi)2 n i=1 n
- R2: It is expressed by the ratio of total squares of regression divided by total squares. The value ranges between the correct one and zero and is calculated by the following equation
- 2
- 𝑅2 =
- [∑
- (𝑂𝑖−𝑂̅)(𝑓𝑖−𝑓̅) n i=1
- ]
- 2 n i=1 n i=1
- ∑
- (Oi −O̅)2 ∑
- (𝑓𝑖−𝑓̅)
- No
- Site
- Depth Trans DO Temp pH
- EC
- Sal
- TDS
- Chl
- NO2
- NO3
- PO4
- SiO4
- NH4
- 1
- Elboughaz_1
- 140
- 20
- 11.9 18.9 9.33 57.3 37.3 34400 452.75 100.72 152.75 226.65
- 870
- 215
- 2
- Elboughaz_2
- 70
- 20
- 8.8
- 19.7 8.94
- 69 46.4 42500 102.76 107.29 254.81 191.42
- 660
- 132
- 3 near Port Said
- 90
- 30
- 7.7
- 19.9 8.38 11.6 6.6
- 6465
- 90.15 305.92 1367 243.49 2095
- 108
- 4
- Hadous
- 100
- 20
- 8
- 20.7 8.51 8.55 4.7
- 4640 865.95 103.54 247.7 200.61 5885
- 91
- 5
- Bahr Elbaqar
- 70
- 20
- 2.6
- 21.2 8.22 9.25 5.1
- 5050 368.03 116.67
- 68
- 298.62 7545
- 396
- 6
- Elmatria
- 110
- 20
- 9.6
- 20.6 8.53 6.24 3.4
- 3300 646.61 131.69 476.65 209.8
- 5600
- 111
- 7
- Elnasima
- 150
- 30
- 6.5
- 20.4 8.17 5.58
- 3
- 2930
- 18.27 80.08 368.93 183.77 4665
- 80
- 8
- Temsah
- 70
- 20
- 11.7 20.8 8.82 20.6 12.2 11700 228.45 17.83 344.28 90.35
- 6115
- 55
Table 3: Physiochemical Parameters in water samples (2016) from different sites in Manzala Lake.
| No | Site | Temp | pH | EC | Sal. | TDS | Chl | NO 2 | PO 4 | SiO 4 | ||||||||||||||||||||||
|---|---|---|---|---|---|---|---|---|---|---|---|---|---|---|---|---|---|---|---|---|---|---|---|---|---|---|---|---|---|---|---|---|
| 1 | Bahr Elbaqar | 30.5 | 8.05 | 4.59 | 1.8 | 1710 | 101.8 | 52.238 | 27.26 | 1111 | ||||||||||||||||||||||
| 2 | Elboughaz | 30.4 | 7.87 | 37.1 | 15.9 | 14600 | 83.43 | 25.337 | 4.59 | 648 | ||||||||||||||||||||||
| 3 | Elbashteel | 30.5 | 8.19 | 4.87 | 1.9 | 1790 | 152.15 | 24.398 | 5.51 | 770 | ||||||||||||||||||||||
| 4 | Eltemsah | 30.5 | 7.92 | 46.6 | 20.6 | 18400 | 316 | 24.086 | 14.4 | 859 | ||||||||||||||||||||||
| 5 | Legan | 30.5 | 8.38 | 4.04 | 1.5 | 1430 | 241.87 | 27.214 | 28.18 | 865 | ||||||||||||||||||||||
| 6 | Deshdy | 30.5 | 8.31 | 7.95 | 3.2 | 3070 | 87.79 | 26.901 | 16.54 | 988 | ||||||||||||||||||||||
| 7 | Elhmra | 30.6 | 8.05 | 45.5 | 20 | 18000 | 61.13 | 25.337 | 5.51 | 808 | ||||||||||||||||||||||
| 8 | Aboat | 30.7 | 8.17 | 29.3 | 12.3 | 11600 | 51.75 | 26.588 | 8.27 | 1054 | ||||||||||||||||||||||
| 9 | Elzerka | 30.8 | 8.17 | 20.1 | 2 | 1970 | 71.46 | 24.086 | 4.59 | 1464 | ||||||||||||||||||||||
| 10 | Elgenka | 30.7 | 8.36 | 5.36 | 8.3 | 8040 | 234.34 | - | 20.52 | 774 |
Table 4: Physiochemical Parameters in water samples (2019) from different sites in Manzala Lake.
| Parameter | Unit | Average of study (2016) | El-Sonbati et al. [14] | Elnaggar & El-Alfy [15] | EL-Shafei [16] | Elshemy [17] | Abd El-Hamid, et al. [18] | El-Mezayen [19] | Average of study (2019) | |
|---|---|---|---|---|---|---|---|---|---|---|
| Depth | cm | 100 | 150 | 130 | - | - | - | - | - | - |
| Trans | cm | 22.5 | - | 32 | - | - | 25 | - | - | - |
| DO | mgL-1 | 8.35 | 7.5 | 10.57 | 10.65 | 5.36 | 9.2 | 5.01 | ||
| Temp | °C | 20.28 | - | 19.5 | 23.75 | 23.43 | 15.3 | 21.9 | 30.6 | |
| pH | - | 8.61 | 8.03 | 8.3 | 8.18 | 8.3 | 8.7 | 8.42 | 8.15 | |
| EC | ms/cm | 23.52 | 7.2 | 10.9 | - | 7.35 | - | 40.6 | 20.5 | |
| Sal | ‰ | 14.84 | 4.7 | - | 32.25 | - | 15.6 | 25.4 | 8.75 | |
| TDS | mgL-1 | 13873.13 | 4520 | - | - | - | - | 23790 | 8061 | |
| Chl | μgL-1 | 346.62 | - | 38.9 | - | 41.9 | 163 | - | 140 | |
| NO2 | μgL-1 | 120.47 | 126.1 | 82.03 | 305 | - | 180 | - | 28.5 | |
| NO3 | μgL-1 | 410.02 | 136.75 | 232.27 | 1905 | 190 | 370 | 1.38 | - | |
| PO4 | μgL-1 | 205.59 | - | 49.2 | - | 220 | 200 | 8.6 | 13.5 | |
| SiO4 | μgL-1 | 4179.38 | - | 2241.7 | - | - | 560 | - | 934 | |
| NH4 | μgL-1 | 149 | 457.83 | 753.67 | 215 | - | 50 | 4.52 | - |
Table 5: Comparison of study results (2016 and 2019) with other different studies in other years.
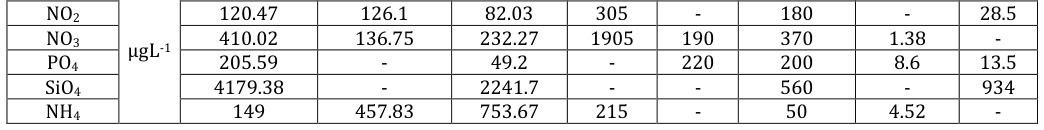
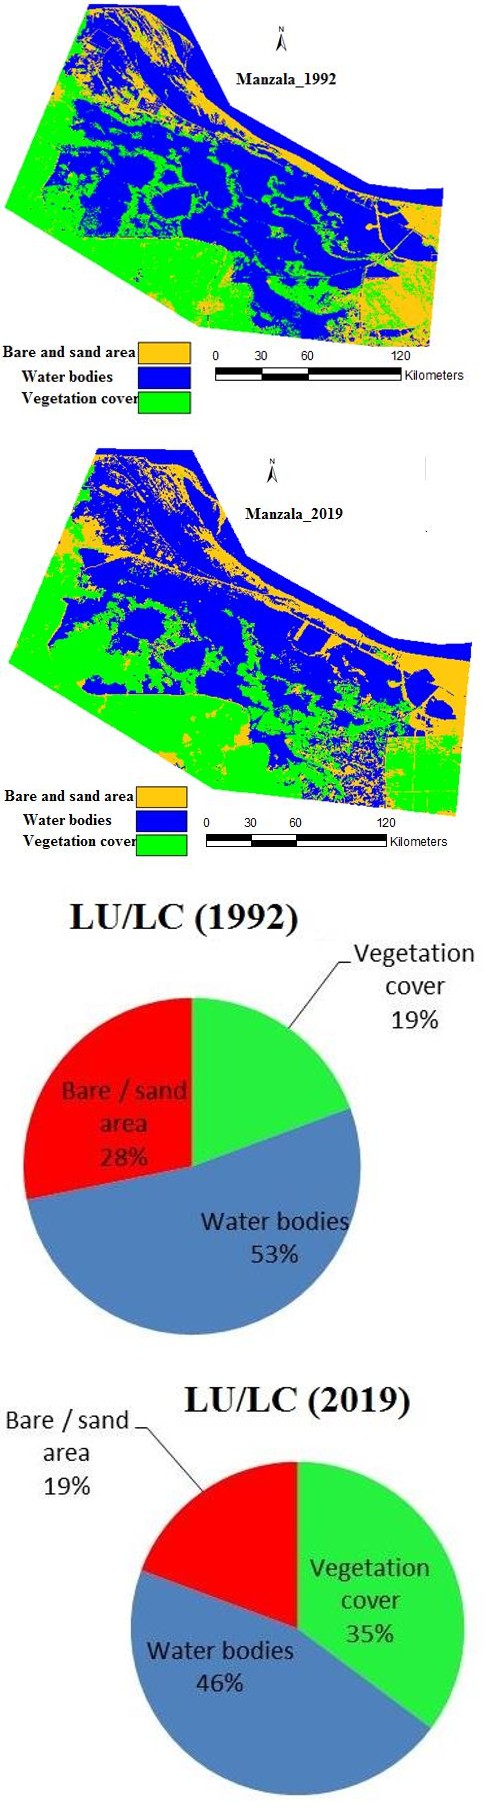
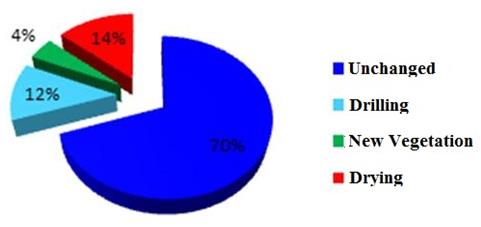
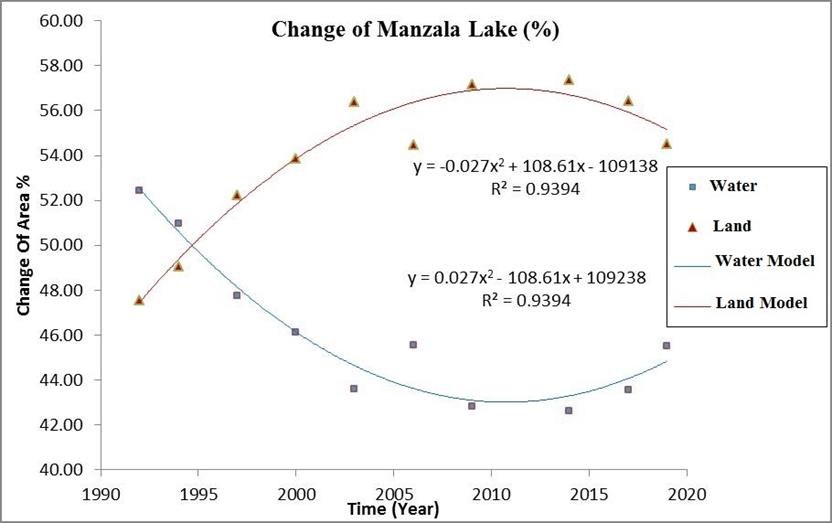
Table 5: Comparison of study results (2016 and 2019) with other different studies in other years. Trans: Transparency of Secchi Disk, DO: Dissolved Oxygen, Temp: Temperature, EC: electrical conductivity, Sal: salinity, TDS: Total Dissolved Solids, Chl: Chlorophyll According to the topographic map and Google earth investigation, supervised classification was typically applied to show the unique features of the study area. In the present study, three classes were gently applied in 1992 and 2019. It was correctly classified into vegetation, water and bare/sand areas (Figure 3). The purpose of supervised classification is to assess the spatial distribution of each land cover class. Lake Manzala served as a significant source of biodiversity, but changes due to anthropogenic impacts have reduced the biodiversity of the lake. Remote sensing applications were applied for studying and detecting environmental changes. Table 6 shows the percentage of water, vegetation and bare/sand areas from 1992 to 2019. For vegetation cover, NDVI was other hand, bare lands have been decreased from 28.19 to 19.32 % (Figure 6). The marked decrease in bare land is a good indicator for the biodiversity of the lake and bird migration. This decrease in bare lands is probably due to increasing the area of vegetation cover. This decrease is due to continuous land reclamation projects along the southern and eastern shores of the lake and fish farming processes. Bare lands were like a result of the clearing of the lands for agricultural and building purposes. The gradual decrease in bare land is a good indicator for biodiversity of the lake and bird migration. This decrease in bare lands is probably due to increase tremendously the area of vegetation cover [20]. The government of Egypt drained substantial portions of the lake in an effort to convert its rich Nile deposits to farmland. The lake which was the biggest coastal wetland along the Mediterranean coast is moving toward its disappearance by two opposite forces; one of them is the shrinking of the water body by siltation of sediments typically coming from agricultural lands and the abundance of weeds and swamp vegetation as well as the drying practices for agriculture, whereas the other force incorporates the removal of the coastal sand bar carefully separating the lake from the Mediterranean Sea by erosion, which should eventually lead to the conversion of the lake into a coastal embayment instead of being a closed coastal lagoon. Land reclamation has also reduced the lake surface by half, and, despite the declining quality of life and standards of living near the lake, human populations are increasing, exacerbating the lake’s problems. According to change detection from 1992 to 2019, there are some gradual changes in this modern period (Figure 7). 70% of the total area not changed. Some drilling and drying processes applied in this period as a percentage of 12% and 14 %, respectively. According to vegetation cover increase, vegetation appears prominently in this period as a percentage 4%. According to pixel count and size two models for water and bare/sand areas were applied using ArcGIS 10.5. These models were assessed to predict the change detection from 1992 to 2019 (Figure 8). It showed that the coefficient of determination was approximately 0.92 which is close to 1.
| Area in Percentage (%) | Total | |||
|---|---|---|---|---|
| Year | Vegetation cover | Water bodies | Bare / sand area | |
| 1992 | 19.36 | 52.45 | 28.19 | 100 |
| 1994 | 19.53 | 50.95 | 29.51 | 100 |
| 1997 | 27.19 | 47.77 | 25.04 | 100 |
| 2000 | 31.31 | 46.14 | 22.54 | 100 |
| 2003 | 32.71 | 43.6 | 23.69 | 100 |
| 2006 | 34.08 | 45.55 | 20.37 | 100 |
| 2009 | 40.73 | 42.85 | 16.42 | 100 |
| 2014 | 40.86 | 42.63 | 16.52 | 100 |
| 2017 | 40.02 | 43.57 | 16.41 | 100 |
| 2019 | 35.18 | 45.5 | 19.32 | 100 |
Table 6: Area percentage (%) for water, vegetation and bare area.
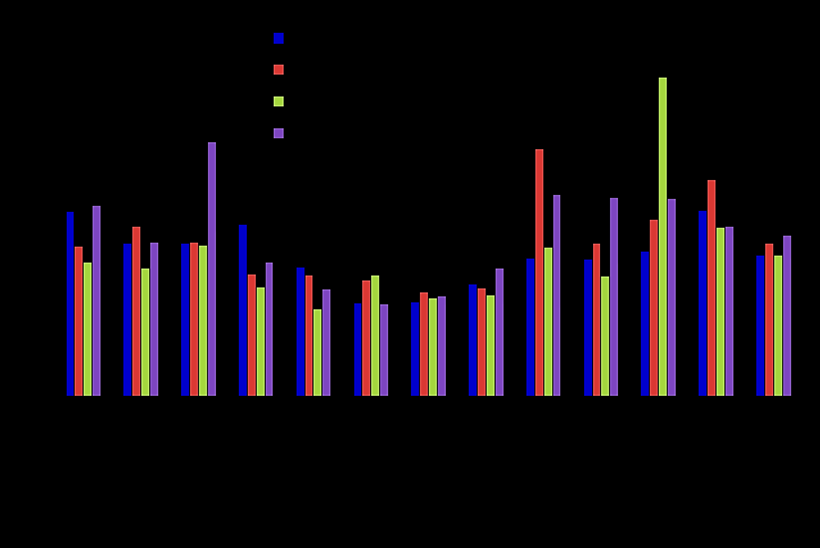
The data of chlorophyll recorded by MODIS-Aqua aid in the identification of area-averaged of Chlorophyll a concentration monthly. Also it aid in the knowledge of high and lower pollution impacts within different years. It is noticeable that the lowest concentration in selected years was at September, 2018 with concentration of 2.411 mg m-3, while the highest concentration was at November, 2012 with concentration of 8.675 mg m-3. Also the lowest mean annual concentration was 3.725 mg m-3 in 2018 and the highest mean annual concentration was 4.372 mg m-3
Statistical Models
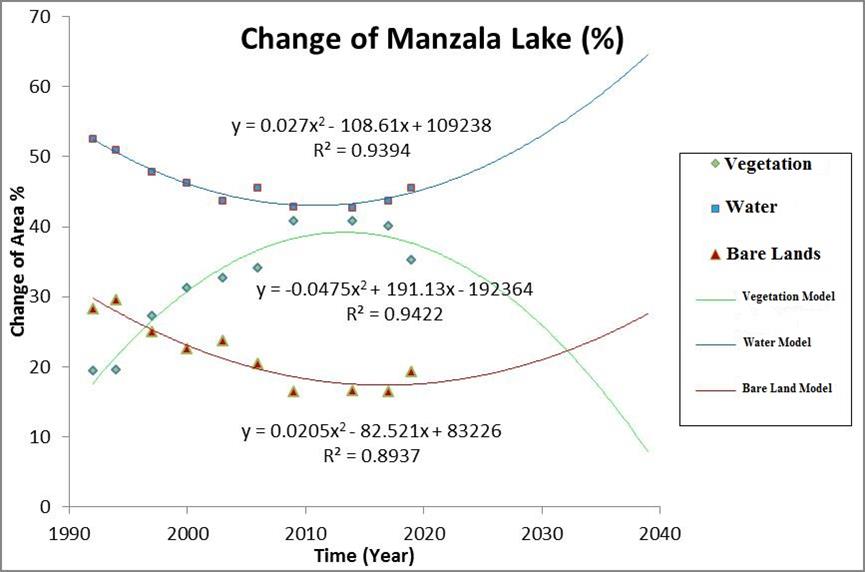
To compare the spatial interpolation models and the extensive selection of the best, the cross-validation technique provided by Origin software 8.5 was used to judge statistically the accuracy and statistical equations for different models were represented for accurate prediction of environmental changes in the study area as shown in Tables 7 to 10. The highest R2 value and the lowest RMSE and RSS values of the quadratic model occurred. It was found that quadratic model is the best method to accurately predict the status of environmental changes in Manzala Lake. Quadratic model is the best model to obtain high quality in the proportional representation of changes data and typically produce the best equations for water, vegetation and urban in the study area. The results also indicated that the Exponential model is the lowest statistical model in the accuracy the prediction of environmental changes, and the models in terms of preference in the following order: quadratic > logarithm > Linear > Exponential. According to the sufficient accuracy of these models, the quadratic model was selected for accurately assessing the environmental changes in the study area. By applying the best equations for water, vegetation and bare areas, the lake can be expected for 20 coming years as show in Table 10. The change in the area of the lake will be stopped when the sum of the surface area of the water lake with the area of the urban area equal to the total area of the study area. This naturally occurs according to these statistical models at the end of 2042, and the Green areas are almost completely disappeared in the study area. After that, the models fail to describe the change in the area of the Lake. The results in the table 10 show that the absolute error in these reasonable expectations is less than 0.1% (Figure 10).
| Model | Equation | R² | RSS | RMSE |
|---|---|---|---|---|
| Linear | y=-0.2779x+603.26 | 0.6177 | 39.2264 | 1.9805 |
| Quadratic | y=0.02701x²-108.6205x+109247.2 | 0.9394 | 6.21398 | 0.7882 |
| Exponential | y=6E6e^{(-0.006x)}$ | 0.6168 | 40.835 | 2.0207 |
| Logarithm | y=-558ln(x)+4289.1 | 0.6194 | 39.0571 | 1.9762 |
Table 7: Statistical models for the surface area of water and its performance criteria.
| Model | Equation | R² | RSS | RMSE |
|---|---|---|---|---|
| Linear | y=0.73007x-1431.77173 | 0.7346 | 135.0881 | 3.6754 |
| Quadratic | y=-0.04746x²+191.124x-192357.17 | 0.9422 | 33.11147 | 1.8196 |
| Exponential | y=8.27936E(-6)e^{(0.00757x)} | 0.34678 | 332.4915 | 5.7662 |
| Logarithm | y=1465.53113ln(x)-11110.97992 | 0.73614 | 134.3075 | 3.6648 |
Table 8: Statistical models for the area of vegetable and its performance criteria.
| Model | Equation | R2 | RSS | RMSE | ||||||||||
|---|---|---|---|---|---|---|---|---|---|---|---|---|---|---|
| Linear | y = -0.4522x +928.51012 | 0.77845 | 41.16345 | 2.0288 | ||||||||||
| Quadratic | y = 0.02045559x2 -82.50423x+83209.33 | 0.8973 | 22.21736 | 1.4991 | ||||||||||
| Exponential | y = 2.85698E8e(0.00566x) | 0.38346 | 114.5537 | 3.3845 | ||||||||||
| Logarithm | y = -907.49025ln(x) +6921.84973 | 0.77957 | 40.95543 | 2.0237 |
Table 9: Statistical models for the area of bare and its performance criteria.
| Class | Year | ||||||
|---|---|---|---|---|---|---|---|
| 2020 | 2025 | 2030 | 2035 | 2040 | |||
| Water bodies | 45.39% | 48.57% | 53.09% | 58.97% | 66.20% | ||
| Bare/sand | 17.60% | 18.79% | 21.01% | 24.25% | 28.51% | ||
| Vegetation cover | 37.06% | 32.70% | 25.96% | 16.85% | 5.37% | ||
| Total area | 100.05% | 100.06% | 100.06% | 100.07% | 100.08% | ||
| The absolute error | 0.05% | 0.06% | 0.06% | 0.07% | 0.08% |
Table 10: The predicted areas for the three classes during 20 years.
Conclusion
This study was applied to predict the environmental changes in Manzala Lake from 1992 to 2019 using remote sensing and GIS techniques. Vegetation cover was increased from 19.36 to 35.18 %. Water bodies were decreased from 52.45 to 45.50 %. Bare lands were decreased from 28.19 to 19.32 %. Based on Landsat images, models were analyzed: Linear, Quadratic, Exponential and Logarithm for the prediction of environmental changes. Quadratic model is the best method to predict the status of environmental changes in Manzala because this model has the lowest root mean square error (RMSE), the lowest residual sum of squares (RSS), and the highest coefficient of determination (R2) value. Chlorophyll a concentration according to data from MODIS/Aqua gives low mean annual concentration in 2018 and high in 2015. Water quality is more suitable in the period of 2019 than 2016.
Conflicts of Interest
The authors declare no conflicts of interest regarding the publication of this paper.
References
-
Sallam GAH, Elsayed EA (2015) Estimating the impact of air temperature and relative humidity change on the water quality of Lake Manzala, Egypt J Na Resour Dev 5: 76-87.
-
Hereher MH (2014) The Lake Manzala of Egypt: an ambiguous future. Environ Earth Sci 72(6): 1801- 1809.
-
El-Zeiny A, El-Kafrawy S (2017) Assessment of water pollution induced by human activities in Burullus Lake using Landsat 8 operational land imager and GIS The Egyptian Journal of Remote Sensing and Space Sciences. The Egyptian Journal of Remote Sensing and Space Sciences 20(S1): S49-S56.
-
Azpurua MA, Ramos KD (2010) A Comparison of Spatial Interpolation Methods for Estimation of Average Electromagnetic Field Magnitude. Progress in Electromagnetics Research 14: 135-145.
-
Dewidar KHM (2011) Monitoring temporal changes of the surface water area of the Burullus and Manzala lagoons using automatic techniques applied to a Landsat satellite data series of the Nile Delta coast. Medit Mar Sci 12(2): 462-478.
-
Hickmat H, Ibrahim MG, Mahmod WE, Negm A, Nadaoka K, et al. (2018) Forecasting future changes in Manzala Lake surface area by considering variations in land use and land cover using remote sensing approach. Arab J Geosci 11: 93.
-
APHA (1999) Standard methods, 20th (Edn.), American Public Health Association, Washington, DC, USA.
-
Grasshoff K, Kremling K, Ehrhardt M (1999) Methods of Seawater analysis, 3rd (Edn.), Wiley-VCH, Weinheim, New York, pp: 600.
-
Xu H (2006) Modification of normalized difference water index (NDWI) to enhance open water features in remotely sensed imagery. Int J Remote Sens 27(14): 3025-3033.
-
Zha Y, Gao J, Ni S (2003) Use of normalized difference built-up index in automatically mapping urban areas from TM imagery. International Journal of Remote Sensing 24(3): 583-594.
-
Mitašova H, Mitaš L (1993) Interpolation by Regularized Spline with Tension: Theory and Implementation. Mathematical Geology 25(6): 641- 655.
-
WHO (2004) Guidelines for Drinking-Water Quality, Health Criteria and Other Supporting Information, 3rd (Edn.), World Health Organization, Geneva.
-
Illinois Pollution Control Board (IPCB) (1990) Rules and Regulations, Title 35: Environmental Protection, Subtitle C: Water Pollution, Chapter I: Pollution Control Board. Springfield, IL, pp: 195.
-
El-Sonbati AM, Salem MI, El-Alfy MA (2012) detection of industrial pollution at the northeastern part of Manzala Lagoon-Egypt. Journal of Environmental Sciences 41(2): 211-235.
-
Elnaggar A, El-Alfy M (2016) Physiochemical Properties of Water and Sediments in Manzala Lake, Egypt. Journal of Environmental Sciences 2: 157-174.
-
EL-Shafei HM (2016) Assessment of some water quality characteristics as guide lines for the management of pond fish culture in Lake Manzala, Egypt. International Journal of Fisheries and Aquatic Studies 4(2): 416-420.
-
Elshemy M (2016) Water Quality Assessment of Lake Manzala, Egypt: A Comparative Study. International Journal of Scientific Research in Environmental Sciences 4(6): 0196-0207.
-
Abd El- Hamid HT, Hegazy TA, Ibrahim MS, El- Moselhy KHM (2017) Assessment of Water Quality of the Northern Delta Lakes, Egypt. Journal of Environmental Sciences 46(1): 21-34.
-
El-Mezayen MM, Rueda-Roa DT, Essa MA, Muller- Karger FE, Elghobashy AE (2018) Water quality observations in the marine aquaculture complex of the Deeba Triangle, Lake Manzala, Egyptian Mediterranean coast. Environ Monit Assess 190(7): 436.
-
Abd El-Hamid HT, Hafiz M, El-Alfy MA, Wenlong W, Qiaomin L (2019) Remote Sensing Technology for Studying the Impact of Anthropogenic Activities on the Environmental Change of Burullus Lake, Egypt. Advances in Ecological and Environmental Research (ISSN 2517-9454, USA) Science Signpost Publishing 4(10): 269-285.
- Genetic Improvement of Nile Tilapia (Oreochromis niloticus): Advances in Selective Breeding and Genomic Approaches for Sustainable Aquaculture
- Microplastics, Contaminants, and Waste Hotspots: Divergences and Faults in Prioritizing Control Efforts
- Creating a Healthier, More Vibrant Open and Closed Aquatic Environment. A Submersible, Centrifugal Magnetically Affixed Current Changing Aquarium Pump
- An Attempt to Assess Alpha Diversity and Sample Size: Using the Ostracod Assemblages off Kumamoto Port, Japan
- Assessment of the Efficiency of Common Fishing Gears and Crafts Used at Mohananda River of Chapai Nawabganj, Bangladesh
- Fish Productivity and Biodiversity Status of Sundarban Mangrove in Bangladesh