Observation of Spatial and Temporal Distribution of Dissolved Oxygen and Detection of Oxygen Minimum Zones in the Bay of Bengal
The decrease in oxygen content (deoxygenation) of coastal and oceanic waters worldwide has found to be worsened in recent decades. Recent findings indicate that the Peru-Chile margins, West African coast, the northern Indian Ocean and Bay of Bengal are increasingly vulnerable to deoxygenation events. This study observed the distribution of dissolved oxygen (DO) and found the Oxygen Minimum Zones (OMZ) in the Bay of Bengal spatially and temporally. DO data was collected from the World Ocean Database for all the years the inventory has available. A permanent hypoxic condition at the mid-layer depths (200m -900m) was observed in the shallower area. During monsoon season, due to meteorological turmoil of cyclone genesis and heavy rainfall, the area get enough oxygen. The vertical distribution is found to be as decreasing at first few hundred depths and then increasing from 1,000m to the bed. The sections show OMZs more in summer and winter; less in monsoon. The OMZs lie mostly at 200-500m depth along the continental slope or at mid-regions of the basin.
Introduction
Oxygen is a fundamental requirement for all aerobic life, from the mountain top to the greatest depths of the ocean. It is critical to the health of the planet, playing a direct role in the biogeochemical cycling of carbon, nitrogen, and many other key elements. Most gases in the air dissolve readily in seawater at the ocean’s surface. Plants and animals living in the ocean require these dissolved gases to survive. No marine animal has the ability to break down water molecules to obtain oxygen directly, and no marine plant can manufacture enough carbon dioxide to support its own metabolism. In order of their relative abundance, the major gases found in seawater are nitrogen, oxygen, and carbon dioxide. The proportions of dissolved gases in the ocean are very different from the proportions of the same gases in the atmosphere because of differences in their solubility in water and air [1].
The ocean is a major actor in mediating global oxygen cycling. Photosynthesis by marine algae produces oxygen, providing at least 50 % of the oxygen we breathe; at the same time, the ocean experiences a continuous loss of oxygen in its water column [2]. The problem of decreasing oxygen content of coastal and oceanic waters world-wide has worsened in recent decades, primarily as a result of climate change and nutrient inputs from human sources, such as agriculture and sewage. The scale of deoxygenation ranges from small coastal and estuarine regions to vast areas of the interior open ocean, termed oxygen minimum and limiting zones. The effects of local deoxygenation can be translated to larger scales through the migration of organisms and the ecological, economic and societal consequences of lost fisheries and aquaculture production in affected habitats. Hypoxic to anoxic and even sulfidic conditions have been reported for various aquatic systems, from lakes, estuaries and coastal areas to off-shore regions of the ocean, where oxygen re- supply does not compensate for its consumption [3].
A threshold value for hypoxia often used for estuaries and shallow coastal waters is 60 μmol kg-1 (approximately 1.5 ml l-1 or 2 mg l-1) Gray, et al. [4], and areas with oxygen concentrations below this level are commonly referred to as ‘dead zones’. However, tolerance to hypoxia varies greatly among marine taxa; some species require oxygen concentrations far higher than 60 μmol kg-1 for unimpaired recruitment and growth, while others are adapted for life in low oxygen conditions. In general, mobile fish and crustaceans tend to be the most sensitive [5]. Larger animals usually become increasingly scarce as oxygen concentration falls below 60 μmol kg-1 and are ultimately lost from the system. The average dissolved oxygen concentration in the ocean is presently 162 μmol kg–1 [6]. Concentrations range from over 500 μmol kg–1 in productive Antarctic waters super-saturated with oxygen Carrillo, et al. [7] to zero in coastal sediments and in permanently anoxic deep layers of isolated water bodies, such as the Black Sea and the Cariaco Basin. Hypoxia results from oxygen depletion in excess of supply as in stratified water bodies. In the coastal ocean, the number of reported dead zones has increased exponentially since the 1960s with more than 479 systems now reporting oxygen concentrations below 60 μmol kg-1 during some part of the year [8].
The Bay of Bengal is one of the less explored Large Marine Ecosystems (LMEs) of the world ocean. So considering the data scarcity, the primary goal of the study was set to observe distribution of dissolved oxygen values and to find Oxygen Minimum Zones in the Bay of Bengal spatially as well as temporally.
Materials and Methods
Study Area
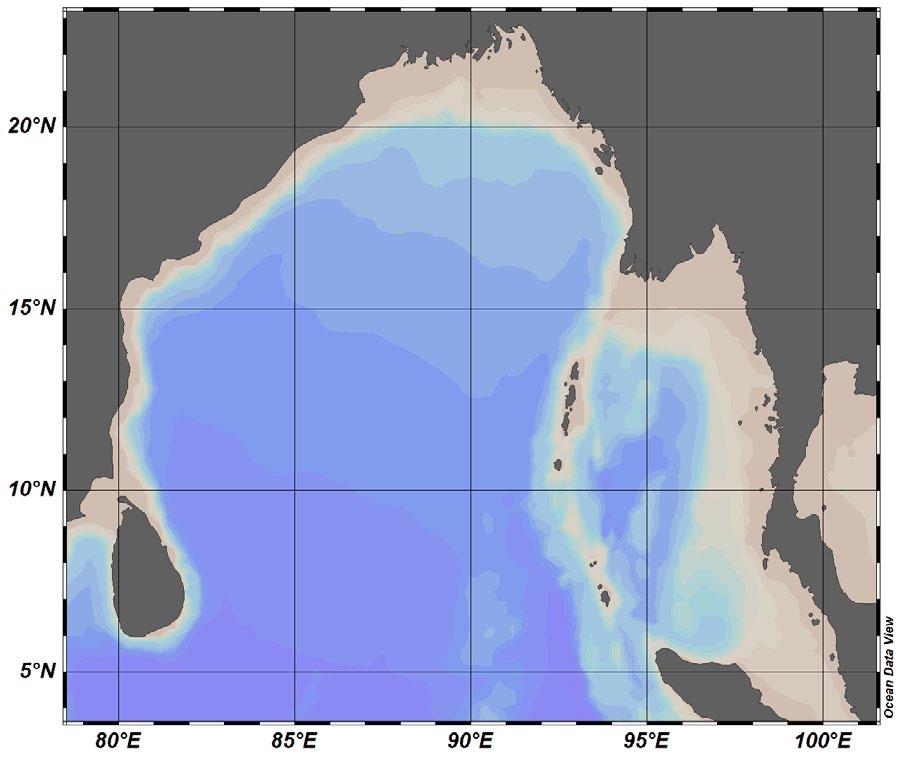
The study area Bay of Bengal, is a northern extended arm of the Indian Ocean is located between latitudes 5°N and 22°N and longitudes 80°E and 100°E (Figure 1). It is bounded in the west by the east coasts of Sri Lanka and India, on the north by the deltaic region of the Ganges- Brahmaputra-Meghna river system, and on the east by the Myanmar peninsula extended up to the Andaman-Nicobar ridges. The southern boundary of the Bay is approximately along the line drawn from Dondra Head in the south of Sri Lanka to the north tip of Sumatra. The Bay occupies an area of about 2.2 million km2 and the average depth is 2,600m with a maximum depth of 5,258m. Bangladesh is situated at the head of the Bay of Bengal.
Data Collection
Dissolved oxygen datasets were obtained from the World Ocean Database13 (WOD13) archive for the study area. The timeframe is from 1773-2016. The data collected from the instrument types are
- Ocean Station Data (OSD) (bottles, reversing thermometers);
- Conductivity-Temperature-Depth (CTD) profiler
Method of Data Analysis
Dissolved oxygen dataset used in the present study was obtained from World Ocean Database 2013. Only the good quality flag data from 1773 to 2016 were extracted from the data set and used to draw surface and section plot of dissolved oxygen for three (summer, monsoon, winter) using ODV.
- ODV collection creation from World Ocean Database data
- Surface plots creation using collection in ODV
- Section plots creation using collection in ODV
- Plotting graphs showing distribution of values in each period Three periods were chosen for plotting surface and section maps-
- March to June (Summer)
- July to September (Monsoon)
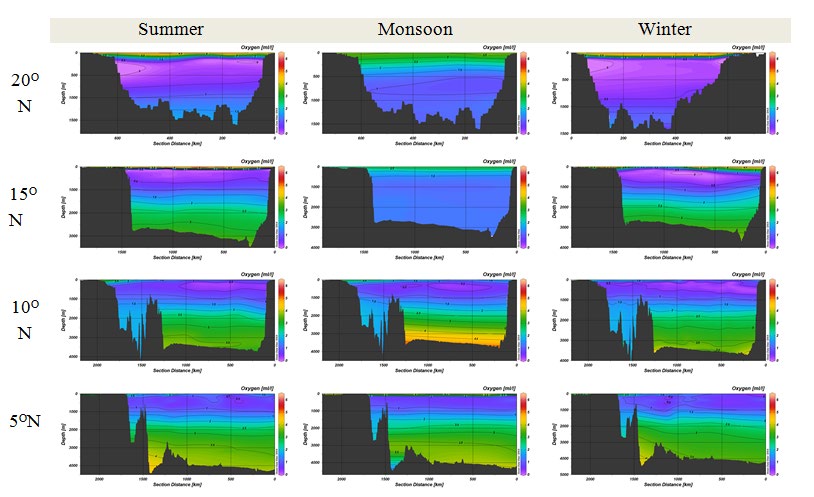
- October to February (Winter) Sections were taken at the Bay of Bengal at Different Periods. Four sections are taken along the 20ᴼ, 15ᴼ, 10ᴼand
5ᴼ N latitude line following way at each period to plot section of dissolved oxygen values (ml/l) from the surface to the bed.
Result and Discussion
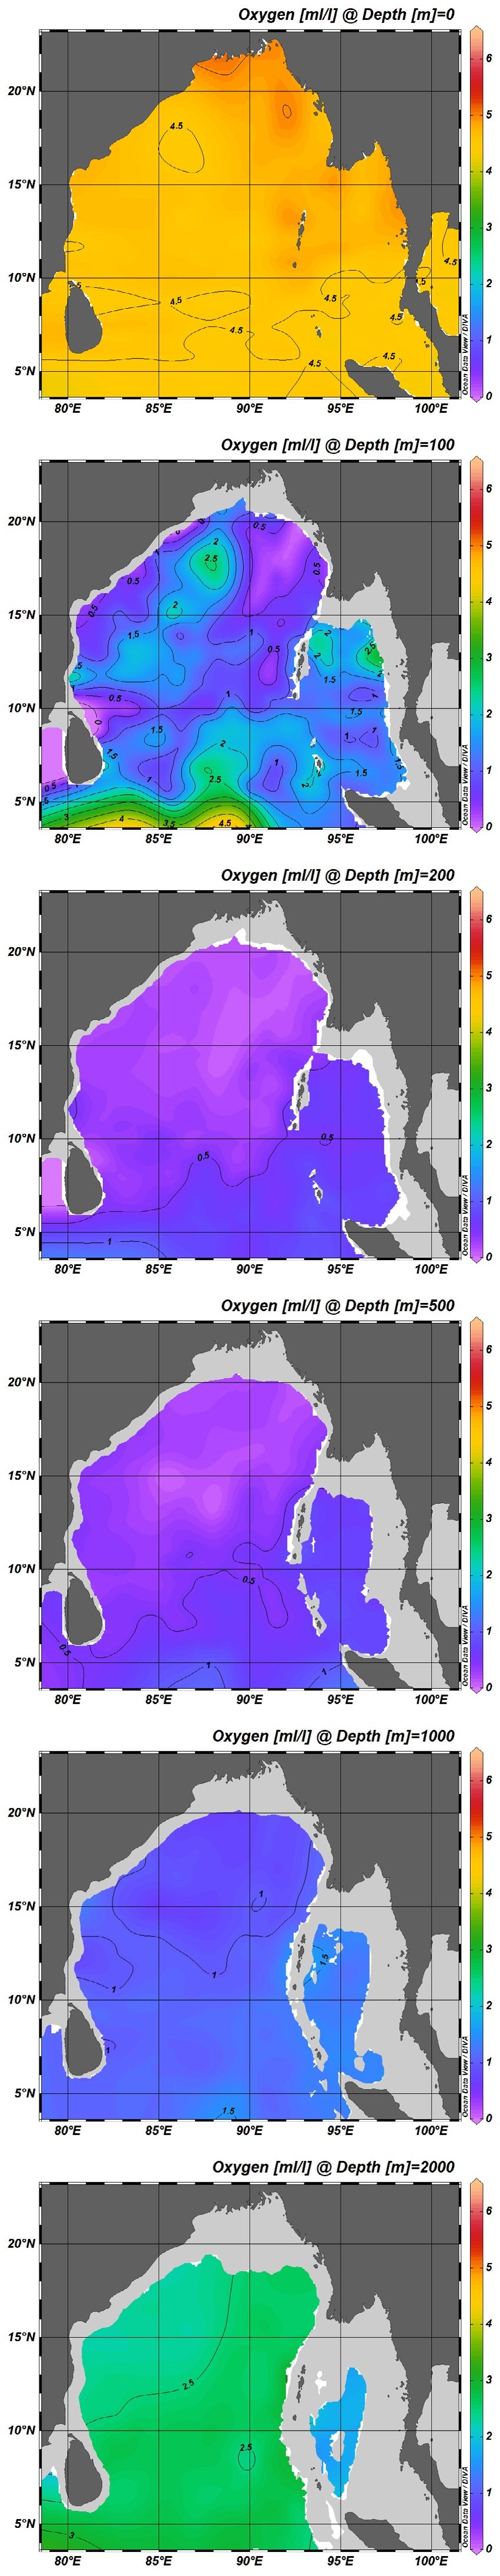
At the summer season (from March to June) at surface, the magnitude of dissolved oxygen was around 4.5 ml/l throughout the Bay. A spot appeared to be 5 ml/l near Myanmar coast and some as 4 ml/l at the southeastern tip of the Bay witin 100ᴼ E. At 100m the dissolved oxygen (DO)
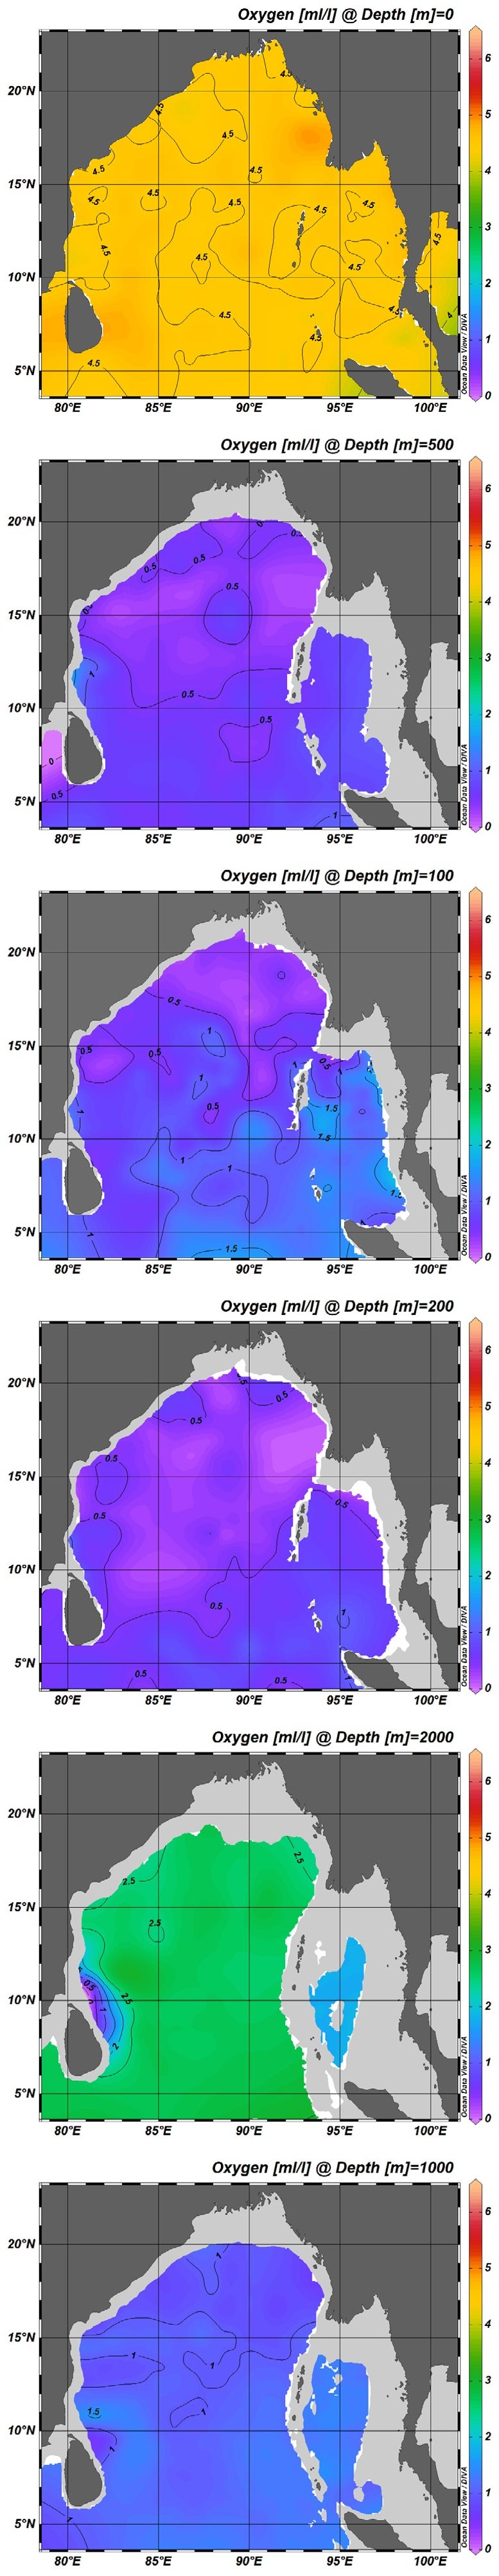
was in between 0.5 to 1.5 l/l. Some spots were less than 0.5 at the northern and mid Bay. At 200m the magnitude of DO mostly at 0.5 or less. Some regions at the southeastern bay the magnitude is 1 ml/l around the Andaman and Nicober Islands. At 500m, the magnitude was less than 0.5 to ml/l to 1ml/l. At 1000m the DO was 1ml/l at most regions and 1.5 ml/l near southeastern Indian coast. At 2000m depth the DO was 2.5 at the most regions. Some regions had a DO level of 3 ml/l. Deeper area are relatively small and DO fould to be higher (Figure 3).
During monsoon (from July to September) the values of dissolved oxygen at surface were around 4.5 ml/l throughout the Bay (Figure 4). At 100m depth, the distribution of values lied between 0.5 to 1.5 ml/l. Some regions have values 2.5 to 3 ml/l at the southeastern and southern corner of the Bay. At 200m depth most coastal areas had dissolved oxygen values at 0.5 ml/l. At 500m depth the values lie between less than .5 to 1ml/l. At 1000m depth, the values mostly 1ml/l. At the eastern and western Bay, some regions appeared to be 1.5 ml/l. At 2000m depth, the values lied between 3 to 1.5 ml/l. At the northern and mid bay values ranges from 3 to 2.5 ml/l and at southern bay values ranges from 2 to 1.5 ml/l (Figure 4).
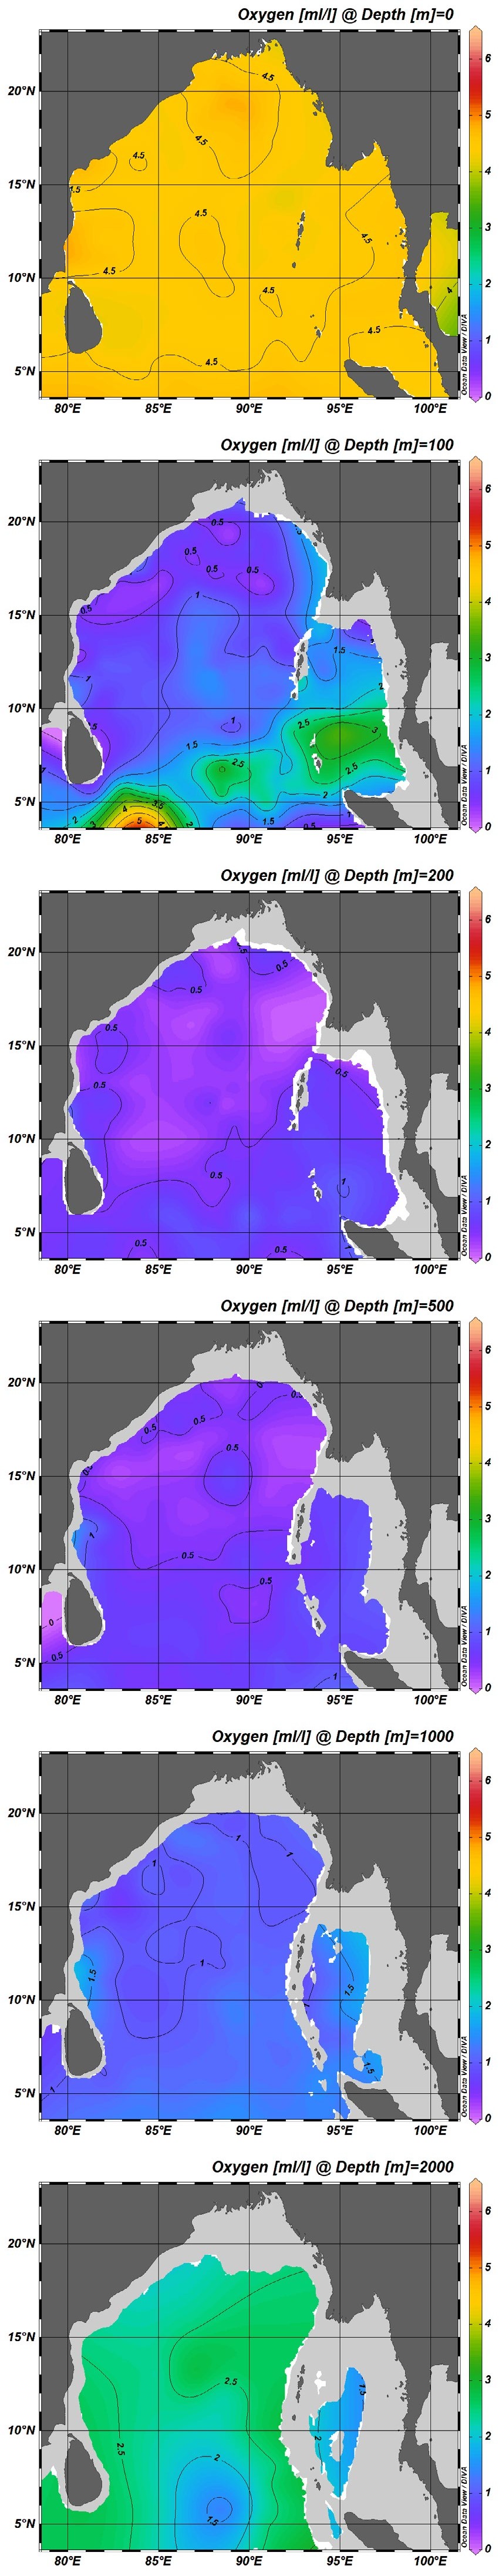
During winter (October to February), the surface values mostly lied at 4.5 ml/l. Some spots appeared to be around 5 ml/l at the north and northeastern part (Figure 5). At 100m depth, values ranged from .5 to 2.5 ml/l. At 200m depth, a large part of bay had values less than 0.5 ml/l and at the southern part value was mostly 0.5 m to 1 ml/l. At 200m depth, the values found to varied from 0 to 0.5 ml/l. The values at 500m depth ranges 0.5 to 1 ml/l. 1ml/l appeared to be at southern Bay. At 1000m depth values mostly lied between 1 to 1.5 ml/l. At 2000m depth values ranged from 2.5 to 3 ml/l.
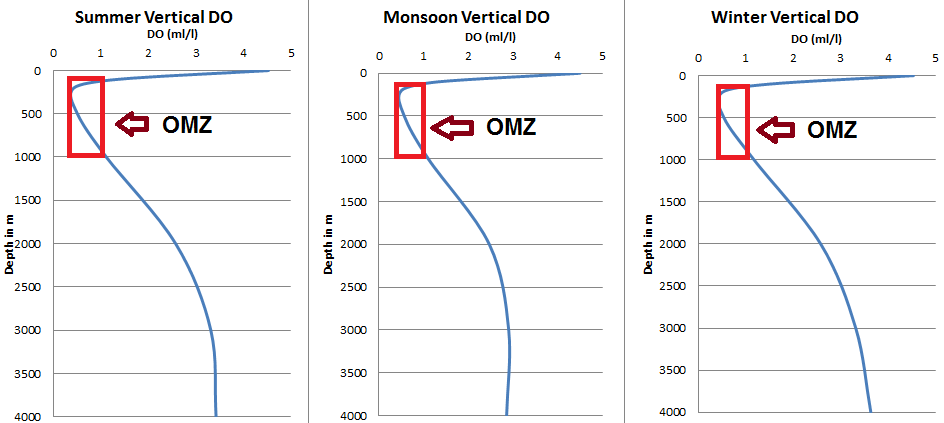
Latitidal section plots of the dissolved oxygen showed midlayer scarcity of oxygen through out the year but monsoon in the shallower areas (20ᴼN and 15ᴼN), whereas the deeper areas usually showed higher concentrations (Figure 6).
Monsoon higher concentrations were observed in all for sections due to storm season and frequent cyclone genesis in the area. Deeper areas of 10ᴼN and 5ᴼN sections were possessing higher concentration due to higher exposure oceanic current system.
A threshold value for hypoxia often used for estuaries and shallow coastal waters is 60 μmol kg -1 (approximately 1.5 ml l -1 or 2 mg l -1) [4], and areas with oxygen concentrations below this level are commonly referred to as ‘dead zones’. In the open ocean, oxygen minimum zones defined as areas where subthermocline dissolved oxygen levels are 20 μmol kg -1 (< 0.5 ml l -1), although many species experience limitation at higher oxygen values [9].
During summer period, along 20ᴼN latitude, at northeastern and northwestern Bay along continental slope, dissolved oxygen (DO) values found to be 0 ml/l between 250-500m depth. Along 15ᴼN latitude, oxygen minimum zones are found at 200-400m extent at mid regions. At 10ᴼN latitude, around 200-300m depth, values found as less than 0.5 at and at surface 1 ml/l; both at western side of the Bay. At monsoon period, OMZ are found along the 10ᴼN at mid regions, where values 0.5 ml/l or less between 200-500m depth. At winter period, along 20ᴼN between 150-400m depth values found to be 0 at eastern continental slope and values 0 between 150-250m at western continental slope. Along 15ᴼN values found to be 0 at mid-region between 250-500m depth. OMZ also found along 10ᴼN latitude along western continental slope as values less than 0.5 ml/l.
OMZs are mostly found in the 200-500m depth. At mid water depth, it is explained as the cause for OMZ formation due to the enhancement of oxygen consumption caused by aerobic decomposition of sinking particulate organic matter (POM) [3].
Conclusion
Monitoring the ecosystem health is crucial compliance to keep the habitat healthy and without this sustainable development would not be possible. Using our seas for human welfare as well as for other marine lives depends on some vital ecological indicators. Dissolved oxygen is one of such main indicator. As authors discussed above, the Bay of Bengal possess such a unique geological setting with monsoon climate and heavy sediment influx – making the area lack of open circulation hence the decrease of oxygen level is more prominent. So, it is necessary to continuous monitoring of the DO and OMZs for sustainability of the marine environment of the Bay of Bengal.
References
-
Garrison LP (2007) Interactions between marine mammals and pelagic longline fishing gear in the U.S. Atlantic Ocean between 1992 and 2004. Fishery Bulletin 105(3): 408-417.
-
Isensee K, Levin LA, Breitburg S, Gregoire M, Garcon V, et al. (2015) The Ocean is Losing its Breath. ocean-climate. org.
-
IPCC-Field CB, Barros VR, Mach K, Mastrandrea M (2014) Climate Change: Impacts, Adaptation, and Vulnerability. Contribution of Working Group II to the Fifth Assessment Report of the Intergovernmental Panel on Climate Change, Cambridge University Press, USA.
-
Gray JS, Rudolf SW, Or YY (2002) Effects of hypoxia and organic enrichment on the coastal marine environment. Marine Ecology Progress Series 238: 249-279.
-
Vaquer-Sunyer R, Duarte CM (2008) Thresholds of Hypoxia for Marine Biodiversity. Proc Natl Acad Sci 105(40): 15452-15457.
-
Sarmiento JL, Gruber N (2006) Ocean Biogeochemical Dynamics, Princeton University Press.
-
Carrillo CJ, Smith RC, Karl DM (2004) Processes regulating oxygen and carbon dioxide in surface waters west of the Antarctic Peninsula. Marine Chemistry 84(3- 4): 161-179.
-
Diaz RJ, Rosenberg R (2008) Spreading Dead Zones and Consequences for Marine Ecosystems. Science 321(5891): 926-929.
-
Gilly WF, Beman JM, Litvin SY, Robison BH (2013) Oceanographic and Biological Effects of Shoaling of the Oxygen Minimum Zone. Ann Rev Mar Sci 5: 393-420.
- Genetic Improvement of Nile Tilapia (Oreochromis niloticus): Advances in Selective Breeding and Genomic Approaches for Sustainable Aquaculture
- Microplastics, Contaminants, and Waste Hotspots: Divergences and Faults in Prioritizing Control Efforts
- Creating a Healthier, More Vibrant Open and Closed Aquatic Environment. A Submersible, Centrifugal Magnetically Affixed Current Changing Aquarium Pump
- An Attempt to Assess Alpha Diversity and Sample Size: Using the Ostracod Assemblages off Kumamoto Port, Japan
- Assessment of the Efficiency of Common Fishing Gears and Crafts Used at Mohananda River of Chapai Nawabganj, Bangladesh
- Fish Productivity and Biodiversity Status of Sundarban Mangrove in Bangladesh