Oil Spills and Remote Sensing Monitoring Challenges
This article has illustrated a handful of other concepts in addition to oil spills. This study investigated the harm caused by oil spills in a region, as well as the consequences of oil exploration and extraction on the environment, economy, and politics. The concept of oil spills, their causes, their different types, and the impacts of these calamities on the marine ecosystem are all covered in detail in this review. Oil spill management and response are essential for the environment and society. This review also provides basic information on monitoring oil spills from space. Optical and microwave remote sensing techniques have been used to address oil spill monitoring issues. The possibility of false alarms from lookalikes is the main problem when using radar and microwave data to monitor an oil spill. Therefore, numerous issues must be addressed to detect oil spills in space. It is crucial to combine these technologies with additional approaches such as in situ measurements and ground-based observations.
What is the Meaning of an Oil Spill?
What exactly are oils? In line with the basic definition, oil is an organic compound that is soluble or not readily soluble in water, but easily soluble in water. It may be both a petroleum-based product and a non-petroleum product; each category includes a variety of different oils. Oil spills are a type of pollution that occurs when liquid petroleum hydrocarbons are released into the environment as a result of human activity. A hydrocarbon is an organic compound in organic chemistry that is made entirely of hydrogen and carbon. Hydrocarbons are functional groups composed of hydrocarbons that have one hydrogen atom removed [1].
The different types of hydrocarbons include alkenes, cycloalkanes, aromatic hydrocarbons (arenes), and alkyne- based compounds. The majority of hydrocarbons found in nature are found in crude oil, where abundant amounts of carbon and hydrogen from decomposed organic matter can bond to form seemingly endless chains [2, 3, 4, 5, 6, 7, 8, 9, 10, 11, 12, 13, 14, 15, 16, 17, 18, 19, 20, 21, 22, 23, 24, 25].
An oil spill occurs when oil, whether accidentally released or intentionally, floats as a discrete mass on the surface of bodies of water and is carried by the wind, currents, and tides. Chemical dispersion, combustion, mechanical containment, and adsorption can help control oil spills to a certain extent. They harm coastal ecosystems in negative ways [2, 3, 4].
This term is frequently used to describe marine oil spills, in which oil is released into the sea or nearby waters. Crude oil releases from tankers, offshore platforms, drilling rigs, and wells are considered oil spills, along with the spills of refined petroleum products (such as gasoline and diesel) and their byproducts, heavier fuels used by large ships (such as bunker fuel), and any oily waste or refuse. Cleaning spills can take months or even years. Natural oil seeps are another source of oil that enters the marine environment. The focus of public concern and regulation has typically been on seagoing oil tankers [1, 2, 3, 4, 5].
Sources of Oil Spill
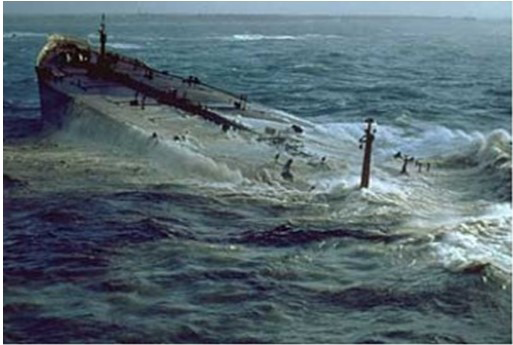
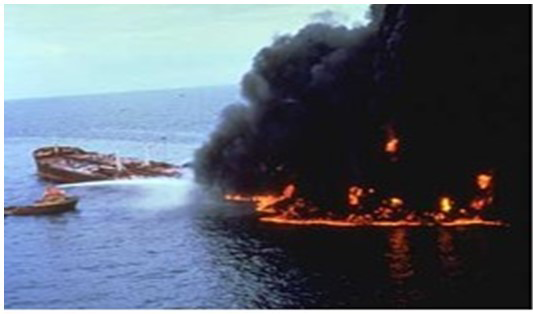
The most visible sources of oil pollution in the marine environment are operational oil discharges and spills from ships, particularly tankers, offshore platforms, and pipelines. Consider the Amoco Cadiz oil tanker as an example Figure 1. In 1978, this tanker ran aground off the French coast, causing 68.7 million gallons of oil. Large spills such as these are unusual. Additionally, an oil transfer accident caused the oil tanker Mega-Borg Figure 2 to spill 5.1 million gallons of oil [1, 7].
![Figure 1: In 1978, this tanker ran aground off the French coast, causing 68.7 million gallons of oil. Large spills such as these are unusual. Additionally, an oil transfer accident caused the oil tanker Mega-Borg Figure 2 to spill 5.1 million gallons of oil [1,7].](/fulltextimages/9934/fig_1.png)
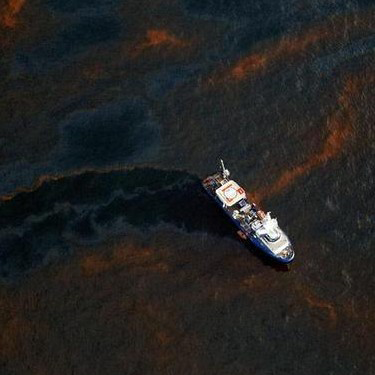
Ixtox 1 exploration well blowout in 1979 in 1980, when workers were able to stop the blowout, 140 million gallons of oil were estimated to have leaked into the ocean Figure 3.
Only the intentional oil spills that ended the Kuwait-Iraq War in 1991 were smaller than this, making it the second-largest spill in history Figures 4,5. In fact, during times of conflict, one nation may choose to pour tons of oil into the oceans of the opposing nation [1, 4, 7, 8].
![Figure 3: Only the intentional oil spills that ended the Kuwait-Iraq War in 1991 were smaller than this, making it the second-largest spill in history Figures 4,5. In fact, during times of conflict, one nation may choose to pour tons of oil into the oceans of the opposing nation [1,4,7,8].](/fulltextimages/9934/fig_3.png)
The unintentional or intentional release of petroleum products into the environment as a result of human activity is the most prevalent type of oil spill. Examples include well blowouts, pipeline breaks, ship collisions or groundings, ship bilge pumping and overfilling of gas tanks, leaking underground storage tanks, and oil-contaminated water runoff from streets and parking lots during rainstorms [1, 6, 7].
Because they do not want to spend money on waste oil decomposition, illegal dumpers dump crude oil into the oceans. They will illegally dump oil into the oceans because they will not spend money to break up (decompose) the oil Figure 5.
Even natural catastrophes (like hurricanes) can result in oil spills. A hurricane can cause the oil tanker to tip over and spill oil if it is only a few miles away. The largest unintentional oil spill in history, the massive Ixtoc I blowout, resulted in 1979, the year of the closest call. Between June 1979 and March 1980, the catastrophe released three million barrels (126 million gallons) of oil into the southern Gulf of Mexico Figure 6. On September 16 and 17, Category 1 Hurricane Henri passed north of the main area of the oil spill, producing 15-feet seas and southwest winds of 15 to 25 knots over the spill region on September 16. Strangely, the NOAA/AOML report on spills discovered that there was no wind [1, 7, 9].
![Figure 6: On September 16 and 17, Category 1 Hurricane Henri passed north of the main area of the oil spill, producing 15-feet seas and southwest winds of 15 to 25 knots over the spill region on September 16. Strangely, the NOAA/AOML report on spills discovered that there was no wind [1,7,9].](/fulltextimages/9934/fig_6.png)
Oil spills on ocean surfaces are generally observed fairly frequently. Oil spills have been observed to occur frequently in connection with offshore installations and are strongly associated with major shipping lanes (e.g., in Southeast Asian waters, the Yellow and East China Seas, and the North Sea). In this regard, fuel accounts for 48% and crude oil accounts for
29% of oil pollution in the oceans. Tanker accidents account for only 5% of all the pollutants entering the ocean. Oil spills, on the other hand, occur much more frequently than those associated with reported ship accidents [1, 5, 7, 9].
Oil Spill Types
Crude oil and its products are complex mixtures. Understanding the fate of petroleum when it is spilled on water requires a basic understanding of its major components and types because the fate of petroleum in the marine environment depends on its composition. The following factors make up the approximate composition of crude oil [1, 7, 10]:
Normal Type: 30% gasoline (C5-C10); 10% kerosene (C10-C12); 15% light distillate oil (C12-C2 0), 25% heavy distillate oil (C20-C4 0), and 20% residual oil (>C40) [1, 7, 12].
By molecular type: Paraffin (alkanes), 30%; naphthenes (cycloalkanes), 50% aromatics, 15% nitrogen, sulfur, and oxygen-containing compounds (NSO), 5% [1, 9, 11].
Oil Spill Characteristics
The physical and chemical characteristics of the spilled oil, as well as the environmental circumstances at the spill site, determine how well different oil spill response strategies work. Oil recovery operations are directly affected by changes in the physical and chemical properties of oil. They have an impact on the technologies, and response strategies were chosen for cleanup, as well as their efficiency and capacity, which can have an impact on the duration and expense of operations, as well as the effects on the environment [2, 4, 7].
Soon after oil is spilled into the sea, physical and chemical processes begin to occur. These include sea-air exchange, dissolution, emulsification, spreading, and sedimentation. The presence of sunlight also stimulates the chemical oxidation of petroleum constituents. The byproducts of these processes include materials deposited on the bed, dissolved and particulate hydrocarbon materials in the water column, and floating tar lumps [1, 11].
Although they move slowly, chemical and physical processes coexist with biological processes. These crucial biological processes include uptake by large organisms and subsequent metabolism, storage, and discharge, as well as degradation by microorganisms to carbon dioxide or organic material in intermediate oxidation stages. Such metabolic processes are essential for global cycling of elements, with no net production or loss [8, 9, 10, 11, 12].
Oil Spill Behaviour in Marine Environments
The environmental impact of an oil spill depends on its speed of spread. The majority of oils have the propensity to spread horizontally, leaving a “slick”—a smooth and slick surface—on top of the water. Surface tension, specific gravity, and viscosity influence the spread of oil spills. The degree of attraction between the surface molecules of a liquid is measured by surface tension. The likelihood that an oil spill will continue to increase with the surface tension of oil. Even without the aid of wind and water currents, oil spreads if its surface tension is low. Oil is more likely to spread in warmer waters than in extremely cold waters, because increased temperatures can reduce the surface tension of a liquid [1, 13].
The density of a substance, compared to the density of water, is known as its specific gravity. Most oils float on top of water because they are lighter than water. However, if the lighter components of oil evaporate, the specific gravity of the oil spill may increase. Animal fats, vegetable oils, and heavier oils may interact with sediments or rocks at the bottom of water bodies, sinks, and tar balls. The viscosity of the liquid’s flow resistance was measured. The tendency of oil to settle in one place increases with viscosity [1, 7, 13, 14].
Spreading: The most crucial procedure after a spill is likely to spread the crude oil to water. In addition to the chemical makeup of oil, wind, waves, and currents also affect how far it spreads. The oil spreads quickly under the influence of hydrostatic and surface forces, achieving an average thickness of less than 0.03 mm Figure 7 in less than 24 hours. The oil layer is no longer continuous and uniform after a spill thins to the point where surface forces start to matter; instead, they are broken up by wind and waves into islands, where thicker layers of oil are in equilibrium with thinner films rich in surface-active compounds [1, 13, 15].
Evaporation: When petroleum crude is spilled into water, the main processes that cause degradation are evaporation and dissolution. The evaporation rates of hydrocarbons are influenced by the chemical makeup of oil, its surface area and physical characteristics, wind speed, air and water temperatures, turbulence, and solar radiation intensity. Approximately 50% of the hydrocarbons in “average” crude oil will be removed from the ocean surface by evaporation alone. As volatile hydrocarbons are lost, the oil becomes denser and more viscous. The viscosity of the resulting oil increased as more volatile hydrocarbons were lost, which caused the slick to fragment into smaller patches. Because of their larger surface area, agitation of these patches improves the incorporation of water [7, 14, 16].
Photo-oxidation: Numerous petroleum hydrocarbons can be converted by natural sunlight and oxygen into hydroxy compounds, such as aldehydes and ketones, which can then be converted into low-molecular-weight carboxylic acids. Because the products are hydrophilic, they alter the solubility behaviour [1, 2, 3, 4, 5, 6, 7].
Dispersion: Small globules of oil are incorporated into the water column to form dispersion, which is an oil-in- water emulsion. When oil comes into contact with water, it immediately starts to dissperse, and the first ten hours or so is when it is most noticeable.
Dissolution: Low-molecular-weight hydrocarbons and polar non-hydrocarbons are partially lost from oil to the water column through the physical process of dissolution [7, 17].
Degradation: Microbial degradation, zooplankton ingestion, aquatic invertebrate and vertebrate uptake, and bio-turbidity are all bio-degradative processes that influence the fate of petroleum in aquatic environments. Microorganisms capable of oxidizing petroleum hydrocarbons and related compounds are widespread. The rate of microbial degradation varies with the chemical complexity of the crude extract, microbial populations, and environmental conditions [1, 14, 16, 18].
Effects of Petroleum Crude on Marine Bio- System
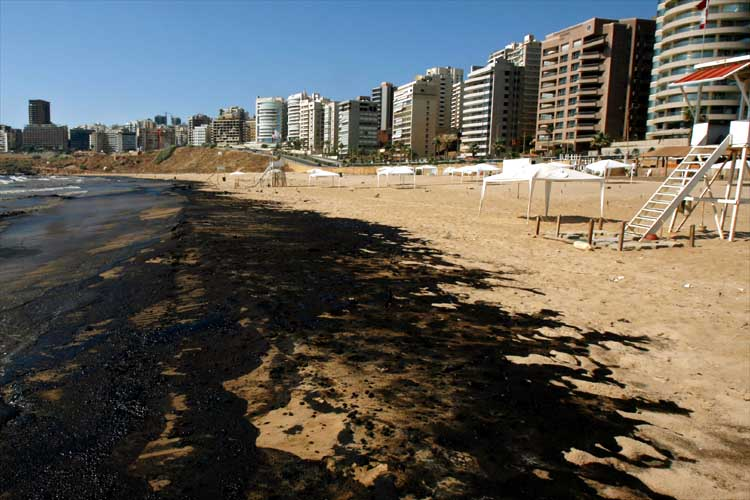
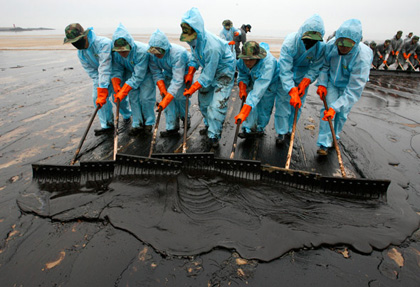
Oil spills play a significant role in the destruction of marine ecosystems Figure 8, having an impact on both surface resources and a variety of subsurface organisms that are connected in a complex food chain that includes sources of food for humans. Spilled oil can harm the environment in several ways, including physical damage that directly impacts wildlife and their habitats (e.g., coating birds or mammals with a layer of oil) and the toxicity of the oil itself, which can poison exposed organisms Figure 9. Additionally, oil spills can disrupt food chains by introducing toxins that accumulate in organisms and then transfer them to their predators when they consume contaminated prey [1, 7, 14].
![Figure 9: Additionally, oil spills can disrupt food chains by introducing toxins that accumulate in organisms and then transfer them to their predators when they consume contaminated prey [1,7,14].](/fulltextimages/9934/fig_9.png)
![Figure 10: The oil spill reduces the amount of sunlight that reaches the water, which restricts the number of marine plants and phytoplankton photosynthesis. Additionally, studies on marine mammals have revealed that oil spills reduce their insulating capacities, making them more susceptible to temperature changes and significantly less buoyant in the sea. In this view, the fur of oil-coated sea otters’ and seals’ reduces their ability to act as insulation, causing body temperature fluctuations when the animal’s body temperature is significantly lower than normal. Consumption of oil results in dehydration and impairs judgment. Furthermore, oil spills can affect fish and other marine species by reducing their access to oxygen and the dissolved oxygen content in the water [14-18].](/fulltextimages/9934/fig_10.png)
The food chain of marine ecosystems is impacted by floating oil spills, declining faunal populations, and other factors Figure 10. The oil spill reduces the amount of sunlight that reaches the water, which restricts the number of marine plants and phytoplankton photosynthesis. Additionally, studies on marine mammals have revealed that oil spills reduce their insulating capacities, making them more susceptible to temperature changes and significantly less buoyant in the sea. In this view, the fur of oil-coated sea otters’ and seals’ reduces their ability to act as insulation, causing body temperature fluctuations when the animal’s body temperature is significantly lower than normal. Consumption of oil results in dehydration and impairs judgment. Furthermore, oil spills can affect fish and other marine species by reducing their access to oxygen and the dissolved oxygen content in the water [14, 15, 16, 17, 18].
![Figure 11: Setting priorities for pollution protection is the first action to be taken in the event of marine oil pollution. In this sense, more than 75% of the sea pollution is man-made. Fuels contribute to approximately 48 % of the annual oil pollution in the oceans, crude oil to 29%, and tanker accidents to 5% [1-7].](/fulltextimages/9934/fig_11.png)
Oil Spill Impact on Political and Scientific Concerns
Because oil spill pollution has detrimental effects on delicate maritime and coastal ecologies, it has raised political and scientific concerns. For instance, the Obama administration announced that it would move quickly to release new safety requirements that would allow the reopening of offshore oil and gas exploration in shallow waters in response to growing resentment on the Gulf Coast over the loss of jobs and income caused by a drilling moratorium. Politicians and the families of Gulf region oil platform workers who face layoffs as a result of the moratorium are putting tremendous pressure on the White House, putting the administration in a catch-22 situation where the region is losing jobs and tourism as a result of the spill but cannot afford another spill any longer [1, 5, 7].
The quantity of pollutant discharge and their corresponding effects on the marine environment are important factors in assessing seawater quality. Numerous activities related to exploitation, extraction, transportation, and disposal can result in oil pollution and spills Figure 11. Setting priorities for pollution protection is the first action to be taken in the event of marine oil pollution. In this sense, more than 75% of the sea pollution is man-made. Fuels contribute to approximately 48 % of the annual oil pollution in the oceans, crude oil to 29%, and tanker accidents to 5% [1, 2, 3, 4, 5, 6, 7].
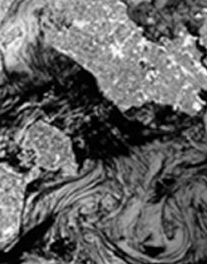
![Figure 12: As an alternative, the main methods for observing oil pollution in the ocean are aircraft and satellites [1,3,16,18].](/fulltextimages/9934/fig_12.png)
Problem of Technical Methods for Oil Spill Detection
Recent advancements in remote sensing technology have made them an important tool for surveying and detecting marine pollution, which helps better detect oil spills. Ships, aircraft, and satellites are among the many tools available for detecting and monitorinsg oil spills. When ships are outfitted with navigation radars, they can detect oil spills at sea, for example, in restricted areas of (2500 m × 2500 m) Figure 12. As an alternative, the main methods for observing oil pollution in the ocean are aircraft and satellites [1, 3, 16, 18].
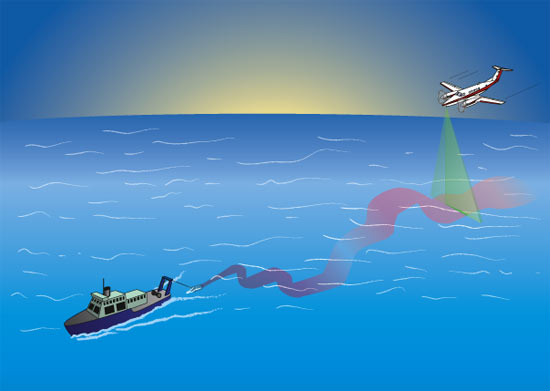
Fluorescent lidar Figure 13 has recently received attention from scientists and researchers as a promising method for locating oil spills because of its high active performance capacity and ability to distinguish oil from nearby biological materials and marine environments. In this sense, the fluorescence production spectrum of most organic multiparty compounds exhibits individuality. Therefore, fluorescence emission is a reliable indicator of oil presence. However, the vast majority of complex systems found on large aircraft are rarely employed as equipment to clean up oil pollution [1, 16, 18, 26].
Therefore, synthetic-aperture radar is the most practical space-based sensor for the detection of oil spills. SAR sensors operate in all types of weather and offer 24/7 detection coverage. SAR satellite data can also operate at wind speeds of up to 12–14 m/s depending on the type and age of the oil and can penetrate cloud cover owing to its independence from solar radiation. It has been discovered that SAR sensors working in wide strip modes with a resolution of 50–150 m are effective and satisfactory for covering sizable ocean areas [12, 13, 14, 15, 16, 17, 18].
The vast environmental harm caused to the maritime environment by oil slicks, which has significantly worsened pollution effects, has drawn the attention of the majority of scientists. Oil slicks are monitored and managed using space-borne SAR images; however, the main difficulties arise from the inability to distinguish an oil spill from a lookalike. because both appear in the SAR data as dark patches. Darker areas can be seen in SAR imagery because the presence of an oil layer on the sea surface dampens small waves, increases the thickness of the top film, and significantly reduces the measured backscattering energy [1, 2, 3, 4, 5, 6, 7, 8, 9].
Problem Statement for Space-Based Oil Spill Detection
Oil leaks or spills into waterways and the ocean spreads quickly owing to the influence of ocean dynamics. There is no single aspect of marine and coastal environments that is unaffected by an oil spill incident. The damage from this spill will be more severe the closer it happens to the shoreline because areas near the coast are home to more diverse populations of marine, bird, and animal life than regions far from the sea. It is important to keep in mind that one gallon of oil can produce an oil slick of several hundred acres in size. To describe a suitable solution, it is essential to study the behavior and movement of these oil spills in the sea. It is difficult to develop a fully automated oil spill detection tool because of the inherent complexity of differentiating between oil spills and their lookalikes using SAR satellite data. Consequently, an automatic algorithm with a trustworthy oil spill confidence estimator would be highly desirable. The need for automatic algorithms depends primarily on the volume of images to be analyzed; however, they are more affordable than manual inspection for monitoring vast ocean areas. The three stages of automatic oil spill detection algorithms are dark spot detection, dark spot feature extraction, and dark spot classification [1, 2, 3, 4, 5, 6, 7, 8, 9, 10].
Forecasting oil spill trajectory patterns (e.g., movement and spreading) is one of the most difficult problems in combating and managing oil slicks. In general, the main idea behind predicting the behavior of oil slicks is to determine the slick’s time-evolving shape under different weather patterns in water with currents. Wind direction and speed are the most important climate parameters that can affect oil spill imagery in SAR data. Models for oil slick behavior are significant in environmental engineering and are used as decision support tools in environmental emergency responses. These models are used to help ships avoid oil slicks [1, 17].
The Significance of Tracking and Monitoring Oil Spills
To ensure thorough cleaning of coastal zones Figure 14, standard procedures are needed for oil spill detection from multiple SAR data sources. For effective coastal management to prevent harm to marine ecosystems, quick information on the pollutants present in the sea is essential. The development of coastal tourism Figure 15 also requires the participation of numerous parties, including locals, policymakers, and the scientific community [1, 7, 10].
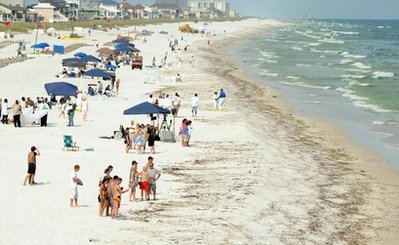
![Figure 16: Since tourism is one of the main sources of income in this situation, these issues may have an impact [1,5,8,11].](/fulltextimages/9934/fig_16.png)
The design of tourist and support facilities, such as hotels and recreational areas, is significantly influenced by the regulations and policies policymakers issue. Microwave radar data can be used to provide precise information for designers to create these sites. The decision must be made more comprehensible by policymakers and involving scientists. The role of the scientific community has become even more important because of its capacity to provide logical ideas through research and development activities. Environmentalists and engineers are in charge of developing new technologies that could enhance human life in coastal regions that are vulnerable to pollution from oil spills and issues with household and industrial waste experienced by many nations, which causes significant harm along these coastal zones Figure 16. Since tourism is one of the main sources of income in this situation, these issues may have an impact [1, 5, 8, 11].
More consideration needs to be given to human activities, because they are one of the factors contributing to environmental issues. The unchecked construction of substantial infrastructure such as jetties, resorts, and airports may also contribute to the ecological destruction of an island. Since tourism is one of the main sources of income for many nations, the government of the country is required to educate the locals in the coastal region by giving them access to enabling regulations that may improve clean environmental policies that could promote tourism. This, in turn, will help the government of any nation to manage and balance the economic needs of the people while still maintaining a healthy environment.
Monitoring an Oil Spill with Optical Remote Sensing: Potential
Research on the utilization of remote sensing technology for oil spill pollution detection has been ongoing for over a decade. Optical and microwave sensors have been examined in several studies for oil spill detection and monitoring in coastal waters. Because of its wide coverage area and day and night all-weather capabilities, SAR deployed on satellites is now an essential instrument for oil spill monitoring. However, the majority of studies on airborne remote sensing methods have not been included. Although there have been a few attempts to use optical data, the main satellite or airborne data source primarily used for oil spill detection is microwave sensor [1, 7, 19].
The most popular remote-sensing technique is optical. Owing to their low cost and availability as commercial- off-the-shelf (COTS) items, cameras, both still and video, are widely used. Currently, affordable digital single-reflex (SLR) cameras and camcorders are readily available. In the visible range (between 400 and 700 nm), oil has a higher surface reflectance than water, but exhibits fewer general absorption tendencies. Oil lacks distinct spectral features in the visible range, giving the observer the impression that it is black, brown, or gray. The sheen appears silvery and reflects light in the blue spectrum. Because there is no characteristic information between 500 and 600 nm in the visible spectrum, oil has a single scattering albedo of 0.008, which is much lower than that of water (0.013) because of its low absorption tendency in the visible range. This low single- scattering albedo indicates the difference in light reflection between oil and water. In addition, the single scattering albedo of 0.008 suggests that the majority of incident light is reflected rather than absorbed by the oil, resulting in a much lower albedo than that of water. However, the use of the visible spectrum for oil detection is limited. However, it does provide an economical means of documenting spills and baseline data on shorelines or relative positions. Many instances of interference or false positives exist. Sun glint and wind slicks can be mistaken for oil slicks [7, 19].
The oil that is “optically thick” absorbs solar energy and releases it again as thermal energy, primarily in the
8–12 μm spectral range. Infrared images show that thick oil is hot, intermediate thicknesses are cool, and thin oil or sheen cannot be observed. The opposite was observed in the evening. Although the precise thicknesses at which these transitions occur are unknown, scientific evidence indicates that the minimum detectable layer occurs between 10 and 70 μm, and that the transition between the hot and cool layers occurs between 50 and 150 μm. Because of the difference in emissivity between oil (0.94-0.97) and water, when the oil and water are at the same actual temperature, the oil will appear to be cooler (0.98). The infrared temperature difference between oil and water can be used to detect oil spills, and the magnitude of this difference is correlated with the thickness of the layer [1, 16, 19].
Therefore, infrared sensors in the 8–12 μm range are now far more reliable and accurate than traditional infrared scanners. In this view, the “thermal infrared region,” with wavelengths between 8 and 12 μm, is where infrared remote sensing has most frequently been used. Mid-band IR system tests (3–5 μm) showed that these sensors may be useful. No spectral structure is present in this region, according to specific studies of thermal infrared radiation (812 μm). According to tests conducted on various infrared systems, spatial resolution is important, especially when oil is dispersed in patches. Emulsions may not always be visible in the infrared, too [16, 19].
However, recent research has demonstrated that the brightness of an oil slick in infrared imagery is not directly correlated with its thickness. Oil detection using infrared technology is not foolproof because there are many potential interferences. Future technologies will focus on the widespread use of infrared sensors. Thus, the use of infrared sensors alone does not guarantee accurate oil-thickness readings. Even in very thin layers (0.01 μm), oil is highly reflective of ultraviolet (UV) radiation. Thus, thin oil sheets can be mapped using ultraviolet sensors. It is a common practice to combine ultraviolet and infrared images to create a relative thickness map of oil slicks. Wind slicks, sun glint, and biogenic materials are just a few of the interferences or false positives that can affect the ultraviolet data. Since these interferences are frequently distinct from those seen for infrared sensing, the use of both IR and UV can offer a more conclusive sign of the presence of oil than either method alone. UV sensors are not frequently used in operational response modes and do not play a significant role unless they are used in conjunction with IR technologies [1, 7, 16, 19]. Because oil spills reflect UV light well even in thin layers, UV technology can be used to detect them. The UV instrument cannot be used at night, and biogenic material, wind slicks, and sun glints can result in false alarms in the UV data. A combination of IR and UV can provide a more accurate indication of oil, and can be used to estimate oil thickness because these interferences are frequently different from those for IR [15, 16, 19].
Consequently, the majority of oil-detection laser fluorosensors use a laser that operates in the ultraviolet range between 300 and 340 nm. A broad fluorescent return of organic matter exists at these excitation wavelengths, with its center at 420 nm. This fluorescence signal is referred to as Gelbstoff or yellow matter, and is simple to cancel. The chlorophyll produced a sharp peak at 685 nm. The typical range of oil fluorescence is between 400 and 650 nm, with peak intensities in the 480 nm range. Raman scattering is a phenomenon that occurs. Water molecules can absorb the incident laser pulse, returning the incident energy minus some rotational vibrational energy [7, 16, 19].
The Raman signal of water occurred at 344 nm when the incident wavelength was 308 nm (XeCl laser). It is useful for maintaining the wavelength calibration of the fluorosensor but has also been proposed as a way to estimate the oil thickness. This technique is by no means operational and would, in any case, only be used for very thin slices (between 1-10μm). The proposed use of the water Raman signal has great potential for accurately estimating the thickness of an oil slick [16, 19].
The Moderate-Resolution Imaging Spectroradiometer (MODIS) instrument may be used to track oil spills. MODIS has a broad spectral range and two bands with moderate resolutions of 250 m and 500 m. However, using multiple wavelengths can provide more information to determine the difference between oil spills and slicks caused by algal blooms. However, in tropical regions such as Malacca Straits, where there is a lot of cloud cover, MODIS data has many problems [16, 17, 18].
The use of hyperspectral sensors for oil spill monitoring has the potential to offer precise material identification and a more accurate assessment of oil spill abundance. A hyperspectral sensor with more than 200 wavelengths allows the exploitation of the spectral signature of oil and the differentiation of various oil types. This can reduce the frequency of false alarms caused by ocean features that resemble oil in terms of appearance and color [1, 19]. In this regard, a signature matching method based on airborne hyperspectral imaging is more precise than conventional techniques, where the analysis is based on a visual interpretation of the color of the oil and its appearance in the satellite image. Currently, there are no commercial hyperspectral sensors in the orbit. An example of a space- borne technology demonstrator launched in 2000 is the NASA EO-1 Hyperion hyperspectral sensor. However, its narrow swath width of only 7.5-100 km is its main disadvantage [17, 19].
Oil absorbs solar energy and releases some of it as thermal energy back into the atmosphere. This oil cannot be detected by IR sensors, which perceive thick oil slicks as hot and intermediate oil slicks as cool. A thick spill can appear cooler than the surrounding water at night, because it dissipates heat more quickly. Oil can quickly absorb and release thermal energy, whereas water exhibits a slower rate of heat absorption and release. Oil slicks can cool off more quickly than surrounding water, and IR sensors can detect this temperature difference. IR sensors are crucial tools for identifying the presence of oil slicks in water bodies [19].
The NOAA Advanced Very High-Resolution Radiometer (AVHRR) has visible and infrared sensors with early oil spill detection and monitoring capabilities. The oil spills of the 1991 Persian Gulf War were also investigated. The oil spills might not have a temperature signature that is noticeably different from that of the surrounding water at night, but the IR channel was able to detect thick and thin oil layers as well as the boundary between water and oil. Only under very favorable lighting and sea conditions were oil spills visible in the images [1, 19].
Another passive sensor is the MWR. The instrument is weather-insensitive because it detects only microwave radiation from the ocean in the centimeter to millimeter range. Oil slicks appear as bright objects on a darker sea because they emit microwave radiation that is stronger than that of water. Oil slicks can have strong surface-emissivity signatures. However, because determining the thickness of oil slicks requires a spatial resolution of tens to hundreds of meters, aircraft sensors are the most appropriate choice for this type of sensor for oil spill thickness monitoring [1, 7, 19]. Therefore, to examine different oil types and thicknesses, airborne (AMR-OS) and shipborne (K-band) MWRs were used. They discovered that while MWRs are useful for gauging spill volume and measuring thickness, their resolution is too coarse to produce precise results. Radiometer viability as a reliable tool for determining the slick thickness is uncertain.
Microwaves are frequently used to monitor remote- sensing ocean pollution. Owing to their ability to operate in any weather or daytime, they are frequently referred to as optical sensors. The focus of this study is on spaceborne instruments, but airborne side-looking airborne radar (SLAR) is another option. SAR has a greater range and resolution than SLAR, which is an older, but less expensive technology. Owing to its high cost and constrained coverage, airborne surveillance is less effective for wide-area monitoring [1, 19, 20].
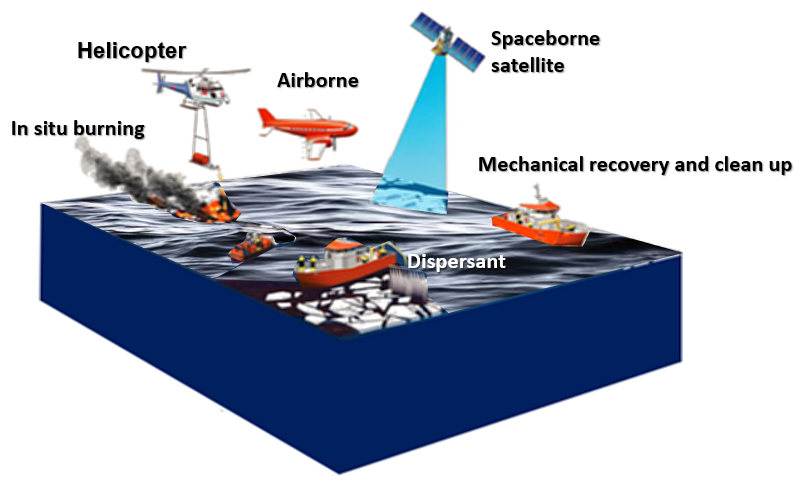
While aircraft are better suited to be used in action to identify the polluter, extent, and type of spill, space-borne SAR can be used as a first warning. An example is German aerial surveillance, which uses SLAR to detect oil discharges. Microwave radiometer (MWR) measurements of thickness, infrared/ultraviolet (IR/UV) scanning measurements of film extent, and laser-fluoro-sensor (LFS) measurements of the oil type are all used [15, 16, 17, 18, 19, 27].
Several studies on the monitoring and detection of oil spills have compared the SAR and optical sensors. For instance, SAR data had the lowest backscatter levels in regions with algal blooms, whereas SeaWiFS measured high levels of chlorophyll in these regions. Needless to say, different data sets could be used to distinguish between oil spills and look-alike phenomena like algal blooms [19, 20, 21, 22, 23, 24].
Potential of Radar and Microwave Techniques for Detecting Oil Spills
Oil on the sea surface dampens small capillary waves that occur naturally in clean seas. Capillary waves reflect radar energy, producing a “bright” area in radar imagery. The presence of an oil slick can be detected as a “dark” area or one that has an absence of sea clutter. Synthetic aperture radar (SARs) and side-looking airborne radar (SLARs) are the two primary types of radar used for environmental remote sensing and oil spill response. SLARs, despite being an older technology, are less expensive to purchase and use long antennas to improve the along-track resolution. SARs achieve along-track resolution using the forward motion of the sensor (an aircraft or spacecraft) to generate a very long antenna (which is range-independent). SAR signals require sophisticated electronic processing to extract the images. SARs are more expensive than SLARs but have a wider field of view and higher resolution. Comparative tests revealed that SAR is significantly better. Because they are designed to identify complex targets, search and rescue radar systems have little to no use in locating oil spills [14, 15, 16, 17, 18, 19].
Radar detection of oil slicks is limited by sea state; low sea states will not produce sufficient clutter in the surrounding sea to contrast with the oil, and very high seas will scatter radar sufficiently to block detection inside the troughs. Wind speeds of at least 1.5 m/s are required to allow detectability. Beyond this, wind speeds higher than 6 m/s will again remove the effect of an oil slick being distinguishable from the surrounding sea [19, 20, 21, 22].
Microwave radiation is emitted by the ocean. Because oil emits more microwave radiation than water, it appears as a “bright” area on a darker sea because oil is a stronger microwave emitter than water. Oil has a higher emissivity than water, which has a 0.4 emissivity factor. This difference in emissivity can be detected by a passive device, which can act as a method of oil detection. Theoretically, the device could be used to measure the thickness of a slick because there is also a change in the signal with thickness. This method is not effective [17, 19, 22].
The methodology is dependent on prior knowledge of a range of environmental and oil-specific parameters, and the signal return is periodically influenced by oil thickness. Any one of two or three film thicknesses can be inferred from the given signal strength for a specified slick. When the effective thickness is an odd multiple of a quarter wavelength of the observed energy, the microwave emission is the highest. Additionally, the signal-to-noise ratio was low and biogenic materials interfered. Achieving high spatial resolution is challenging [1, 19, 22]. As a result, passive microwave radiometry can be applied as a reliable all-weather oil sensor. However, its accuracy as a tool for measuring smoothness is questionable. Microwave radiometers are not currently used in many operational applications, and they may not be used in the future either [15, 16, 17, 18, 19, 20].
Look-Alikes Keystone Issue in SAR Data
This term frequently refers to an oil spill in the ocean. Oil spills into the sea or nearby waters. In particular, Oil spills are a type of pollution that occur when liquid petroleum hydrocarbons are released into the environment as a result of human activity. Crude oil, refined petroleum products (such as gasoline or diesel fuel), byproducts, ship bunkers, oily waste, and waste mixed with oil are some of the components that make up the oil. Removal of pollution from oil spills is challenging. Natural oil seeps are another source of oil that enters the marine environment. Although the majority of oil pollution caused by humans occurs on land, seagoing oil tankers have received the majority of public and regulatory attention. There are dark patches unrelated to the oil spill [18, 19, 20].
SAR satellite data are typically regarded as the most effective and superior satellite sensors for finding oil spills. However, oil spill thickness estimation and oil type identification cannot be performed using SAR data. The ability to distinguish between oil spills and lookalikes is the main issue when using SAR data for oil spill detection. In reality, both appear in the SAR data as dark patches. Natural dark patches are referred to as “oil slick look-alikes” in this context. Natural films and slicks, ice, threshold wind speed regions (wind speeds of 3 m/s), and wind protection from land, rain cells, shear zones, internal waves, and other phenomena are examples of look-alikes Figure 19. In a strict sense, an oil spill refers only to man-made slicks connected to crude petroleum and its products, such as heavy and light fuels [19, 20, 22].
Natural films are very difficult to distinguish from oil spills. Oil spills tend to remain more concentrated and, in turn, provide more dampening because of their higher viscosity compared to natural films. Natural films, on the other hand, are more often spread across a larger area owing to the low viscosity of their morphology.
Currently, SAR sensors cannot differentiate between various pollutants. However, for a large Sea Empress oil spill, there is a good correlation between the largest reduction in backscatter and the thickest oil, as determined by visual observations for a constrained range of wind speeds (5–6 m/s). This suggests that a single SAR frequency may not be sufficient to estimate the thickness of an oil spill. These experiences must be considered when selecting features to distinguish between oil spills and lookalikes. To distinguish between oil spills and look-alikes, physical, geometrical, and geographical parameters must be used, as well as significant characteristics such as wind speed [14, 15, 16, 17, 18, 19, 20, 21, 22].
Conclusion
Beyond oil spills, this paper demonstrates a variety of concepts and the effects of oil exploration and extraction on the environment, economy, and politics, as well as the effects of spill-related harm in a region. This chapter provides a thorough introduction to the meaning of oil spills, sources of oil spills, types of oil spills, and the effects of these natural disasters on marine ecosystems. The management and response to oil spills are crucial to the environment and society. As a result, this review study also offers fundamental knowledge about tracking oil spills from space. This is demonstrated with the help of optical and microwave remote-sensing technology.
The primary issue with using radar and microwave data to monitor oil spills is the possibility of false alarms from lookalikes. Consequently, a variety of issues must be resolved regarding the detection of oil spills from space. Combining these technologies with other strategies, such as in situ measurements and ground-based observations, is essential.
References
-
Wang Z, Fingas M, Page DS (1999) Oil Spill Identification. Journal of Chromatography A 843(1-2): 369-411.
-
Takeshita R, Bursian SJ, Colegrove KM, Collier TK, Deak K, et al. (2021) A Review of the Toxicology of Oil in Vertebrates: What we have learned following the Deepwater Horizon Oil Spill. Journal of Toxicology and Environmental Health, Part B 24(8): 355-394.
-
Little DI, Sheppard SR, Hulme D (2021) A perspective on Oil Spills: What we should have learned About Global Warming. Ocean & Coastal Management 2020: 105509.
-
Lourenço RA, Combi T, Da Rosa Alexandre M, Sasaki ST, Zanardi-Lamardo E, et al. (2020) Mysterious Oil Spill along Brazil’s Northeast and Southeast Seaboard (2019- 2020): Trying to find Answers and filling Data Gaps. Mar Pollut Bull 156: 111219.
-
Cheng H, Hu Y (2010) Lead (Pb) Isotopic Fingerprinting and its Applications in Lead Pollution Studies in China: A Review. Environmental pollution 158(5): 1134-1146.
-
Etkin DS (2001) Analysis of Oil Spill Trends in the United States and Worldwide. In: International Oil Spill Conference. American Petroleum Institute 2001(2): 1291-1300.
-
Fingas M (2000) The Basics of Oil Spill Cleanup. CRC press, United States.
-
Zhang W, Li C, Chen J, Wan Z, Shu Y, et al. (2021) Governance of Global Vessel-Source Marine Oil Spills: Characteristics and Refreshed Strategies. Ocean & Coastal Management 213: 105874.
-
Wang J, Zhou Y, Zhuang L, Shi L, Zhang S (2022) Study on the Critical Factors and Hot Spots of Crude Oil Tanker Accidents. Ocean & Coastal Management 217: 106010.
-
Stogiannidis E, Laane R (2015) Source Characterization of Polycyclic Aromatic Hydrocarbons by using their Molecular Indices: An Overview of Possibilities. Reviews of Environmental Contamination and Toxicology 2015: 49-133.
-
Hoang AT, Pham VV, Nguyen DN (2018) A report of oil Spill Recovery Technologies. International Journal of Applied Engineering Research 13(7): 4915-4928.
-
Reed M, Johansen Ø, Brandvik PJ, Daling P, Lewis A, et al. (1999) Oil Spill Modeling towards the Close of the 20th Century: Overview of the State of the Art. Spill Science & Technology Bulletin 5(1): 3-16.
-
Doerffer JW (2013) Oil Spill Response in the Marine Environment. In: 1st (Edn.), Elsevier, UK.
-
Fingas M (2010) Oil Spill Science and Technology. In: 1st (Edn.), Gulf professional publishing, UK.
-
Venkatesh S (1988) The Oil Spill Behaviour Model of the Canadian Atmospheric Environment Service part I: Theory and model Evaluation. Atmosphere-Ocean 26(1): 93-108.
-
Marghany M (2004) RADARSAT for oil spill trajectory model. Environmental Modelling & Software 19(5): 473- 483.
-
Marghany M (2019) Synthetic Aperture Radar Imaging Mechanism for Oil Spills. Gulf Professional Publishing, UK.
-
Marghany M (2019) Automatic Detection Algorithms of Oil Spill in Radar Images. In: 1st (Edn.), CRC Press, United States.
-
Marghany M (2002) Radarsat Lagrangian flow Effects on Oil Spill Spreading. In IEEE International Geoscience and Remote Sensing Symposium, IEEE, United States.
-
Brown CE, Fingas MF, Goodman RH (1998) Oil-Spill Remote Sensors: New tools that Provide Solutions to Old Problems. In: Arctic and Marine Oil Spill Program Technical Seminar. Environment Canada, Canada, 2: 783-
-
Otremba Z (2000) The Impact on the Reflectance in VIS of a Type of Crude Oil Film Floating on the Water Surface. Optics Express 7(3): 129-134.
-
Bello J, Eriksen P, Pocwiardowski P (2017) Oil Leak Detections with a Combined Telescopic Fluorescence Sensor and a Wide Band Multibeam Sonar. International Oil Spill Conference Proceedings, United States, 2017(1): 1559-1573.
-
Marghany M (2000) Finite Element Model of Residual Currents and Oil Spills Transport. In: IGARSS 2000-IEEE 2000 International Geoscience and Remote Sensing Symposium-Taking the Pulse of the Planet: The Role of Remote Sensing in Managing the Environment. IEEE, United States 7: 2966-2968.
-
Marghany M (2013) Genetic Algorithm for Oil Spill Automatic Detection from ENVISAT Satellite Data. In: Computational Science and Its Applications-ICCSA 2013-13th International Conference, Ho Chi Minh City, Vietnam, Part II. Springer, Germany, pp: 587-598.
-
Topouzelis KN (2008) Oil Spill Detection by SAR Images: Dark Formation Detection, Feature Extraction and Classification Algorithms. Sensors 8(10): 6642-6659.
-
Wang PL, Ma C, Yuan Q, Mai T, Ma MG (2022) Novel Ti3C2Tx MXene Wrapped Wood Sponges for Fast Cleanup of Crude Oil Spills by Outstanding Joule Heating and Photothermal Effect. J Colloid Interface Sci 606(Pt2): 971- 982.
-
Huang X, Zhang B, Perrie W, Lu Y, Wang C (2022) A Novel Deep Learning Method for Marine Oil Spill Detection from Satellite Synthetic Aperture Radar Imagery. Mar Pollut Bull 179: 113666.
- Genetic Improvement of Nile Tilapia (Oreochromis niloticus): Advances in Selective Breeding and Genomic Approaches for Sustainable Aquaculture
- Microplastics, Contaminants, and Waste Hotspots: Divergences and Faults in Prioritizing Control Efforts
- Creating a Healthier, More Vibrant Open and Closed Aquatic Environment. A Submersible, Centrifugal Magnetically Affixed Current Changing Aquarium Pump
- An Attempt to Assess Alpha Diversity and Sample Size: Using the Ostracod Assemblages off Kumamoto Port, Japan
- Assessment of the Efficiency of Common Fishing Gears and Crafts Used at Mohananda River of Chapai Nawabganj, Bangladesh
- Fish Productivity and Biodiversity Status of Sundarban Mangrove in Bangladesh