Analysis of Molecular Genetic, Morphometric and Sexual Characteristics of the Beluga (Huso huso L., 1758) Grown in the Aquaculture of the Republic of Belarus
The subject of the study was genetic and phenotypic characteristics of Beluga (Huso huso (Linnaeus, 1758)) grown in the warm and cold-waters aquaculture at the “Selets” fish farm (the Republic of Belarus). Molecular-genetic analysis was performed using STR-markers and species-specific PCR revealed the absence of hybrid individuals in analyzed broodstock of (Huso huso L.). Affiliation of individuals to the Caspian population was established based on the sequence analysis of the 367 bp region of mitochondrial D-loop. Using six STR loci, the population structure was analysed. The population structure and gene pool of the only broodstock of (Huso huso L.) in Belarus was compared with domesticated (H. huso L.) from the Russian Federation. The analysis showed a lack of genetic variation and the heterozygote excess in Beluga from the Belarusian farm. Analysis of morphometric indicators revealed that the conditions in which the Beluga broodstock is kept at the fish farm “Selets” should be improved. Using ultrasound scanning, the following stages of gonad maturity were established: stages II, III and IV in males; II, II semi-fatty, II fatty, III and IV in females. The Beluga broodstock at the fish farm “Selets” is mainly represented by females (the females exceeded the males by 1.6 times in terms of their number).
Introduction
The Beluga (Huso huso (Linnaeus, 1758)), as well as a number of other sturgeon species (Acipenseridae), are on the IUCN Red List as critically endangered species. It is also listed in Appendix II of CITES due to a catastrophic decline in the natural population size [1, 2]. The beluga (Huso huso L.) is also included on numerous regional Red Lists: The Red Books of Russia, of Ukraine, the Red Data Book of Bulgaria and etc. [3, 4, 5]. As it is considered, a decline in the wild Beluga number is on the score of illegal fishing, the natural habitat destruction and due to the construction of dams on its spawning migration routes. The last time the Beluga (Huso huso L.) was registered on the territory of Belarus was in the River Sozh (Gomel Region) in 1907, but now it is hardly possible, since its migration pathways are blocked by the dams of the Dnieper HPP (hydropower plants) cascade. Therefore, the only way to preserve the gene pool of this valuable species of anadromous sturgeon is to create domesticated Beluga broodstock in aquaculture, improve artificial reproduction methods and obtain a sufficient amount of high-quality fish stock.
In order to expand the range of fish products, Beluga fry with an average weight of 5 grams was imported in Belarus in 2008 from Rostov Region, Russia. Before 2020, the only replacement broodstock of Beluga was formed at the fish farm “Selets” (Brest Region, Belarus), but its species purity and population identity remained unknown by the scientific community.
The comprehensive study of the molecular genetic, morphometric and sexual characteristics of the Beluga broodstock presented in the article is an innovative approach in aquaculture, allowing one to obtain not only theoretical knowledge about the biology of sturgeon, but also to use it in practice to improve the biotechnology of reproduction and selection of valuable sturgeon species.
Materials and Methods
The Object of Research: 118 sixteen-year-old (Huso huso L.) grown in in warm and cold-water aquaculture. Genetic study was carried out on 118 Beluga broodstock specimens. DNA was extracted by the phenol-chloroform method from the pectoral fin fragments collected in 2019-2020 and fixed by 96% ethanol (tissue/ethanol proportion up to 1:5 by volume). Tissue collecting was followed by individual specimen chipping depending on their sex and reproductive quality with tapes (for immature specimens and part of males), and/or electronic tags from Hallprint (Australia). The individual identification number was assigned to each sample and the corresponding mark number was registered. Several molecular tools were used for the aquaculture broodstock management: 1) a species-specific nuclear tool based on a panel of STR loci (An20, AoxD161, AoxD165, AfuG41, Aox23, Spl106) for beluga identification, species purity verification and affinity analysis (Table 1); 2) species purity (hybrid presence analysis) was tested by 3 methods: 4 STR marker analysis (An20, AoxD161, AoxD165, AfuG41) (Table 2), detection of Beluga-specific SNP in the 2nd intron of the nuclear ribosomal protein S6 (RP2S6) and detection of two species-specific SNP positions for the Beluga and Sterlet used as specific binding sites for diagnostic primers; 3) sequencing of the 367 bp control region of mitochondrial D-loop for population assignment. STR marker analysis was conducted with the primers listed in Table 1 [6, 7, 8]. Fragment analysis was conducted using AppliedBiosystems 3500 GeneticAnalyzer. Allele lengths were identified using GeneMarker 5. The specific statistical parameters (Tables 3 & 4) were estimated using specialized macro GenAIEx v.6.5.
For H. huso X A. ruthenus hybrid presence testing, the method published by Havelka et al., 2017 was used [9]. The multiplex HH/AR positive primer mix contained 153_ uni, 247_uni, 153_HHp, 247_ARp primers and the HH/AR negative primer mix contained 153_uni, 247_uni, 153_HHn, 247_ARn primers [9]. Detection of Beluga-specific SNP in the 2nd intron of the nuclear ribosomal protein S6 (RP2S6) was conducted with RP2S6_huso_F and RP2S6_groupA_R primers published in Boscari E, et al [10]. Amplification of the 367 bp region of mitochondrial D-loop was conducted with the primers LproF and DL651 [11]. Thus, all sequences obtained were compared with the already known sequences from the internal database of the Russian Federal Research Institute of Fisheries and Oceanography.
Sequence alignment and comparison were conducted using the MEGA Х program. Morphometric measurements in Beluga (n=118) were carried out during the spring appraisal period by 5 parameters: body weight (W, kg), body length L (cm), body length l (cm), body coverage (O, cm), body height (H, cm) [12].
Non-invasive ultrasound express examination of sex and stages of gonad maturation in Beluga was carried out in frontal and transverse planes [13, 14]. Ultrasound examination was carried out using the Draminski iScan ultrasound portable scanner by Dr. Barulin N.V. Technical data: image presentation (projection) mode – B mode, probe frequency and type – electronic linear 7.5 MHz (from 4 to 9 MHz), scanning range from 0 to 15 cm.
Results and Discussions
Testing For Hybrid Presence
Microsatellite loci were used for individual genotyping. Allelic variants were determined for four STR loci (An20, AoxD161, AoxD165, AfuG41) and compared with the data published by Barmintseva AE, et al. [6]. The analysis did not reveal any allelic variants not corresponding to the Beluga (H. huso) species. A combination of occurrence with high frequency of Beluga-specific allelic variants (145 An20, 98 AoxD161, 178 AoxD165, 269 AfuG41) and the absence of allelic variants specific for other species indicates with a high probability the species purity of the studied beluga individuals. Sturgeon species-specific
| Annealing temperature (Tm.°С) | STR locus | Sequence, 5’ > 3’ | Repeat motif | Allele sizes, bp |
|---|---|---|---|---|
| 56 | An20 | F:AATAACAATCATTACATGAGGCT | (ATCT)n (TG)m | 145, 149, 161 |
| R:TGGTCAGTTGTTTTTTTATTGAT | ||||
| 56 | AoxD161 | F:GTTTGAAATGATTGAGAAAATGC | (CTAT)n | 98, 102 |
| R:TGAGACAGACACTCTAGTTAAACAGC | ||||
| 56 | AoxD165 | F: TTTGACAGCTCCTAAGTGATACC | (CTAT)n CTAC (CTAT) m | 178 |
| R:AAAGCCCTACAACAAATGTCAC | ||||
| 56 | AfuG41 | F:TGACTCACAGTAGTATTATTTATG | (GATA)n TA (GATA)m | 229, 237, 261, 269 |
| R:TGATGTTTGCTGAGGCTTTTC | ||||
| 52 | Aox23 | F:TTGTCCAATAGTTTCCAACGC | (ATT)n (ACT)m | 123,126, 129, 135, 141 |
| R:TGTGCTCCTGCTTTTACTGTC | (AAT)p | |||
| 56 | Spl106 | F:CACGTGGATGCGAGAAATAC | (TAGA)n ((T/G)AAA) m | 219, 235, 243 |
| R:GGGGAGAAAACTGGGGTAAA |
Table 1: 4 Sturgeon species-specific microsatellite loci allele variants according the data published by Barmintseva AE, et al. [
Тable 1: Characteristics of 6 microsatellite loci investigated in 118 Huso huso L. specimens.
| Species scientific name (identifica-tion code) | Allele size, bp | |||
|---|---|---|---|---|
| An20 | AoxD161 | AoxD165 | AfuG41 | |
| Defined allelic variants | 145, 149, 161 | 98, 102 | 178 | 229, 237, 261, 269 |
| Huso huso (HUS) | 145-153, 161-165, 173-177 | 98-106 | 174, 178, 182 | 225-277 |
| Huso dauricus (DAU) | 149, 165,169 | 118-126, 134-142 | 174, 186, 190, 194, 198, 202, 206, 210, 216 | - |
| Acipenser schrenckii (SCH) | 137, 149-153, 161, 169-173 | 106-142 | 164, 172, 176, 180, 184, 188, 192, 196, 200, 204 | 185-213 |
| Acipenser guel-denstaedtii (GUE) | 137, 145-181 | 102-138 | 174-178, 182-198, 202 | 173, 193-249 |
| Acipenser medi-rostris (MED) | 161, 169, 181-197 | 114-126 | 182, 186-190, 198, 210,230-254 | 193-205, 213- 217, 225 |
| Acipenser baerii (BAE) | 145-173, 185 | 102-134, 146 | 176-180, 184, 188, 192, 196, 200, 204, 208 | 197, 205-249 |
Table 2: 4 Sturgeon species-specific microsatellite loci allele variants according the data published by Barmintseva AE, et al. [
Allelic variants and the allelic variants identified in our research are listed in the Table 2. Crossing Huso huso x Acipenser ruthenus is very common in fish farming for obtaining highly productive hybrids. Therefore, the broodstock was examined for hybrids with A. ruthenus using the method specially developed for this purpose [9]. This method also allows distinguishing H. huso and A. ruthenus from some other sturgeon species. When using the positive primer mix, the DNA of non-hybrid H. huso individuals is amplified resulting in a fragment of 153 bp, and when using the negative primer mix, in a fragment of 247 bp. On the contrary, A. ruthenus samples give a 247 bp fragment using the positive primer mix and a 153 bp fragment using the negative primer mix. The samples of hybrid (H. huso x A. ruthenus) specimens produce two products using both primer mixes. Obtaining two PCR products using the negative primer mix and no products using the positive primer mix is a sign of other sturgeon species (e.g. H. dauricus, A. schrenckii, A gueldenstaedtii (Figure 1). It should be noted that this method does not allow distinguishing H. huso and A. nudiventris (NUD on Figure 1).
The third method for the species verification was developed specifically for the Beluga (H. huso L.) by Boscari
E, et al. [10] and Mugue NS [15]. It is based on the detection of Beluga-specific SNP in the 2nd intron of the nuclear ribosomal protein S6 (RP2S6). PCR was carried out using the RP2S6_huso_F and RP2S6_groupA_R primer [10].
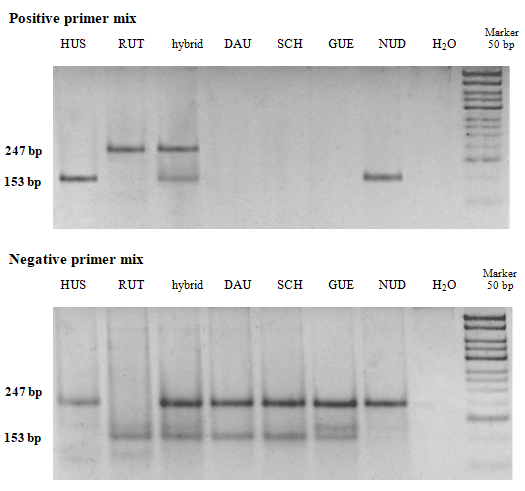
Abbreviations: HUS – Huso huso; RUT – Acipenser ruthenus; hybrid – Huso huso x Acipenser ruthenus; DAU–Huso dauricus; SCH– Acipenser schrenckii; GUE–Acipenser gueldenstaedtii; NUD–Acipenser nudiventris. Figure 1: Electrophoresis of PCR product samples of sturgeon species with positive and negative primer mixes.
mtDNA Analysis
In order to establish the population identity, we sequenced the 367 bp region of mitochondrial D-loop using LproF and DL651 primers [11]. In total, we studied 118 Beluga individuals. The sequences were equal and matched haplotype 3 according to the internal database of the Russian Federal Research Institute of Fisheries and Oceanography (Figure 2). This haplotype corresponds to the Caspian population of Beluga. The obtained sequences also correspond to the sequence (Huso huso caspicus voucher nC12 D-loop, partial sequence) published in the GenBank AY846650.1 [14].
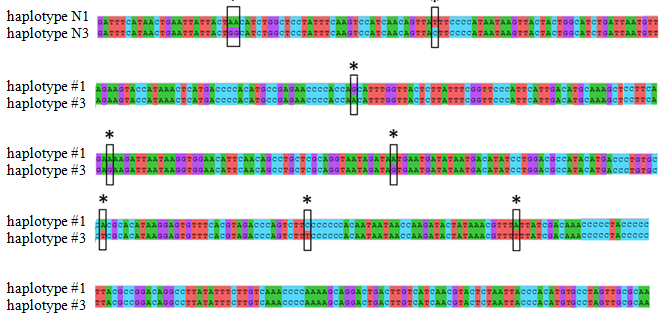
Figure 2: Comparison of two haplotypes #1 and #3 of the beluga sturgeon (Huso huso L., 1758) (haplotype #1 occurs in the Azov Sea beluga population; haplotype #3 is typical for the Caspian beluga population and found in the analyzed individuals at the OAO “Experimental fish farm “Selets”). *Differences in the nucleotide sequences of two haplotypes are marked as rectangles.
Population Structure Identification
Six STR loci (An20, AoxD161, AoxD165, AfuG41, Aox23,
Spl106) were analyzed from the chipped Beluga breeders (n=118) kept in warm and cold water (Table 3).
| Аn20 | AoxD161 | AoxD165 | AfuG41 | Aox23 | Spl106 | ||||||
|---|---|---|---|---|---|---|---|---|---|---|---|
| Allele size, bp | Allele freq. | Allele size, bp | Allele freq. | Allele size, bp | Allele freq. | Allele size, bp | Allele freq. | Allele size, bp | Allele freq. | Allele size, bp | Allele freq. |
| 145 | 0,4918 | 98 | 0,74 | 178 | 1 | 229 | 0,0041 | 123 | 0,2377 | 219 | 0,2541 |
| 149 | 0,2664 | 102 | 0,26 | 237 | 0,4754 | 126 | 0,2787 | 235 | 0,4918 | ||
| 161 | 0,2418 | 261 | 0,2049 | 129 | 0,0041 | 243 | 0,2541 | ||||
| 269 | 0,3156 | 135 | 0,2746 | ||||||||
| 141 | 0,2049 |
Table 3: Frequencies of 6 microsatellite loci allele variants in the Huso huso broodstock of the fish farm “Selets”.
Population Structure Identification
Six STR loci (An20, AoxD161, AoxD165, AfuG41, Aox23, Spl106) were analyzed from the chipped Beluga breeders (n=118) kept in warm and cold water (Table 3).
Five out of six alleles in the studied (Huso huso L.) (n = 118) were polymorphic. It should be noted that alleles 229 (AfuG41) and 129 (Aox23) are registered only once in the sample analyzed in the same female specimen. Hardy- Weinberg expectations for genotype frequencies are shown in the Table 4.
| Locus | DF | χ2 | Prob | Significance |
|---|---|---|---|---|
| Аn 20 | 3 | 35,184 | 0,000 | P<0.001 |
| Aox D161 | 1 | 15,423 | 0,000 | P<0.001 |
| Aox D165 | Monomorphic | |||
| AfuG 41 | 6 | 36,666 | 0,000 | P<0.001 |
| Aox 23 | 10 | 1,16,266 | 0,000 | P<0.001 |
| Spl 106 | 3 | 30,534 | 0,000 | P<0.001 |
Table 4: Summary of Chi-Square Tests (χ2) for Hardy-Weinberg Equilibrium.
Abbreviations: DF, the degrees of freedom = [Na(Na-1)]/2; Prob, probability of the observed numbers deviating as far from the expected numbers by chance. Table 4: Summary of Chi-Square Tests (χ2) for Hardy-Weinberg Equilibrium.
| Sample | Beluga from the fish farm “Selets”, the Republic of Belarus | Domesticated Beluga, the Russian Federation | ||||||
|---|---|---|---|---|---|---|---|---|
| Locus | Аn20 | AoxD161 | AoxD165 | AfuG41 | Аn20 | AoxD161 | AoxD165 | AfuG41 |
| Na | 3 | 2 | 1 | 4 | 12 | 5 | 8 | 14 |
| Ne | 2,693 | 1,631 | 1,000 | 2,720 | 4,036 | 2,008 | 2,664 | 9,640 |
| I | 1,045 | 0,575 | 0,000 | 1,065 | 1,950 | 1,005 | 1,303 | 2,433 |
| Ho | 0,746 | 0,525 | 0,000 | 0,795 | 0,577 | 0,327 | 0,442 | 0,788 |
| He | 0,629 | 0,387 | 0,000 | 0,632 | 0,752 | 0,502 | 0,625 | 0,896 |
| uHe | 0,631 | 0,389 | 0,000 | 0,635 | 0,760 | 0,507 | 0,760 | 0,905 |
| F | -0,186 | -0,356 | - | -0,257 | 0,233 | 0,349 | 0,292 | 0,120 |
Table 5: Beluga from the fish farm “Selets” was compared with the domesticated Caspian Beluga population from a number of fish fa
It was revealed a significant difference between the observed and expected according to Hardy-Weinberg model number of allele variance. Considering the fact that the main variety of allelic variants in the analyzed group is limited to 1-4, it is probable that most of individuals are the offspring’s of the same broodstock pair. The statistical parameters for population structure analysis shown in the Table 5.
Beluga from the fish farm “Selets” was compared with the domesticated Caspian Beluga population from a number of fish farms (the Russian Federation). The conducted analyses showed a lack of the gene pool diversity of Beluga sturgeon broodstock from the fish farm “Selets”. A number of identified allelic variants (Na) at the fish farm “Selets”/domesticated Beluga are as follows: An20 3/12, AoxD161 2/5, AoxD165 1/8, AfuG41 4/14. It should be noted that at the fish farm “Selets” Beluga showed a negative sign of the fixation index in contrast with a positive index for the domesticated Beluga population. It indicates the genetic balance displacement towards the heterozygote excess in the population of the fish farm “Selets” and shows the unequal allele distribution in the population, which may be a result of the specimens’ close relation. The intrapopulation breeding of these specimens would lead to a decrease in heterozygosity that increases the probability of recessive genetic abnormalities in their offspring.
Morphometric Analysis and Sexing
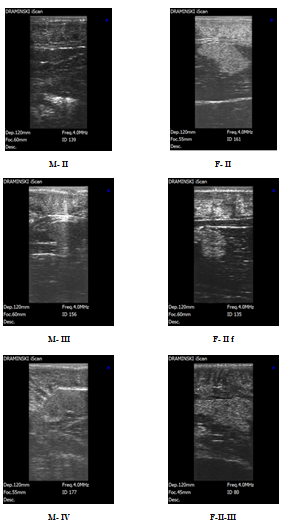
The morphometric analysis of Beluga (n=118) from the broodstock from the fish farm “Selets” revealed their unsatisfactory physiological state after winter and during the feeding period. Comparatively high variability (Cv) of the body mass (16,3%), Fulton’s condition factor (1,5%) W, kg L, cm l, cm H, cm O, cm K, % A Сv, % A Сv, % A Сv, % A Сv, % A Сv, % $$ \begin{array}{c c c c c c c c c c c} 6 0, 3 \pm 9, 8 & 1 6, 3 & 1 9 2, 2 \pm 1 8, 3 & 9, 5 & 1 6 1, 6 \pm 1 1, 2 & 6, 9 & 3 3, 2 \pm 2, 9 & 8, 7 & 9 1, 3 \pm 7, 6 & 8, 4 & 1, 5 \end{array} $$ and external traits may be a result of unfavorable feeding conditions (Table 6), since genetic evidence shows a low allelic variation in the Beluga broodstock. Using ultrasound scanning, we found that the broodstock of Beluga at the fish farm” Selets” was represented by 61.9% of females (73 pcs. ♀) and 38.1% of males (45 pcs. ♂). In our research, we observed the following stages of gonadal maturity: stages II, III and IV for males and II, II semi-fatty, II fatty, III and IV in females. Starting from the maturity stage II, testicular tissue was easily visible in frontal and transverse sections (Figure 3). The testicular part was hyperechoic and had distinct margins. The fat part was underdeveloped or poorly developed from the medial side and practically not visible. The margins of the gonad were smoothly curved, while a bright hyperechoic tunic of testis was clearly seen.
At maturity stage III, the echogenicity of testicular tissue increases significantly. The testes appeared on echograms as a homogeneous structure of a light grey (in some cases white) colour with distinct hyperechoic margins. In some cases, two clear hyperechoic lines, gonad margins and peritoneal lining, were well discernable. On the echogram, the testes at stage IV appeared as a bright, hyperechoic, fine-grained homogeneous structure with clear margins and well-defined tunics. Hyperechogenicity of the testis reached its maximum at stage IV. The ripe male maturity status and readiness to spawn were assessed by the brightness of the testis image. On the ultrasound image, the ovarian tissue (stage II) appeared as a grainy “cloud-like” structure of mixed echogenicity with uneven boundaries without a tunic. The fatty portion of the ovary was slight and was visualized in the shape of darker areas as distinct from the lighter ovarian tissue.
- Abbreviations: A - the arithmetic mean; Cv - coefficient of variation; W - body mass, kg; L absolute body length (from the beginning of the rostrum to the end of the upper lobe of the caudal fin), cm; l - short length (from the beginning of the head rostrum to the end of the caudal peduncle), cm; H - body height, cm; O - body girth, cm; K - Fulton’s condition factor
Table 6: Morphometric analysis of Huso huso from the fish farm “Selets”.
At maturity stage II semi-fatty, on the ultrasound image, single ovigerous lamellae appeared as areas of higher echogenicity (of a grey or light-grey colour) alternating with hypoechoic (dark) fat regions. Thus ovigerous lamellae “grew” from the lateral to the medial part of the gonad. At maturity stage II fatty, in contrast to previous stages, the proportion of the ovarian and fat tissue visible on echograms was different. The ovarian tissue was surrounded by fat both from the medial and lateral sides (dark, anechoic regions).
The dark anechoic fat layer was well discernable between the muscles and the gonads. At maturity stage II-III, an ovary seen in the ultrasound image showed moderate echogenicity (grey or light grey). Ovigerous lamellae “penetrated” the body of the gonad and appeared as a brachiate vertical structure (“coral-like” or “fringed” in shape) of higher echogenicity, spreading to the dark hypoechoic region (the fat tissue).
Conclusions
- The purity of the species in the Beluga (Huso huso L.) broodstock at the fish farm “Selets” (Brest region, the Republic of Belarus) was established.
- The absence of interspecific hybrids and species purity in the studied Beluga group was confirmed by three molecular genetic methods mentioned in Materials and Methods. It is important that the markers we used allow the accurate identification of bester, a hybrid that is most commercially exploited.
- The sequence of 367 bp in the mitochondrial D-loop region was identified as haplotype 3 that corresponds to the Caspian population of Beluga. The population structure analyses showed a lack of the gene pool diversity of Beluga broodstock from the fish farm “Selets”.
- The resulting diversity of microsatellite locus length may indicate a close affinity of the analyzed sturgeon individuals. The comparative analysis of the Beluga gene pool of the fish farm “Selets” and the gene pools of domesticated Beluga sturgeons of a number of sturgeon fish farms in the Russian Federation showed that the Beluga gene pool in the Belarusian farm is poorer than in the domesticated Beluga from Russian sturgeon fish farms.
- The coefficients of variation of morphometric parameters and Fulton’s condition factor indicate that the conditions in which the Beluga broodstock is kept at the fish farm “Selets” should be improved.
- The following stages of gonad maturity were established using the ultrasound scanning of Beluga at the fish farm “Selets”: stages II, III and IV in males; II, II semi-fatty, II fatty, II-III in females.
- The Beluga broodstock at the fish farm “Selets” is mainly represented by females exceeding males by 1.6 times in their number.
Acknowledgements
This research is carried out with financially supported by the State Research Programme in Belarus “Green Technologies of Resource Use and Eco-Safety”, and the Subprogramme “Sustainable environmental management and innovative technologies for processing, protection and reproduction of Natural resources”.
References
-
Birstein VJ, Bemis WE, Waldman JR (1997) The threatened status of Acipenseriform species: a summary. Environmental Biology of Fishes 48: 427-435.
-
Raymakers C (2006) CITES, the Convention on International Trade in Endangered Species of wild fauna and flora: its role in the conservation of Acipenseriformes. J Appl Ichthyol 22(1): 53-65.
-
Red Data Book of the Russian Federation (animals) (2001) Danilov-Danilyan VI (Ed.), Moscow: AST Astrel, pp: 862.
-
Red Book of Ukraine. Animal World (2009) Akimova IA (Ed.), Kiev Global Consulting, pp: 600.
-
Red Data Book of the Republic of Bulgaria Volume 2 – Animals (2015) Golemanski V, et al. (Eds.), Sofia. Institute of Biodiversity and Ecosystem Research–BAS & Ministry of Environment and Water, pp: 881.
-
Barmintseva AE, Mugue NS (2013) The Use of Microsatellite Loci for Identification of Sturgeon Species (Acipenseridae) and Hybrid Forms. Russian Journal of Genetics 49(9): 1093-1105.
-
Fopp-Bayat D, Kuciński M, Liszewski T, Teodorowicz T, Łączyńska B, et al. (2015) Genetic protocol of Atlantic sturgeon Acipenser oxyrinchus (L.) fry for restocking the Vistula river, Poland. Journal of Survey in Fisheries Sciences 2(1): 1-10.
-
King TL, Lubinski BA, Spidle AP (2001) Microsatellite DNA variation in Atlantic sturgeon (Acipenser oxyrinchus) and cross-species amplification in Acipenseridae. Journal of Conservation Genetics 2: 103-119.
-
Havelka M, Takafumi F, Seishi H, Shinji A, Katsutoshi A (2017) Nuclear DNA markers for identification of Beluga and Sterlet sturgeons and their interspecific Bester hybrid. Scientific Reports 7(1): 1694.
-
Boscari E, Vitulo N, Ludwig A, Caruso C, Mugue NS, et al. (2017) Fast genetic identification of the Beluga sturgeon and its sought-after caviar to stem illegal trade. Food Control 75: 145-152.
-
Mugue N, Barmintseva A, Rastorguev S, Mugue V, Barmintsev V (2008) Polymorphism of the mitochondrial DNA control region in 8 sturgeon species and development of a system for DNA-based species identification. Russ J Genet 44(7): 913-919.
-
Pravdin IF (1966) The guide for fish study (with focus on freshwater fish)/Moscow: Food Industry, pp: 376.
-
Chebanov MS, Galich EV (2013) Sturgeon hatchery manual. FAO Fisheries and Aquaculture Technical Paper, pp: 558.
-
Doukakis P, Birstein VJ, De Salle R (2005) Intraspecific structure within three caviar producing sturgeons (Acipenser gueldenstaedtii, A. stellatus, and Huso huso) based on mitochondrial DNA analysis. Journal of Applied Ichthyology 21(6): 457-460.
-
Sturgeons comlex genetic research: genome organization, phylogeny and development of natural populations of Russian Federation recovery genetic monitoring techniques (2017) /Koltzov Institute of Developmental Biology of Russian Academy of Sciences; project head N.S. Mugue. Moscow, № 15-29-02766 ofi_m. (In Russian).
- Genetic Improvement of Nile Tilapia (Oreochromis niloticus): Advances in Selective Breeding and Genomic Approaches for Sustainable Aquaculture
- Microplastics, Contaminants, and Waste Hotspots: Divergences and Faults in Prioritizing Control Efforts
- Creating a Healthier, More Vibrant Open and Closed Aquatic Environment. A Submersible, Centrifugal Magnetically Affixed Current Changing Aquarium Pump
- An Attempt to Assess Alpha Diversity and Sample Size: Using the Ostracod Assemblages off Kumamoto Port, Japan
- Assessment of the Efficiency of Common Fishing Gears and Crafts Used at Mohananda River of Chapai Nawabganj, Bangladesh
- Fish Productivity and Biodiversity Status of Sundarban Mangrove in Bangladesh