Effect of Climate Change on CPEC Route due to Precipitation Variation
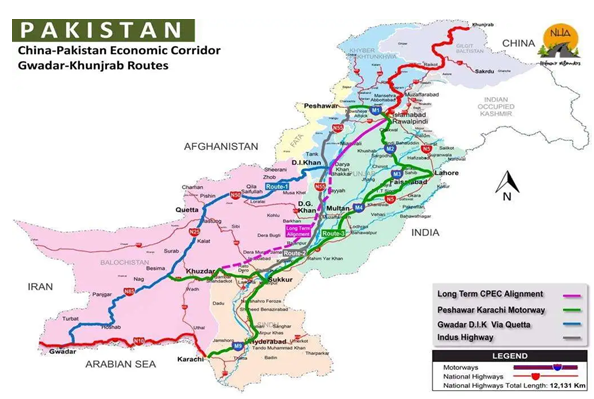
China Pakistan Economic Corridor (CPEC) the game changer not only for Pakistan but also for Asia is nominated for the study area of this research. The maximum portion of CPCE passes through Baluchistan province. Baluchistan province has plains, valleys, mountains, rugged terrain, coastline, and an extreme climate that addresses most of the determinants that affect precipitation. Precipitation in Baluchistan mostly turns into flash floods due to its topography. Flash floods are proven to be more catastrophic and devastating in nature. This study focuses the one of the major aspects of climate change that is variation and trend of precipitation pattern CPEC route. The study investigates the trend of precipitation using nonparametric statistical analysis known as Mann Kendall because when 45 years of precipitation data (1977-2022) was analyzed by four different normality tests it was found to be not normally distributed data. Leading us to the conclusion that a nonparametric test will be applicable to find trend. The monthly precipitation data for selected weather stations along the CPEC route is taken from Pakistan Meteorological Department (PMD). The study provides benefits to the CPEC route in many ways, firstly it provides a trend analysis of precipitation on a monthly, yearly, and seasonal basis, by two methods i) the conventional graphical method and ii) the nonparametric technique known as the Mann-Kendall test. Secondly, the study selected the 9 most common climate indices that affect Pakistan’s climate and precipitation trends by literature review and studying the impact of all the climate indices by applying Person’s correlation. Person’s correlation investigates the linear association of Climatic Indices with Precipitation, and lastly Partial Mann–Kendall for observing the impact of teleconnections on precipitation patterns. This study is the first statistical analysis of the CPCE route and the effect of climate indices on CPEC routes to due precipitation variation and climate indices. This research will provide a baseline study for future comparative studies tracing the effects of CPEC on Precipitation patterns. The research addresses 2 SDGs namely SDG # 11.5 (natural disasters) and SDG#13 (climate action).
Introduction
Baluchistan host a substantial portion of the Western and Central portion of CPEC. It is the future hub of all financial activity for the next century. It is the region with vibrating, socioeconomic activity, financial growth, and trade center for Asia, therefore, it’s very important to examine the trend of precipitation, factors causing variation in precipitation, and the future weather pattern of this financial hub. Baluchistan’s topography, mountains, rugged terrain, coastline, extreme climate, relative continental position, atmospheric current, orographic barriers, surface condition, and natural or anthropogenic activity address most of the determinants that affect precipitation. However, the author through a meticulous literature review has carefully developed the innovation of this research article which lies in observing the impact of climate indices/teleconnection on the precipitation pattern as well as the effect of climate change on the CPEC and international trade route to boots the deying economy of pakistan.
Literature Review
Climate indices, also accepted as teleconnections, are predominantly liable for variations in precipitation, causing droughts or flooding in the region. Teleconnections can influence close areas to far-flung regions of the globe. Precipitation and droughts all over the globe are sturdily controlled by atmospheric circulations and climate indices. Hence, different climate indices have different effects. This explains the reason why the different region has different climates; for illustrate, some parts have more precipitation compared to others; some parts of the world are hotter than other [1]. The key parameters governing precipitation variation are ocean circulations, air circulations, wind speed, vapor movement, wind direction, thermal fluxes, and so on. The majority of ocean circulation investigations and research have been conducted under the banner of teleconnections [2, 3]. Investigation of teleconnections and their impacts, on precipitation patterns can be very obliging to comprehend future climate patterns [4]. Many Asian countries like Pakistan, India, and Bangladesh, have suffered unfamiliar flooding in the past decades because of unprecedented precipitation trends [5, 6]. A thorough investigation of precipitation is essential for identifying hazards such as droughts, flooding, landslides, infrastructural and environmental damage, etc [7].
Global Climate Risk Index (GCRI) emphasizes that climate studies and research are eminent for Pakistan [8]. Pakistan was placed among the top vulnerable countries to climate change in 2012 [9]. The province of Baluchistan has experienced disastrous flooding and devastating droughts as a result of unprecedented precipitation patterns. Furthermore, the region’s current role is even more vital due to CPEC and Gawadar Port [1]. Climate indices such as the Arctic Oscillation (AO), El Nino Southern Oscillation (ENSO), North Atlantic Oscillation (NAO), Indian Ocean Dipole (IOD), and North Atlantic Oscillation (NAO) are frequently used to assess variations in precipitation throughout Pakistan [10, 11]. Studies carried out by Krishnamurthy L, et al. [12], Liess A, et al. [13] and Afzal M, et al. [14], report that there exists a significant association between precipitation variations and climate indices in Pakistan. Research carried out by Iqbal MF, et al. [15], 2018 applied Pearson’s correlation to find the impacts of teleconnections, like NAO, AO, AMO, IOD, PDO, QBO, and ENSO on precipitation.
Study Area
The western route of CPCE passes through the major cities in Baluchistan as shown in Figure 1 and is designated as the research area of this study. Baluchistan has tough, dry, rocky terrain, including both plains and mountain ranges. Baluchistan accounts for over 44% of Pakistan’s total landmand mass [16, 17]. The region is arid and humid, with high and frigid temperatures [18, 19]. Western disturbances are mainly responsible to impact the weather of Baluchistan in the spring, and winter months. Monsoons have minimum influence during the summer. Also, during the autumn season, few tropical storms are reported along the Baluchistan coastal areas [20, 21, 22, 23].
Data Source and Formulation
Data PMD was approached to get the monthly precipitation data (in millimeters). Six cities in Baluchistan as shown in Figure 2 were carefully chosen with the authenticity, accuracy, inclusivity, and readiness of data for the 45-year of analysis. Six stations such as: Barakhan, Panjgur, Kalat, Khuzdar, Quetta, and Zhob were selected for the study. The precipitation data of Gawadar weather stations do not spread over the 45 years and thus are not included in the analysis. There is also one exclusive international research paper published on the weather and climate of Gwadar deep sea port in by the author in 2022. Data gathered from PMD were on a monthly basis (in mm/month) for six stations. Monthly data were then converted to annual precipitation data for the analysis.
Data characteristics (Kurtosis and skewness) were also checked for the precipitation statistics used in the analysis to highlight outliers, missing values, distribution types, changes, cycles, and homogeneity, and the results are shown in Appendix A (Table 1).
| Sr.No | Stations | Mean | Standard Deviation | Kurtosis | Skewness |
|---|---|---|---|---|---|
| 1 | Barakhan | 421.376 | 140.047 | 0.769 | 0.455 |
| 2 | Kalat | 200.413 | 170.917 | 10.05 | 2.612 |
| 3 | Khuzdar | 265.875 | 118.215 | 1.147 | 0.994 |
| 4 | Panjgur | 94.884 | 56.881 | 3.95 | 1.641 |
| 5 | Quetta | 270.502 | 152.86 | 9.365 | 2.542 |
| 6 | Zhob | 281.859 | 92.734 | -0.101 | 0.193 |
Table 1: Data characteristics.

Precipitation data was checked for its normality by implementing some tests, such as the Shapiro–Wilk W test, Lilliefors test, Anderson–Darling test, and the Jarque–Bera test. The results of the test are presented in Appendix B (Table 2).
| Stations | Shapiro-Wilk | Anderson-Darling | Lilliefors | Jarque-Bera | |
|---|---|---|---|---|---|
| 1 | Barakhan | Passed | Passed | Passed | Passed |
| 2 | Kalat | failed | failed | failed | failed |
| 3 | Khuzdar | failed | failed | failed | failed |
| 4 | Panjgur | failed | failed | failed | failed |
| 5 | Quetta | failed | failed | failed | failed |
| 6 | Zhob | Passed | Passed | Passed | Passed |
Table 2: Normality tests on the annual time series.
Normality test results indicated that the precipitation data of only two stations, namely Barakhan and Zhob, were normally distributed; and in the other four stations, the data were not normally distributed. Table 3 illustrates the mean precipitation (monthly / annually) for the analysis duration (from 1997 to 2022) in the 06 stations of Baluchistan.
The table indicates that Barakhan, Kalat, Khuzdar, and Zhob get the majority of their precipitation during the monsoon season. Panjgur is located in western Baluchistan and receives the majority of its precipitation during the winter season as a result of the western disturbance. Quetta station was excluded since the majority of its precipitation fell during the winter season.
| Stations | Winter | Spring/Pre- monsoon | Monsoon | Post- monsoon | Annual precipitation | ||||||||
|---|---|---|---|---|---|---|---|---|---|---|---|---|---|
| Dec | Jan | Feb | Mar | Apr | May | Jun | Jul | Aug | Sep | Oct | Nov | ||
| Barakhan | 6.5 | 13.1 | 21.1 | 31.3 | 34.6 | 24.7 | 48.2 | 108.4 | 84.6 | 35 | 9.1 | 4.9 | 421.5 |
| Kalat | 30.3 | 34.7 | 37.8 | 31 | 11 | 3.9 | 6.7 | 16.3 | 13.4 | 4.6 | 5 | 5.8 | 200.5 |
| Khuzdar | 14.7 | 16.5 | 30.9 | 29.3 | 16.3 | 14.1 | 16.5 | 51.2 | 56.6 | 9.1 | 6.5 | 4.3 | 266 |
| Quetta | 30.8 | 53.8 | 51.7 | 55.5 | 26 | 7.5 | 4 | 12.5 | 11.1 | 3.1 | 5.7 | 8.8 | 270.5 |
| Zhob | 9.2 | 17.1 | 26.9 | 43.5 | 29.1 | 14.8 | 17.7 | 56.2 | 44.8 | 11.1 | 5.8 | 5.6 | 281.8 |
| Panjgur | 10 | 12.8 | 15 | 15.1 | 8.3 | 3.5 | 5 | 12.1 | 7.7 | 1.7 | 2.1 | 1.6 | 94.9 |
| Monthly Avg. | 13.7 | 18.7 | 22 | 23.7 | 12.1 | 7.4 | 11.8 | 28.6 | 24 | 6.7 | 3.9 | 3.4 | |
| Seasoal Sum | 54.3 | 43.2 | 71.1 | 7.3 |
Table 3: Average precipitation (mm) from 1977 to 2022.
Monthly and Annual Precipitation Data
To detect and demonstrate the monthly trend of precipitation, data obtained from PMD, was used for the selected six stations all over Baluchistan.
Seasonal Precipitation Data
The five most common seasons of Baluchistan namely winter, spring, summer, monsoon, and autumn are selected for seasonal investigation. The seasonal data was prepared by adding two to three monthly values. Table 4 show the five selected seasons for the seasonal analysis and the respective months fall in all of the seasons.
| S.No | Seasons | Months |
|---|---|---|
| 1 | Winter | December, January, February |
| 2 | Spring | March, April |
| 3 | Summer | May, June |
| 4 | Monsoon | July, August, September |
| 5 | Autumn | October, November |
Table 4: Five most common Seasonal and their respective months
Climatic Indices
Climatic indices nine (09), namely the Arctic Oscillation (AO), North Atlantic Oscillation (NAO), Atlantic Multi-decadal Oscillation (AMO), Pacific Decadal Oscillation (PDO), Indian Ocean Dipole (IOD), El Nino Southern Oscillation (ENSO- MEI), Equatorial Indian Ocean Zonal Wind Index (EQWIN), and ENSO Modoki Index (EMI), identified through studies to affect the precipitation in the study area were selected for the analysis [11, 17, 24]. Nonetheless, the effects of climate indices, such as the Equatorial Indian Ocean Zonal Wind Index (EQWIN) and ENSO Modoki Index (EMI), have never been explored in Baluchistan [25]. This is also one of the novelties of this research.
Methodology
Precipitation pattern analyses were conducted using two different methods as discussed below.
- Simple graphical method
- Mann–Kendall (Statistical) tests Simple graphical method ii) Mann–Kendall (Statistical) tests were applied on a monthly interval for the investigation of 45 years on six stations in Baluchistan [26, 27, 28]. All 12 months from January to December (1977 to 2020) were analyzed for trend detection. To minimize lengthy, irrelevant repetition, only stations and months with substantial and noticeable trends were selected for further research. The correlation between climate indices and precipitation was established by using Pearson’s correlation.
The impacts of teleconnection as influencing variables on precipitation patterns were studied by applying the Partial Mann–Kendall technique [29, 30, 31]. Teleconnection or climatic indices were selected as covariate independent variables (whereas precipitation was selected as the dependent variable). PMK and Pearson’s correlation was used to evaluate the effect of climatic indices on precipitation [32]. PMK is a widely used technique due to its authentic result. PMK is used in several analyses containing the recent climate studies performed by Libiseller C, et al. [33], Oldenborgh GJ, et al. [34], Hajani E, et al. [35] and Yadav RK, et al. [36].
Finally, the study and results were completed utilizing the combined technique, with the influencing variables (climate indices) in tabular form. The table is shown, and the findings are discussed in the results and discussion section. The table is only for the substantial and noteworthy precipitation patterns and stations. These important precipitation connections have mild, moderate, and strong influences on precipitation [37].
Results and Discussions
Trends in Precipitations by Simple Graphical Method
Monthly trend detection was investigated by constructing simple graphs. These graphs illustrate the precipitation pattern for each individual station with respect to time for only two months i.e. January and June to avoid repetition. These two months are significant for the occurrence of precipitation. Time versus precipitation graphs for each individual station of Baluchistan (January and June) are illustrated below. The trend line with its equation is displayed on each graph. One can see that the decrement (increment) trend slopes for the month of January and June with the help of a dotted red trend line drawn on each station graph.
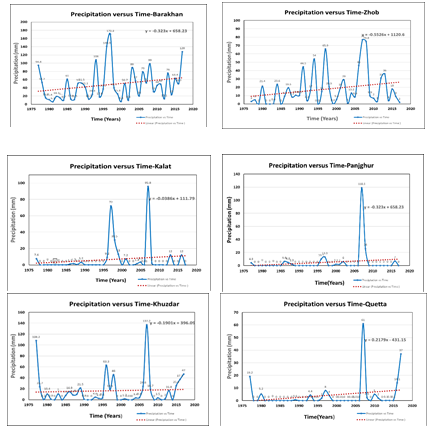
Graph 1: Displays the precipitation trend for individual stations as a function of time for the month of January.
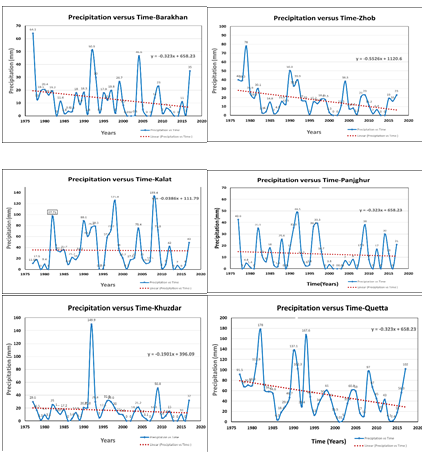
Graph 2: Displays the precipitation trend for each station as a function of time for the month of June Trends in Precipitations using Mann–Kendall statistic, Theil–Sen (TS) slope Statistical technique Mann–Kendall (MK) is used to find the monotonic pattern precipitation on a monthly basis from 1977 to 2022 at individual stations. Table 3 shows 07 statistically significant increasing trends, trends (highlighted). Increasing trends were found in Barakhan (June), Panjgur (December) Quetta (June and September), and Kalat, Khuzdar, and Zhob (none). Most current studies carried out by Naz F, et al. [16] in 2020 on Baluchistan and many others also confirmed this finding [16]. Global
| Stns | Variables | Jan | Feb | March | April | May | June | July | August | Sep | Oct | Nov | Dec |
|---|---|---|---|---|---|---|---|---|---|---|---|---|---|
| Barakhan | S | −177 | −70 | −144 | −57 | −1 | 175 | −76 | 44 | −79 | 7 | −211 | −74 |
| P | 4.62% | 43.14% | 10.57% | 52.20% | 99.10% | 4.93% | 39.33% | 62.12% | 37.49% | 93.32% | 1.07% | 38.76% | |
| TS | −0.205 * | −0.206 | −0.478 | −0.187 | 0 | 0.832 * | −0.767 | 0.354 | −0.291 | 0 | 0 | 0 | |
| Kalat | S | −43 | 47 | 28 | −35 | 23 | 68 | −167 | −68 | 9 | −68 | 66 | −114 |
| P | 62.89% | 59.72% | 75.22% | 69.12% | 78.48% | 39.87% | 5.41% | 43.02% | 89.95% | 28.97% | 42.94% | 18.86% | |
| TS | −0.079 | 0.13 | 0.004 | 0 | 0 | 0 | −0.117 | 0 | 0 | 0 | 0 | −0.049 | |
| Khuzdar | S | −97 | −67 | 28 | −47 | 28 | 31 | −20 | −59 | 30 | −93 | −151 | −178 |
| P | 27.45% | 45.12% | 75.27% | 59.65% | 75.21% | 72.56% | 82.22% | 50.75% | 73.06% | 21.50% | 6.45% | 4.01% | |
| TS | −0.117 | −0.242 | 0.092 | −0.011 | 0 | 0 | −0.067 | −0.380 | 0 | 0 | 0 | −0.094 | |
| Panjgur | S | −28 | −93 | −56 | −32 | 135 | 18 | −195 | −78 | −5 | −76 | −90 | −176 |
| P | 75.17% | 29.40% | 52.60% | 70.43% | 8.89% | 80.07% | 2.28% | 31.75% | 93.79% | 13.13% | 17.80% | 3.51% | |
| TS | 0 | −0.131 | −0.019 | 0 | 0 | 0 | −0.083 | 0 | 0 | 0 | 0 | 0 | |
| Quetta | S | −224 | −44 | −157 | 130 | 165 | 206 | −33 | −12 | 153 | 8 | 76 | −169 |
| P | 1.19% | 62.11% | 7.78% | 14.38% | 6.07% | 1.26% | 70.15% | 88.99% | 3.14% | 91.50% | 37.77% | 5.74% | |
| TS | −1.223 * | −0.265 | −0.966 | 0.2 | 0.019 | 0 | 0 | 0 | 0.001 | 0 | 0 | −0.543 | |
| Zhob | S | −201 | −19 | −132 | −39 | 38 | 161 | 56 | −122 | 77 | −38 | −39 | −160 |
| P | 2.39% | 83.08% | 13.81% | 66.12% | 66.85% | 7.04% | 52.93% | 17.06% | 38.20% | 61.98% | 64.03% | 6.63% | |
| TS | −0.417 * | −0.029 | −0.655 | −0.078 | 0.044 | 0.25 | 0.264 | −0.559 | 0.029 | 0 | 0 | −0.056 |
Table 5: Precipitation trend on a monthly basis showing significant increasing (decreasing) trends at each individual station.
The Mann–Kendall statistic is shown by S. Theil–Sen slope is shown by (TS). Theil–Sen (TS) noteworthy slope is shown by “ * ” (asterisk). The bold numbers represent significant correlations at a 5% confidence level, p is the p-value of the null hypothesis (Ho) of no trend at a 5% significance., The Theil–Sen slope with (*) shows trends in Barakhan (January and June), Khalat (none), Khuzdar (none), Panjgur (none), Quetta (January), and Zhob (January), rest are nearly negligible and, hence, are ignored. The graphs showing the trend in precipitation for each station, (against time) for January and June are presented in G1 and G2. The trend equations and trend lines in dotted are also mentioned on each graph. It can be inferred from the graphs that the decrement (increment) trend slopes (for January and June, for which the MK and TS report significant trends (i.e., p-value < 5%)), are much higher as compared to other months. Kalat, Khuzdar, and Zhob, showed no statistically significant trends in precipitation (at a 5% significance level) and, hence, were ignored for further analyses.
Seasonal Trends
Mann-Kendall (MK) and Spearman’s rho (SR) tests were run on prepared seasonal data for five seasons namely winter, spring, summer, monsoon, and autumn for 06 stations of Baluchistan. Seasonal trend results are further sorted for 5% and 10% significance levels with respect to the strength of trend, and depth of observations. Sixteen (16) observations are considered as a threshold for detecting the Increasing and decreasing seasonal trend. Results of the seasonal trends are displayed in Table 6.
| Seasons | Stations | |||||
|---|---|---|---|---|---|---|
| Barakhan | Panjgur | Kalat | Khuzdar | Quetta | Zhob | |
| Winter | -5% | - | - | - | -5% | - |
| Spring | - | - | - | - | - | - |
| Summer | - | - | - | - | 10% | - |
| Monsoon | - | -5% | - | - | - | - |
| Autumn | - | - | - | -5% | - | - |
Table 6: MK Test Results (Positive Increasing negative Decreasing trend) on seasonal Time Series with 5% and 10% significance.
Linear Association of Climatic Indices with Precipitation
To check the correlation between the climate indices and precipitation data of the individual PMD stations. Pearson’s correlation was performed. A two-tailed test at a 5% significance level) is considered significant having a correlation coefficient value of 0.316 (−0.316) or higher (lower) for 45 years of precipitation station data. Stations and months having prominent trends in precipitation, as shown in Table 2 are selected to avoid repetition and monotonous calculation. Table 5 displays the correlation between the precipitation (dependent variable) and climatic indices (independent variables).
| Month | NAO | AO | IOD | PDO | ENSO-EMI | EQWIN | EMI-MODOKI | OLR | |
|---|---|---|---|---|---|---|---|---|---|
| Barakhan | January | -15.83% | -0.02% | -1.22% | -1.57% | 1.77% | -14.05% | 21.46% | -44.79% |
| Barakhan | June | -6.05% | -6.59 | 4.74% | 31.85% | 6.40% | 3.94% | -0.34% | -2.81% |
| Barakhan | Noember | 11.61% | 25.03% | 40.10% | 1.08% | 37.93% | 59.39% | -42.18% | -3.97% |
| Khuzdar | December | -0.17% | 12.84% | 9.50% | -18.98% | 22.22% | 30.97% | -20.08% | 14.76% |
| Panjgur | July | 6.10% | -15.01% | 2.24% | 1.52% | -24.26% | 21.98% | 11.83% | 6.50% |
| Panjgur | December | 14.53% | 19.09% | 8.45% | -5.95% | 24.03% | 37.27% | -21.87% | 12.53% |
| Quetta | January | -0.93% | 14.93% | 3.70% | -12.46% | 3.66% | 13.20% | -23.98% | 19.27% |
| Quetta | June | -17.37% | -11.43% | 16.90% | 7.14% | -3.48% | 27.02% | 17.05% | -21.23% |
| Quetta | September | -11.23% | 9.12% | 33.63% | -33.02% | 0.48% | 25.04% | 1.42% | 15.25% |
| Zhob | January | -28.68% | -18.96% | 11.70% | -11.04% | 14.91% | 23.30% | -20.99% | -9.06% |
Table 7: Correlation of precipitation at individual stations with climatic indices.
The significant correlations at a confidence level of 0.05 (5%) are shown in bold font. The influence of climatic indices or teleconnection on precipitation was evaluated by Pearson’s correlation analyses are displayed in Table 5 above. It is intimated again noticeable trends are shown by Barakhan, Khuzdar, Zhob, and Quetta, stations, hence, only these stations were counted.
Numerous research articles and findings have highlighted that climate indices ENSO and NAO impact the precipitation pattern in Pakistan both locally and regionally [38]. For instance, Yadav RK, et al. [36] reported the influence of ENSO on the weather of Pakistan has grown as compared to NAO. Rashid A [37] investigated the influence of ENSO and reported that ENSO had a negative impact on the winter precipitation pattern in Pakistan. The precipitation in the winter in Pakistan remains below normal under the influence of the ENSO (-ve) phase (i.e., La Niña condition). Researchers Abraham A, et al. [39] and Khan AH [40] reported that ENSO’s impact on the precipitation pattern of Pakistan is not very significant.
To summarize the finding reported in Table 5 author can conclude that climate indices namely NAO, AO, IOD, PDO, and ENSO-MEI are correlated with the precipitation pattern of December and January, and climate indices namely EQWIN, EMI, and OLR are correlated with June precipitation.
Results of PMK and Correlation representing the impact of climatic Indices—A Combined Approach.
Analysis performed, findings, and results reported in Table 3 to Table 5 were combined in Table 6 for the ease of the reviewer and reader. One can easily conclude the statistical analysis and draw the crips conclusion that will be helpful for future planning, policy-making, and visualizing the effect of climate change on precipitation trends. Pointing the noteworthy correlations of climate indices with the precipitation along with their influences (classified as weak, moderate, or strong). Table 6 clearly states that the climate indices namely NAO, AO, IOD, PDO, and ENSO-MEI were significantly correlated but had a weak influence on precipitation in December and January. Similarly, IOD, EMI, EQWIN, and OLR were significantly correlated but had a moderate to strong influence on precipitation in June.
| Variables | Months | Stations | Mann-Kendall | Partial Mann-Kendall with Covariate | % Change in MK Statistics due to Addition of Covariate | Influence Type as per PMK | Person Correlation | ||
|---|---|---|---|---|---|---|---|---|---|
| MK | PMK | ||||||||
| p-Value | Statistics | p-value | Statistics | ||||||
| NAO | January | Quetta | 0.0119 | -224 | 0.0121 | -223.4 | 0.27% | Weak | -0.93% |
| AO | Barakhan | 0.0462 | -177 | 0.0397 | -179 | 1.13% | Weak | -0.02% | |
| IOD | Barakhan | 0.0462 | -177 | 0.0338 | -188 | 6.21% | Weak | -1.22% | |
| Quetta | 0.0119 | 224 | 0.0086 | -233.4 | 4.20% | Weak | 3.70% | ||
| PDO | Barakhan | 0.0462 | -177 | 0.0325 | -185.9 | 5.03% | Weak | -1.57% | |
| ENSO-MEI | Barakhan | 0.0462 | -177 | 0.0437 | -182.5 | 3.11% | Weak | 1.77% | |
| Quetta | 0.0119 | -224 | 0.0161 | -213 | 4.91% | Weak | 3.66% | ||
| IOD | June | Barakhan | 0.0493 | 175 | 0.0485 | 175.6 | 0.34% | Weak | 4.74% |
| EMI | Barakhan | 0.0493 | 175 | 0.1076 | 140.9 | -19.49% | Moderate | -0.34% | |
| EQWIN | Barakhan | 0.0493 | 175 | 0.008 | 210.9 | 20.50% | Strong | 3.94% | |
| OLR | Barakhan | 0.0493 | 175 | 0.0527 | 171.2 | -2.17% | Weak | -2.81% | |
| NAO | December | Khuzdar | 0.0401 | -178 | 0.0574 | -162 | 8.99% | Weak | -0.17% |
Table 8: Influence of climatic index on precipitation trends.
Conclusions and Policy Implications
Precipitation trend analysis of selected stations along the western route having major cities along it route like, Barakhan Quetta, Zhob Khuzdar, and Kalat was studied by both simple graphical and statical methods. Similar trends are observed by both the linear graphs method and statistical techniques the MK method. Trend detection was applied to monthly, annual, and seasonal time series confirming that Baluchistan has received less precipitation in the past few decades and the precipitation pattern is decreasing. This finding is also endorsed by many other studies [16]. The influence of climate indices on precipitation was found to be significant. It was observed that the influences of climate indices are weak in the winter months and moderate to strong in the monsoon months. It was also noted that the climate indices namely MEI, EQWIN, and OLR have noticeable correlations varying from strong to moderate influences on the precipitation trends in the monsoon months (e.g., June). The study also indicates that the climate indices namely MEI and EQWIN are significantly correlated and have a strong influence; thus, they are more appropriate and relevant climate indices than IOD and ENSO-MEI for measuring the influence on precipitation CPEC route [41, 42].
This study is beneficial to National Disaster Management Authority (NDMA), Provincial Disaster Management Authority (PDMA), and Pakistan Metrological Department (PMD). The analysis will give basic information to local inhabitants, provincial government, administration, National Disaster Management Authority (NDMA), Provincial Disaster Management Authority (PDMA), and Pakistan Metrological Department (PMD) to issue early flash flood warnings, take proactive measures in June due to unprecedented precipitation and dryness or drought alert in January due to less rain. This information can be helpful in planning crops or going for re-cropping (dual cropping), ridge farming, and re-sowing technique. As 90% of the grasslands, shrubs, and bushes in Baluchistan are rain-fed. Livestock mostly depends on these grasslands. A decrease in rainfall in the month of January will have a direct impact on this grassland and on the livestock. The model will help them to look for an alternative or plan accordingly by storing food for the livestock, which is the second most common occupation of local dwellers. The livestock contributes 20% of the provincial Gross Domestic Product (GDP). The research paper output information will not only be helpful for the livestock business but to other related industries like leather, carpet, and pharmaceutical which are the leading consumer of livestock products. Baluchistan also fulfills the need and demand for leather tannery and carpet industries in Pakistan by providing a good and constant supply of hiding, skin, and wool. Policymakers can use this research and findings to comprehend the recent conditions, from the perspective of climate change. This research will be a model study for future comparative studies tracing the effects of CPEC and anthropogenic activity on climate change. The research addresses 2 SDGs namely SDG # 11.5 (natural disasters) and SDG#13 (climate action) [43, 44].
Funding
This project is funded by China Study Center, National University of Sciences and Technology, Pakistan.
References
-
Aamir E, Hassan I (2018) Trend analysis in precipitation at individual and regional levels in Baluchistan, Pakistan. In IOP Conference Series: Materials Science and Engineering 414: 012042.
-
Wallace JM, Gutzler DS (1981) Teleconnections in the geopotential height field during the Northern Hemisphere winter. Monthly weather review 109(4): 784-812.
-
Vermeer M, Rahmstorf S (2009) Global sea level linked to global temperature. Proceedings of the National Academy of Sciences 106(51): 21527-21532.
-
Krichak SO, Breitgand JS, Gualdi S, Feldstein SB (2014) Teleconnection–extreme precipitation relationships over the Mediterranean region. Theoretical and applied climatology 117: 679-692.
-
Hussain MS, Lee S (2014) Long-term variability and changes of the precipitation regime in Pakistan. Asia- Pacific Journal of Atmospheric Sciences 50: 271-282.
-
Webster PJ, Toma VE, Kim HM (2011) Were the 2010 Pakistan floods predictable?. Geophys Res Lett 38(4).
-
Bastiaanssen WG, Ali S (2003) A new crop yield forecasting model based on satellite measurements applied across the Indus Basin, Pakistan. Agriculture, ecosystems & environment 94(3): 321-340.
-
Eckstein D, Künzel V, Schäfer L, Winges M (2019) Global climate risk index 2020. Bonn: German watch, pp: 1-50.
-
Sönke Kreft, David Eckstein G (2013) Global Climate Risk Index 2014-Who Suffers Most from Extreme Weather Events?. Weather-Related Loss Events in 2012 and 1993 to 2012, UK Collaborative on Development Research.
-
Liu D, Guo S, Chen X, Shao Q (2012) Analysis of trends of annual and seasonal precipitation from 1956 to 2000 in Guangdong Province, China. Hydrological sciences journal 57(2): 358-369.
-
Athar H (2015) Teleconnections and variability in observed rainfall over Saudi Arabia during 1978–2010. Atmospheric Science Letters 16(3): 373-379.
-
Krishnamurthy L, Krishnamurthy V (2017) Indian monsoon’s relation with the decadal part of PDO in observations and NCAR CCSM4. International Journal of Climatology 37(4): 1824-1833.
-
Liess S, Geller MA (2012) On the relationship between QBO and distribution of tropical deep convection. Journal of Geophysical Research: Atmospheres 117(D3).
-
Afzal M, Haroon MA, Rana AS, Imran A (2013) Influence of North Atlantic oscillations and Southern oscillations on winter precipitation of Northern Pakistan. Pakistan Journal of Meteorology 9(18): 1-9.
-
Iqbal MF, Athar H (2018) Variability, trends, and teleconnections of observed precipitation over Pakistan. Theoretical and applied climatology 134: 613-632.
-
Naz F, Dars GH, Ansari K, Jamro S, Krakauer NY (2020) Drought trends in Baluchistan. Water 12(2): 470.
-
Ashraf M, Routray JK (2015) Spatio-temporal characteristics of precipitation and drought in Baluchistan Province, Pakistan. Natural Hazards 77: 229-254.
-
Ali S, Khalid B, Kiani RS, Babar R, Nasir S, et al. (2020) Spatio-temporal variability of summer monsoon onset over Pakistan. Asia-Pacific Journal of Atmospheric Sciences 56: 147-172.
-
Butt MJ, Iqbal MF (2009) Impact of climate variability on snow cover: a case study of northern Pakistan. Pakistan Journal of Meteorology 5(10): 53-63.
-
Zahid M, Rasul GJSI (2011) Frequency of extreme temperature and precipitation events in Pakistan 1965– 2009. Sci Int 23(4): 313-319.
-
Hanif M, Khan AH, Adnan S (2013) Latitudinal precipitation characteristics and trends in Pakistan. Journal of hydrology 492: 266-272.
-
Ahmad I, Tang D, Wang T, Wang M, Wagan B (2015) Precipitation trends over time using Mann-Kendall and spearman’s rho tests in swat river basin, Pakistan. Advances in Meteorology 2015: 431860.
-
Gadiwala MS, Burke F (2019) Climate change and precipitation in Pakistan-a meteorological prospect. Int J Econ Environ Geol 10–15.
-
Burn DH, Elnur MAH (2002) Detection of hydrologic trends and variability. Journal of hydrology 255(1-4): 107-122.
-
Aamir E, Hassan I (2020) The impact of climate indices on precipitation variability in Baluchistan, Pakistan. Tellus A Dyn Meteorology Oceanography 72(1): 1-46.
-
Machiwal D, Jha MK (2006) Time series analysis of hydrologic data for water resources planning and management: a review. Journal of Hydrology and Hydromechanics 54(3): 237-257.
-
Scarpati OE, Spescha LB, Lay JAF, Capriolo AD (2011) Soil water surplus in salado river basin and its variability during the last forty years (buenos aires province, Argentina). Water 3(1): 132-145.
-
Yang XL, Xu LR, Liu KK, Li CH, Hu J, et al. (2012) Trends in temperature and precipitation in the Zhang weinan River Basin during the last 53 years. Procedia Environ Sci 13: 1966-1974.
-
Chaouche K, Neppel L, Dieulin C, Pujol N, Ladouche B, et al. (2010) Analyses of precipitation, temperature and evapotranspiration in a French Mediterranean region in the context of climate change. Comptes Rendus Geoscience 342(3): 234-243.
-
Verworn HR, Krämer S, Becker M, Pfister A (2008) The Impact of Climate Change on Rainfall Runoff Statistics in the Emscher-Lippe Region. In Proceedings of the 11th International Conference on Urban Drainage 31: 1-10.
-
Towner J, Ficchí A, Cloke HL, Bazo J, Coughlan de Perez E, et al. (2021) Influence of ENSO and tropical Atlantic climate variability on flood characteristics in the Amazon basin. Hydrology Earth Syst Sci 25(7): 3875-3895.
-
Chervenkov H, Slavov K (2019) Theil-Sen estimator vs. ordinary least squares–trend analysis for selected ETCCDI climate indices. Comptes Rendus Acad Bulg Sci 72(1): 47–54.
-
Libiseller C, Grimvall A (2002) Performance of partial Mann–Kendall tests for trend detection in the presence of covariates. Environmetrics: The official journal of the International Environ metrics Society 13(1): 71-84.
-
Van Oldenborgh GJ, Philip SY, Collins M (2005) El Niño in a changing climate: A multi-model study. Ocean Science 1(2): 81-95,
-
Hajani E, Rahman A, Ishak E (2017) Trends in extreme rainfall in the state of New South Wales, Australia. Hydrological Sciences Journal 62(13): 2160-2174.
-
Yadav RK, Rupa Kumar K, Rajeevan M (2009) The increasing influence of ENSO and decreasing influence of AO/NAO in the recent decades over northwest India winter precipitation. Journal of Geophysical Research: Atmospheres 114(D12).
-
Rashid A (2004) Impact of El-Nino on summer monsoon rainfall of Pakistan. Pakistan Journal of Meteorology 1(2): 35-43.
-
Adnan M, Rehman N, Sheikh MM, Khan AA, Mir KA, et al. (2016) Influence of natural forcing phenomena on precipitation of Pakistan. Pakistan Journal of Meteorology 12(24): 23-35.
-
Abraham A, Philip NS, Joseph KB (2001) Will We Have a Wet Summer? Soft Computing Models for Long-term Rainfall Forecasting. In Proceedings of 15th European Simulation Conference ESM, Prague, Czech Republic.
-
Khan AH (2004) The influence of La-Nina phenomena on Pakistan’s precipitation. Pakistan Journal of Meteorology 1(1): 23-31.
-
Hussain MS, Lee S (2013) The regional and the seasonal variability of extreme precipitation trends in Pakistan. Asia-Pacific Journal of Atmospheric Sciences 49: 421- 441.
-
World Meteorological Organization (2014) Intergovernmental Panel on Climate Change. World Meteorological Organization: New York, NY, USA.
-
Nesbitt SW, Anders AM (2009) Very high-resolution precipitation climatologies from the Tropical Rainfall Measuring Mission precipitation radar. Geophysical Research Letters 36(15).
-
Ashok K, Behera SK, Rao SA, Weng H, Yamagata T (2007) El Niño Modoki and its possible teleconnection. J Geophys Res Ocean 112(C11).
- Genetic Improvement of Nile Tilapia (Oreochromis niloticus): Advances in Selective Breeding and Genomic Approaches for Sustainable Aquaculture
- Microplastics, Contaminants, and Waste Hotspots: Divergences and Faults in Prioritizing Control Efforts
- Creating a Healthier, More Vibrant Open and Closed Aquatic Environment. A Submersible, Centrifugal Magnetically Affixed Current Changing Aquarium Pump
- An Attempt to Assess Alpha Diversity and Sample Size: Using the Ostracod Assemblages off Kumamoto Port, Japan
- Assessment of the Efficiency of Common Fishing Gears and Crafts Used at Mohananda River of Chapai Nawabganj, Bangladesh
- Fish Productivity and Biodiversity Status of Sundarban Mangrove in Bangladesh