The Demand Prediction of Water Capacity for Drinking Water Plant by Artificial Neural Network
With the constant progress of the times and the rapid economic and social development, the demand for water consumption in the Hexi area of Xiangtan City is continuously rising. Ensuring the safety of urban water supply has become a crucial task. In this paper, we explore the effectiveness of the artificial neural network model in predicting water demand, leveraging the operational data from a water plant in Xiangtan. Thirty-three parameters are employed in this study to forecast water capacity. The results of our analysis reveal that the back propagation (BP) neural network model offers a more accurate and reliable prediction of water demand. This model, through its iterative learning process, is able to capture the complex relationships and patterns inherent in the water demand data. By adjusting its weights and thresholds based on the error between predicted and actual values, the BP neural network continuously improves its predictive accuracy. The application of the BP neural network in water demand prediction not only enhances the precision of forecasts but also contributes to better water resource management and allocation. It enables authorities to make informed decisions regarding water supply planning, ensuring the reliability and sustainability of the urban water system. The BP neural network model demonstrates its potential in accurately predicting water demand in Xiangtan’s Hexi area, thus contributing to the safety and efficiency of the urban water supply system.
Introduction
Reasonable prediction of urban water supply serves as a fundamental aspect for optimizing urban scheduling and water supply system dispatch. Utilizing mathematical models to accurately establish a water demand prediction model offers distinct advantages and carries significant importance for addressing practical issues related to urban water supply [1]. In recent years, the establishment or selection of a water demand prediction model that combines simplicity in calculation with high prediction accuracy has emerged as a pivotal research direction, especially in the context of water plant reconstruction and expansion design in China. Accurate prediction of water demand can help drinking water plants rationally arrange production plan, optimize equipment operation, reduce energy consumption and cost expenditure, and improve water supply efficiency and service quality. At the same time, timely and accurate prediction of water demand can also help drinking water plants better respond to emergencies and emergencies, and ensure the safety and stability of water supply. The old plant area of Xiangtan No. 1 Water Plant adopts conventional treatment technology, the production technology is relatively backward, and some production equipment is relatively aging, which is difficult to effectively deal with the sudden water pollution of Xiangjiang River. In order to solve the water supply gap in the urban area and ensure the safety of urban water supply, this paper combined with my own work practice in the actual situation of Xiangtan No. 1 Water plant, explored and devoted to the research on the technical scheme of the expansion and quality improvement project of Xiangtan No. 1 Water Plant, and studied the water supply scale of No. 1 water plant by using the water demand prediction model.
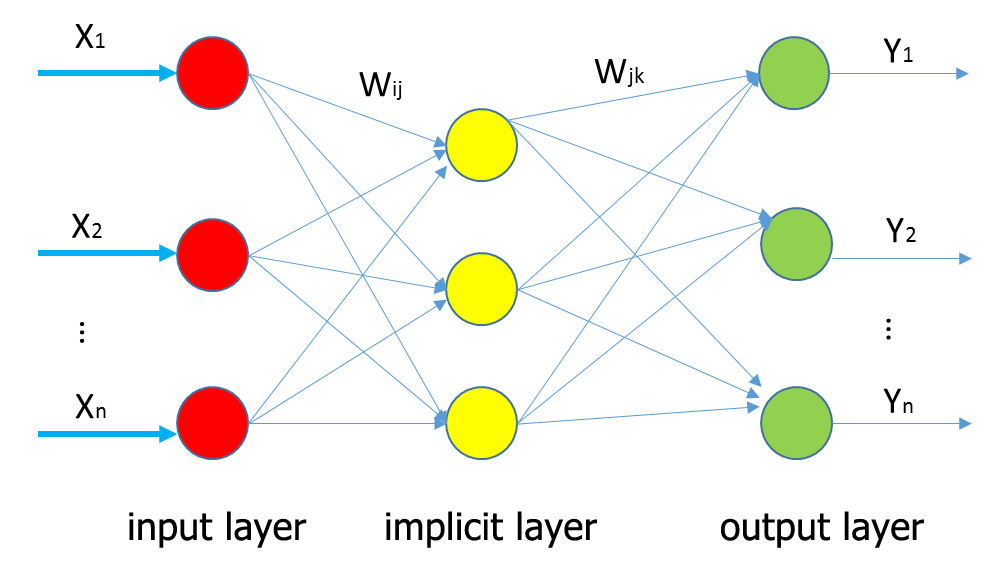
The BP neural network is a multilayer network structure model introduced by Rumelhart and McClelland in 1986. This network utilizes both signal forward propagation and error backpropagation algorithms to train its multilayer architecture. Nowadays, the BP neural network enjoys widespread application due to its effectiveness [1]. During forward propagation, signals traverse the network from the input layer to the output layer, passing through each layer in sequence. These layers are interconnected through network weights and thresholds. By meticulously adjusting these weights and thresholds, we aim to enhance the network’s performance, minimize prediction errors, and gradually bring the network’s outputs closer to the desired target values. Figure 1 illustrates the structure of a BP neural network, clearly depicting its various components and their interconnections. This figure provides a visual representation of how the network operates, enabling a deeper understanding of its inner workings.
Sun, et al. [2] utilized the time series model and incorporated an adaptive mechanism to carry out rolling forecasts of daily water demand for major water plants in Shenzhen City, considering the varying patterns of daily water demand. Yuling Y, et al. [3]
developed two distinct water supply prediction models: a gray prediction model and a time series model, offering diverse approaches to address prediction challenges.
Zheng Z, et al. [4] compared the outcomes of neural network models with differential blocking models for urban water supply prediction, considering factors such as water price, temperature, and time. Jin, et al. [5] focused on the significant impact of weather factors on daily water demand and developed a BP model tailored to this aspect. Wang H, et al. [6] introduced a gray metabolic GM (1, 1) model with low prediction errors and high accuracy for predicting water demand in water-scarce cities over the next decade. Hui Z, et al. [7] enhanced the generalization capability of their model by setting normalization factor convergence coefficients based on predictor extremes normalization. Zewei F, et al. [8] established an improved nonlinear optimization GM (1, N) model and experimentally validated its high accuracy. In related research, Tengrui L, et al. [9] proposed a BP algorithm and network model specifically for predicting water intake in wastewater treatment plants, considering the crucial influence of special events and weather factors. Hongmei N, et al. [10] established four prediction models for Beijing’s water demand, including BP neural network, main gray model, stepwise regression, and component regression methods. Tianliang J, et al. [11] compared the actual water consumption in Minqin County in 2015 and proposed a model that combines the gray-scale model GM (1, 1) with regression analysis to predict both itemized and total water demand. Yang Z, et al. [12] employed the gray prediction GM (1, 1) model to forecast the water demand in Zhangjiakou City, specifically targeting the water requirements of industrial added value, public utilities, and residential life. This approach allowed for a more nuanced understanding of water demand patterns in different sectors. Jiying Z, [13] constructed an ARIMA prediction model, tailored to the rainfall characteristics of Shenyang City from 2005 to 2016. The model capitalized on the city’s rainfall patterns to provide accurate predictions, highlighting the importance of regional context in water demand modeling. Weiwei Z, et al. [14] combined a long-short-term neural network with the Encoder-Decoder method to predict urban water demand. This innovative approach offered high applicability and prediction accuracy, demonstrating the potential of deep learning techniques in water demand forecasting. Guancheng G, et al. [15] introduced a water quantity prediction method using deep learning, addressing the stability and accuracy issues associated with traditional artificial neural network models. This advancement represents a significant step forward in water demand prediction technology. Tinghong L, et al. [16] employed ARIMA seasonal time series analysis to model urban water demand, taking into account parameters such as partial autocorrelation coefficient (PACF) and autocorrelation coefficient (ACF) to identify the optimal model structure. This approach allowed for a more accurate representation of seasonal variations in water demand. Yajun Zhang, et al. [17] conducted a gray prediction of water demand in Beijing, revealing the conditions for the effective application of the GM (1, 1) model. Their findings provided valuable insights into the suitability of this model in different contexts. Hua G, et al. [18] applied gray theory to establish the GM (1, 1) model and analyzed the residual theory to forecast urban water demand in their study area. This approach combined theoretical principles with practical considerations to produce accurate predictions. Chiwen Q, et al. [19] utilized an optimized generalized regression neural network model to predict urban water demand in Nanning City. This optimized model offered improved prediction capabilities, tailored to the specific needs of the city. Zengfu C, et al. [20] employed the BP artificial neural network method to predict urban water demand in Aksu, achieving satisfactory results. This approach demonstrated the effectiveness of neural network models in water demand prediction. These studies demonstrate the diverse range of approaches and models that have been developed to accurately predict water demand, taking into account various influencing factors. Each model has its unique strengths and applications, depending on the specific context and requirements of water supply prediction.
In this study, we conducted a thorough investigation on the effectiveness of the BP neural network model in predicting water capacity, considering 13 crucial input parameters. These parameters, which play a pivotal role in determining water demand and supply, were carefully selected based on their significance in the water plant’s operational data.
Data and Model Architecture
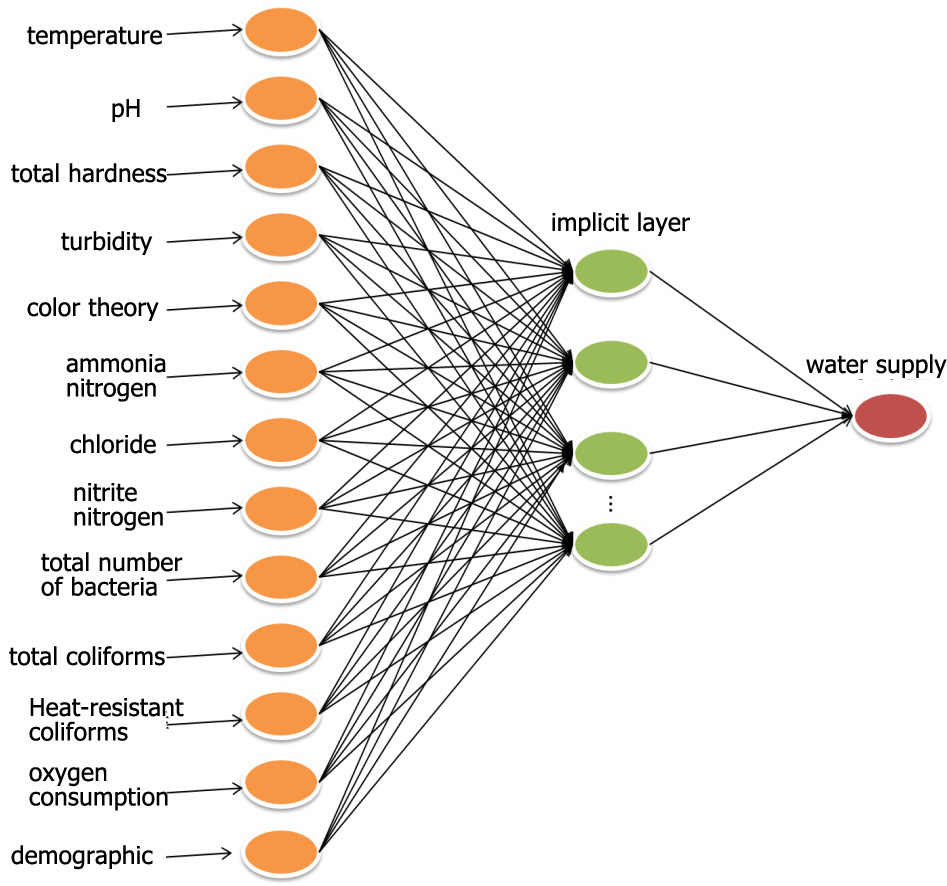
In this study, data is collected from the testing data of actual drinking water plants and water quality parameters such as turbidity, CODMn, total hardness, chloride, and total bacterial population of the source water of the plant from November 2020 to June 2021 were taken as inputs to the BP neural network. The total number of input neurons is 13 and the predicted water demand is output from the network as target value. This study used Matlab R2010b tool platform to build the basic BP neural network prediction model, which consists of input layer, output layer and hidden layer. The number of hidden layers of the network was optimized using the following equation.
$$ L < n - 1 \tag {1} $$
Where L is the number of implied layers, and n is the number
of input layers.
Based on the historical population growth data of Xiangtan City from 2015 to 2019, which revealed an average natural population growth rate of 4.24‰, we have projected the population size within the water supply area of the first water plant in 2030 to be approximately 544,300 people, assuming a continuous growth trend from the current population of 524,000 in 2021. Given the strong regularity observed in population growth patterns, we have developed a model construction approach that utilizes a time-series prediction model. This model allows us to leverage the current year’s data to forecast future water demand, effectively capitalizing on the latest available information. Specifically, we trained our model using 2020 data and randomly selected a subset of 2021 data for validation. This approach offers a novel perspective on predicting future water demand, enabling us to fine-tune our predictions based on recent trends. The structure of the BP neural network model constructed in this study is depicted in Figure 2. This model incorporates 13 crucial input parameters, ensuring a comprehensive and accurate prediction of water capacity.
By employing this innovative prediction framework, we aim to provide decision-makers with reliable and timely insights into future water demand, enabling them to make informed decisions regarding water resource management and allocation. This approach not only enhances the efficiency of our water supply system but also contributes to the sustainability of urban development in Xiangtan City.
Data Preprocessing
Normalizing the data is an essential step in machine learning to ensure that different parameters or features are on a comparable scale. This is particularly important for neural networks, as they can be sensitive to the magnitude and range of input values. By normalizing the data, we can improve the accuracy, convergence, and consistency of the water demand prediction model. Normalization also helps to reduce the influence of individual parameter indicators on the training and testing of the network model, mitigating the effects of data scale inconsistencies. Equation 2, which you mentioned for normalization, typically involves transforming the original data values to a common scale, such as the interval [0, 1]. This transformation ensures that all parameters contribute equally to the training process, allowing the model to learn from the data more effectively.
$$X'_i = \frac{X_i - X_{\min}}{X_{\max} - X_{\min}}$$
Where $X_i$ is the sample data; $X_{\max}, X_{\min}$ are the maximum and minimum values of the sample data, respectively. $X_i$ is normalized data. The 80% of the normalized data are used as training samples and 20% are used as test samples.
**Accuracy Assessment**
In this study, the correlation coefficient ($R^2$) and the root mean square error (RMSE) are utilized (See Eqs. 3 and 4). The $R^2$ serves as an indicator of the degree of correlation between the measured values and the simulated values. The closer $R^2$ is to 1, the more effective the simulation is, indicating a strong overall correlation between the simulated and measured values, with generally close approximations. On the other hand, RMSE quantifies the deviation of the real values from the simulated ones, providing a measure of the accuracy of the simulations.
$$R^2 = \frac{\sum_i \left( P_i - \bar{O} \right)^2}{\sum_i \left( O_i - \bar{O} \right)^2}$$
$$RMSE = \sqrt{\frac{1}{N} \sum_{i=1}^{N} \left( P_i - O_i \right)^2}$$
Where $N$ is the number of samples, $P_i$ and $O_i$ are the predicted and measured values, respectively. $P_i$ and $O_i$ are the predicted and measured values, respectively. $\bar{O}$ is the measured average value.
**Results and Discussion**
In this study, water demand is accurately predicted using a BP neural network model. The model comprises 13 input neurons, 9 hidden layer neurons, and 1 output neuron, with a learning rate set at 0.1.
After conducting 1000 iterations of training, simulation results were obtained and are presented in Figures 3 & 4. As depicted in Figure 3, the correlation coefficients ($R^2$) between the predicted and measured values stand at 0.7419 for the training samples and 0.7095 for the test samples, respectively. These results indicate a good correlation between the measured values and the simulated values, further supported by a statistical analysis ($P > 0.05$), which suggests no significant difference exists. Additionally, the test results reveal an RMSE value of 11.47, with an RMSE percentage relative to the measured mean value being 8.15%. This percentage falls below the acceptable range of error (generally considered good at less than 20% and excellent at less than 10%), indicating that the model performs well and produces reliable predictions.
Figure 3: (a) Correlation between measured and simulated values of the training sample, and (b) correlation between measured and simulated values of the test sample.
As demonstrated in Figure 4, the simulated values closely align with the measured values in both the training and prediction results. The trends are consistent, and the magnitudes are comparable, resulting in a good match. This indicates that the model exhibits a high-quality simulation
200 (a) Water supply(x1000t)
effect and is effectively able to predict the trend and level of changes in water demand using the available data information. In summary, the model performs well and provides reliable insights into water demand patterns.
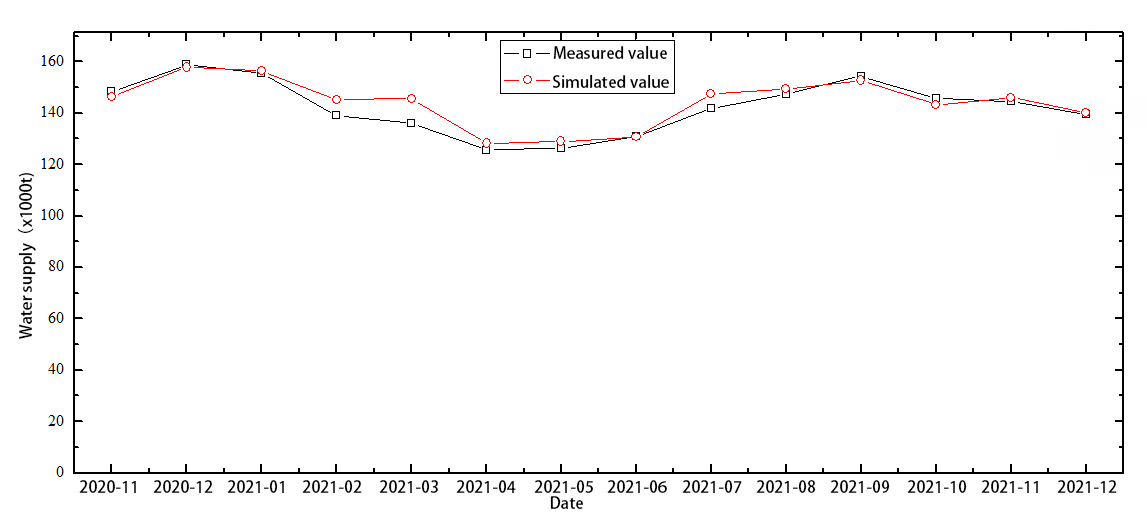
The prediction of average data from November 2020 to December 2021 was thoroughly studied and analyzed using the existing model to assess its overall effectiveness. The results, presented in Figure 5, reveal that the monthly average data predicted by the model closely aligns with the simulated values compared to the measured values. This finding further validates the model’s reliability in predicting the sample data, ensuring that the results are not influenced by anomalies. Additionally, it demonstrates that the memory pattern of the sample data can be effectively stored and represented by the existing BP model. In summary, the model exhibits consistent performance in predicting water demand patterns, providing reliable insights for decision- making purposes.
Conclusions
Given the limited planning land available for the water plant in Xiangtan City, it is imperative to maximize the potential of engineering construction to expand production capacity while emphasizing the importance of conserving land resources. This paper comprehensively integrates the urban master plan of Xiangtan City, the specialized planning for the water supply project, and the current state of the city’s water supply system. It particularly focuses on a systematic analysis of issues pertaining to the western riverbank. Drawing upon relevant national standards and technical specifications, this paper also incorporates domestic and international advancements in water supply and treatment technology. By taking the first water plant in Xiangtan City as a case study, we demonstrate the effectiveness of the BP neural network model prediction method. This approach not only offers a reliable forecast of water demand but also provides a novel methodology for predicting the required water capacity of drinking water plants. The application of the BP neural network model in this context allows for more accurate predictions, enabling authorities to make informed decisions regarding land use, engineering construction, and water resource management. By efficiently utilizing limited land resources and optimizing production capacity, we can ensure the sustainable and reliable operation of the urban water supply system in Xiangtan City.
References
-
Feng X (2008) Application of mathematical modeling method in urban water supply prediction. Journal of Changchun University 18(12): 49-50.
-
Ping S, Liping W, Kai C (2013) A method for predicting the day-by-day water demand process of waterworks based on the time series model ARMA. China Rural Water Conservancy and Hydropower 11: 139-142.
-
Yang YL, Zhu K, Li MC (2008) Prediction of urban water supply. Journal of Neijiang Normal College 23(S2): 42- 43.
-
Zheng Z, Jiayan T, Zhimin L (2008) Mathematical modeling of urban water supply prediction. Water Supply Technology (2): 11-15.
-
Jianhua J, Yixiong SHI, Yonggang SHI (2005) Construction of an urban water demand prediction model based on BP neural network. Urban Management and Technology (1): 29-31.
-
Hongyu W, Fang MA, Kai Y (2004) Application of gray metabolic GM (1,1) model in medium and long- term urban water demand forecast. Journal of Wuhan University (6): 32-35.
-
Hui Z, Xiaolong L, Dongyue L (2021) Fishing strategy optimization of SVR for urban water demand prediction model. Journal of Shijiazhuang Institute of Vocational Technology 33(4): 18-22.
-
Zewei F, Yinke Y, Tianyao W (2019) Prediction of urban domestic water demand in Haiyan County based on improved nonlinear optimization GM(1,N) model. Hydropower Energy Science 37(10): 44-47.
-
Tengrui L, Yuzhao F, Jinsong G (2001) A prediction method for daily water intake of wastewater plants considering uncertainties. China Water Supply and Drainage (5): 1-5.
-
Hongmei N, Jianjun Z, Xingju L (2019) Comparison of urban water demand prediction algorithms. Software Guide 18(10): 69-73.
-
Tianliang J, Hengjia Z, Yuanyuan S (2018) Water demand prediction in Minqin County based on regression analysis and gray scale model GM (1,1). Northwest Hydropower (4): 4-9.
-
Yang Z, Jiexiao S, Huiling H (2014) Application of gray prediction GM (1,1) model in water demand prediction in Zhangjiakou City. Hydropower Energy Science 32(07): 40-43.
-
Zhang JY (2019) Time series analysis of monthly precipitation in Shenyang city based on ARIMA model. Inner Mongolia Water Resources (6): 13-14.
-
Weiwei Z, Pingwei Z, Jingcheng W (2019) Application of urban water demand prediction based on long and short- term neural networks. Water Purification Technology 38(S1): 257-260.
-
Guancheng G, Shuming L, Junyu L (2018) Research on water quantity prediction method based on bi- directional long- and short-term neural networks. Water Supply and Drainage 54(3): 123-126.
-
Tinghong L, Qiujuan L, Jingcheng W (2008) Water demand prediction based on ARIMA time series identification. Control Engineering (S1): 162-164.
-
Yajun Z, Quansheng L (2002) Discussion on gray prediction of urban water demand. China Water Supply and Drainage (3): 79-81.
-
Hua G, Jinpeng C (2018) Modeling of urban annual water demand prediction based on gray system theory. Water Resources Science and Economy 24(12): 69-72.
-
Chiwen Q, Yanming Fu, Jun D (2014) Application of improved CS-GRNN model in urban water demand prediction. Journal of Southwest Normal University 39(9): 127-132.
-
Zengfu C, Xiaoning X (2011) Prediction of urban water demand in Aksu city based on BP neural network model. Energy and Environment (4): 24-25.
- Genetic Improvement of Nile Tilapia (Oreochromis niloticus): Advances in Selective Breeding and Genomic Approaches for Sustainable Aquaculture
- Microplastics, Contaminants, and Waste Hotspots: Divergences and Faults in Prioritizing Control Efforts
- Creating a Healthier, More Vibrant Open and Closed Aquatic Environment. A Submersible, Centrifugal Magnetically Affixed Current Changing Aquarium Pump
- An Attempt to Assess Alpha Diversity and Sample Size: Using the Ostracod Assemblages off Kumamoto Port, Japan
- Assessment of the Efficiency of Common Fishing Gears and Crafts Used at Mohananda River of Chapai Nawabganj, Bangladesh
- Fish Productivity and Biodiversity Status of Sundarban Mangrove in Bangladesh