Commercializing Beef Sub-Sector in Arusha and Dar-es-Salaam Cities, Tanzania: Consumers’ Preferences and Willingness to Pay for Quality Beef
Tanzania has huge livestock resource base of cattle herds amounting to 28,435,825; diverse feeds to satisfy 4.9m TLU annually and several modern slaughter houses. Despite its importance, the sector is used sub-optimally with over 95% of cattle produced traditionally to meet subsistence needs. Several efforts geared to commercialize the sector were supply driven in nature with limited consumers’ needs on board. To date there is limited information on preferences of consumers on quality beef (QB) products among consumers; and how would they react to the variation of its prices. Therefore this paper examined consumers’ preferences, their willingness to pay (WTP) and motives behind WTP for QB produced locally in Dar-es-Salaam and Arusha cities. Cross sectional design was used to collect data from 278 households that were analyzed through Principal component Analysis and multiple regression models. Findings revealed that 70% of beef consumers preferred fresh unrefrigerated beef with low fat content; and 91% were not willing to pay for QB because their definition of QB differs from that of QB suppliers. Additionally, the price of QB influenced consumers’ WTP negatively at 5% significant levels. It is recommended that QB suppliers design and supply a range of beef products tailored to meet needs of traditional beef consumers while championing creation of awareness among traditional beef consumers to demystify the wrong perception QB attributes among them.
Introduction
Tanzania is endowed with huge livestock resource base that includes a large cattle herd, feeds and modern slaughter houses. The country ranks third in terms of cattle population in Africa after Sudan and Ethiopia with 28,435,825 head count [1] and accounts for 11% of the African cattle population [2]. MOALF [1] revealed that beef accounted for a major portion (71%) of meat produced in the country in 2016/17 that stood at 394,604 metric tons.
Agricultural by-products that are not used for human consumption that can be used to feed animals are abundant in Tanzania. Lukuyu, et al. [3] estimated maize stovers produced in the country to be enough to feed 4.9 million TLU for 247 days. Coupled with production of improved seed varieties of pastures that counts to the tune of 50 tons annually and 1,201,350 bales of hays per annum [4] is enough to commercialize the sector particularly beef. Besides abundant feeds, there are sixteen meat processing plants with daily cattle slaughtering capacity of 4,040 cattle heads [5]. However, the meat processing plants are operating below capacity by 50% [6]. The National Sample Census of 2012 revealed that 50% of Tanzanian households (4.6millions) raised at- least one type of livestock with 35% keeping cattle [7]. If the proportion of households raising livestock is kept constant, commercialization of the livestock sector would improve the livelihood of at-least one third of all Tanzanians to date.
Despite its importance, there has been sub - optimal use of the huge livestock resource base countrywide as the sector contributes only 7.4% to the national GDP [8]. During the mid-2000s, more than 95% of animals were raised through traditional extensive production system [9] that is characterised with low productivity along the entire supply chain [10, 11]. The traditional extensive production system is known for its subsistence nature whereby cattle are raised all the way through up to slaughter age by trekking through long distances in search of water and natural pastures, usually exhibiting an oscillating type of growth, attaining low slaughter weight at an advanced age of 5 to 7 years ending up often producing tough meat and of poor quality [12, 13].
In response to this situation a number of efforts have been made by the government and researchers to address underutilization of livestock resource base in terms of number of animals and processing facilities for commercialization of the livestock sector. These efforts are hinged on Tanzania Development Vision 2025 [14]. One of the statements in TDV of 2025 states that “By year 2025, there should be a livestock sector, which to a large extent shall be commercially run, modern and sustainable, using improved and highly productive livestock to ensure food security, improved income for the household and the nation while conserving the environment.” Hence launching of National Livestock Policy 2006 was to commercializing the sector. In line with the National Livestock Policy 2006; various instruments were formulated to implement the policy. These are clustered into three main blocks (i) Institutions for facilitation of proper implementation of the Policy, (ii) Legislations (Acts and regulations) governing meat industry; and (iii) Strategies and Programs enhancing implementation of the policy.
The institutions formed include Tanzania Livestock Research Institute (TALIRI), Tanzania Meat Board (TMB), Tanzania veterinary Laboratory Agency (TVLA) and Tanzania Livestock Training Agency (LITA). TALIRI was established in 2012 to coordinate and conduct livestock researches that provide technologies for improve and sustaining the development of livestock sector. Tanzania Meat Board was established in 2008 spearhead the restructuring of the meat industry. TVLA was established in 2012 to promote animal welfare through delivery of diagnostic services, disease surveillance, animal diseases and vector control research. Meanwhile LITA was formed to enhance the performance of the former livestock Training Institutes in provision of quality training, production, applied research and consultancy services.
The strategies and programs adopted to implement the NLP 2006 to date include (i) Livestock Sector Development Strategy 2010, Livestock Sector Development Program 2011, Tanzania Livestock Modernization Initiatives 2015 and Tanzania Livestock Master Plan 2018. Legal and regulatory framework made include formation of the following laws, rules and regulations: The Acts and regulations governing livestock sector include: Veterinary Act No. 6 of 2003, Animal Disease Act. No. 10 2003; Meat Industry Act. No 10 of 2006, Hides and Skin Act. No. 18 of 2008, Animal Welfare Act. No. 19 of 2008, Livestock Identification, Registration & Traceability Act. No. 12 of 2010 and Grazing Land and Animal Feed Resources Act. No. 13 of 2010.
Despite various initiatives adopted by the government to commercialize the livestock sector, the sector is still dominated by traditional production system by 97% [1] such that the nation still imports substantial amount of beef and their products. The Citizen newspaper of January 25 2018 reported that a number of five-star hotels and supermarkets in Tanzania import meat from as far as Netherlands, Australia and South Africa and ignore those produced within the country due to mismatch of quality standards preferred by customers [15]. In fact Tanzania imported 512 metric tons of beef in 2016/17 [1]. The money spent on importation of beef limits commercialization of the beef sector and depletes the limited foreign currency estimated at an import value of $674,800 annually. This accounts for 17% of the total meat imports [16]. Moreover, importation of beef is accompanied with underutilization of local beef processing factories where they operate at 50% of installed capacity; with only 2% of beef produced being processed country wide while the remaining beef is sold warm and undifferentiated [17]. Moreover, non- commercialization of the livestock sector is coupled with lost net income of about $5 and $292 per animal and per heard respectively [17]. URT [17] further estimated that commercialization of livestock would lead to reduction of poverty rate to 17% among households commercializing cattle sector compared to poverty prevalence rate of 24% among households practicing subsistence cattle farming. The report further concluded that commercialization of livestock sector would lead to increased aggregate household income by over USD 286 million per year and the value of livestock added would increase by almost 190% coupled with substantial reduction in poverty levels.
Non-commercialization of livestock sector and beef industry in particular is assumed to be consumer driven kind of paradox. As can be seen previously efforts on commercialization of the sector was associated with supply driven initiatives. These initiatives are associated with considerable number of studies focusing on productivity and value addition along the beef supply chain [18, 19, 20, 21, 22].
Based on literature reviewed, information on consumer preferences and purchasing power in various consumer segments is limited [23, 24]. It is not clear as to what extent quality beef products could be sold to a wider group of consumers and how would consumers react to the prices of quality beef. With this information it becomes clear that a sustainable improvement of beef industry and its commercialization rests on understanding the consumers’ preferences. To the knowledge of the author, Mapunda FM [25] Nandonde et al. [23] is the only study conducted on consumer preferences and WTP for beef in Tanzania. Nevertheless the study was done in southern highland regions of Tanzania that is relatively peri-urban towns of the country. This paper explores consumers’ preferences and examines their WTP for quality beef produced locally in the country’s major cities of Dar-es-Salaam and Arusha. These are locations where there is relatively mixed cultural context due to various ethnicity residing in the cities and large proportion of high-income earners including prominent business men, highly paid workers and expatriates who are potential consumers of quality beef. According to Nandonde S, et al. [26] TRA [23], Dar- es-Salaam city accounted for 70% of internal Government revenue collections in the country for a period between 1997 and 2011. On the other hand, Arusha city was chosen due to its proximity to major tourist attractions in the country such as Kilimanjaro Mountain, Ngorongoro conservation area, Lake Manyara and Serengeti National Parks that makes Arusha the hub of most tourists in Tanzania. Hence, income from the tourism industry allows multiplier effects for income growth of Arusha region to permit consumption of quality beef. Specifically the paper determined beef quality attributes preferred by consumers, assessed consumer’s willingness to pay and determined motives behind the willingness to pay for the beef.
Methodology
Analytical Framework
Conceptually, the consumer preference analytical technique assumed the utilitarian consumer theory whereby the consumer was assumed to be rational such that s(he) consumes quality beef with intrinsic and extrinsic attributes that yield him/her the maximum utility. Previous literature suggested that Tanzanian beef consumers’ preference attributes include tenderness, freshness, fat content, price, and hygiene of retailing outlets and safety of the product [26, 27]. Other meat quality attributes were revealed to include meat colour, sources of beef (warm butchers vs. supermarkets and modern butchers), and presence of municipal stamps catering for beef being inspected and hence its suitability/safety for human consumption [28]. Hence intrinsic features of quality beef included in the analysis are freshness, fat content, tenderness and colour of beef, while extrinsic features of quality are hygienic condition of retailing outlets, price and presence of municipal stamps on the beef sold (Equation 1).
Ụi= f (Pi, INTi, EXTi, M, α)…………….…………… (1)
whereby: Ụi is the utility of consumer, Pi, is the vector of prices, INTi, is the vector of intrinsic characteristics of beef, EXTi, is the vector of extrinsic characteristics of beef, M is the vector of expenditure levels of consumers and α is the vector of household characteristics influencing consumers’ preferences. The intrinsic characteristics included freshness, fat contents, color and tenderness of beef sold in retail outlets, while extrinsic characteristics included in the model are levels of hygienic condition of the retail outlets, price and presence of municipal stamps on the retailed beef.
Likert – scale measures were used to quantify importance of quality attributes preferred by beef consumers: 1 - strongly important to 5 – strongly unimportant) on the quality attributes stated. Then frequency distribution was done on beef consumers’ preference attributes stated. Percentages for respective quality attribute were computed and presented in charts.
Principal Component Analysis (PCA) and Wards Method of hierarchical analysis were used to cluster consumers in terms of attitudes and/or preferences towards major beef quality attributes.
The willingness to pay has been estimated through two major approaches: revealed preference (RP) and stated preference (SP) techniques. The RP techniques involve observation of prices that people pay for goods and services in various markets; and expenditures of their economic resources such as money, time and labour to obtain the goods and/or services or to avoid their losses [29]. The WTP for quality beef was elicited using stated preference technique that entails the use of respondents’ statements about their willingness to pay for a particular good or service [30]. The strength of using SP approaches is due to their applicability to wider disciplines in which consumer behavioral responses are either not available or was difficult to assess substantially attributes associated with Revealed Preference techniques [31, 32].
Stated preference techniques can further be classified into direct and indirect models of estimating WTP. Direct approach is executed when respondents are asked directly to indicate their maximum WTP for a good or service offered. Alternatively, indirect approach is done when respondents are presented a good or service with different profiles accompanied by different price levels to indicate whether or not he/she would pay for a product. Direct approaches have been noted to have serious shortcomings in eliciting consumers’ willingness to pay [33, 34]. Therefore, indirect approaches have been adopted in this study.
Two major approaches of eliciting WTP indirectly are Conjoint Analysis (CA) and Contingent Valuation Method (CVM). The Conjoint Analysis involves the stated choice experiment whereby respondents are asked to make choices on goods with different attributes and levels accompanied with various price levels [35]. The Conjoint Analysis is known to be incentive neutral in revealing the true WTP of respondents since a respondent has a tradeoff among entire price/performance of bundles [36]. However, the approach is acknowledged to have some shortcomings in eliciting respondents’ WTP: (i) In CA, WTP values are elicited using combination of different product attributes that might lead to inaccurate estimate if the choice of estimation technique is wrongly specified. (ii) The CA estimates part-worth for discrete price levels while WTP is a continuous variable that necessitates deduction of the respondents’ utilities other than those specified in the research design [37]. Moreover, the CA approach treats price as an attribute in estimating part- worth utilities. The inclusion of price as an attribute violates neoclassical economic theory of consumer behavior whereby price is treated as exogenous variable that can be included in the model through budget constraint [38].
The Contingent Valuation Method (CVM) is a survey/questionnaire based approach which asks respondents their WTP for market and non-market goods and services [39]. The CVM approach elicits stated preferences from a sample of consumers using either open ended questions that directly asks for WTP, or referendum (closed ended) questions that presents a bid to the respondent and asks for a Yes or No vote on the bid subjects to WTP [40]. In this approach, the stated preference is commonly used as a mean value of WTP [41].
The CVM has proved to be a reliable approach in eliciting peoples’ WTP through dichotomous choice model [42]. It has been applied in agricultural and food economics to elicit WTP for foods regarding safety measures [43, 44, 45, 46, 47]. For that case, this study applied CVM to examine the WTP of quality beef in Arusha and Dar-es- Salaam cities among household beef consumers.
Therefore, estimation of WTP for quality beef was done using contingent valuation method (CVM). This CVM was done through double bounded model of dichotomous choice questions. It was assumed that a respondent i had unobserved true WTP for quality beef equal to Yi*. The true WTP Yi* for quality beef had some relationship with the household head characteristics Xi as specified in equation 2.
Yi* = Xiβ + εi …………………. (2) Whereby εi is assumed to be normally distributed with mean zero and variance δ2. The functional form of true WTP was specified as Tobit model since the dependent variable cannot assume negative values because the respondent would either decide to buy quality beef (1) or decide not to buy quality beef (0).
Each respondent was initially asked whether he/she was willing to purchase conventional beef and/or quality beef at the same price, that is, the price differential (PDI) equals to zero. If the respondent indicated a preference on quality beef, s(he) was further asked whether s(he) is willing to pay a premium bid, that is, the price differential (PDH) is greater than zero [48]. Bids incremental were 33%; 66% and 100% due to the fact that, there are increased costs in fattening of cattle and ageing of beef to make it tender leading to an increased price of quality beef marketed. The true WTP Yi* for quality beef is not known but lies between PDI and PDH due to responses given to the series of contingent valuation questions; and is specified in equation.
Pr (PDI ≤ Yi* ≤ PDH) …………....... (3) When replacing the true WTP value for quality beef Yi* with equation (3), then the function can be written as in equation (4).
Pr (PDI ≤ Xiβ + εi ≤ PDH) ………………. (4)
The outcome of bidding procedures is presented in equation 5 due to three expected outcomes of the contingent valuation questions. That is, (i) A ‘No’ to the first bid (i.e. no preference for quality beef vs. conventional beef) at 0 premium. (ii) A ‘Yes’ followed by ‘No’ (i.e. there is a preference at 0 price difference but not at higher bid) and (iii) A ‘Yes’ to both bids (i.e. preference at 0 premiums and at higher bids) Yi* ≤ PDI (outcome 1) Di = PDI≤Yi*<PDH (outcome 2)………………. (5) PDH ≤ Yi* (outcome 3) The choice probabilities for true WTP for equation 4 are expressed in equations 6 to 8. P (Yi*≤ PDI) = P(εi ≤ PDI - βi Xi ) = F(PDI - βi Xi ) ……... (6) P(PDI ≤ Yi*< PDH) = P(PDI - βi Xi ≤ εi< PDI - βi Xi) = F(PDH - βi Xi) – F(PDI - βiXi …….... (7) P(PDH ≤ Yi*) = P(εi> PDH - βi Xi) = 1 – F(PDH - βi Xi) ….... (8) The stated probabilities specified in equations 6-8, yield the log likelihoods presented in equation 9. L=∑ lnF[(PDI - βiXi)]+∑ lnF[(PDH - βiXi) – F(PDI - βiXi)]
1 D
2 D + ∑ ln[1– F(PDH -βiXi)]........ (9)
3 D Where: Di – is a group of respondents in the ith bidding process outcome, F – is a cumulative distribution function with mean zero and variance δ2 and P – is the choice of probabilities corresponding to equation 5 Estimation of model parameters employed censored regression approach for the estimation of closed ended questions of contingent valuation surveys as developed by Juma GP, et al. [49]. Specifically, Tobit model was used to examine factors influencing WTP for quality beef consumers and was specified as equation 10. Yi* = β0 +β1HHI+β2HHV+β3HHS+β4HHA+β5HHO+β6HHE+β7HHM+ εi …. (10) Whereby; β0 is the equation constant term, βi is the parameter coefficients of the model to be estimated, HHI – is the expenditure of household head, HHV – the size of household, HHS - sex of household head, HHA - age of household head, while HHO, HHE and HHM are occupation, educational level, and marital status of household heads respectively; and εi is the error term that caters for the effects of variables not included in the model. Table 1 presents model explanatory variables and the expected relationship with WTP for quality beef.
| Variable name | Units | Variable description | Expected signs | |||||||||
|---|---|---|---|---|---|---|---|---|---|---|---|---|
| X 1 | Household expenditure | Number | Expenditures of household per year in Tsh | + | ||||||||
| X 2 | Household size | Number | Number of members in the household | - | ||||||||
| X 3 | Sex of household head | Binary | 1 if the household head is female, 0 otherwise | - | ||||||||
| X 4 | Age of household head | Number | Age of household head in years | + | ||||||||
| X 5 | Occupation of household head | Dummy | 1 if the household head is employed, 0 otherwise | + | ||||||||
| X 6 | Education level of household head | Dummy | 1 if the household head has tertiary education, 0 otherwise | + | ||||||||
| X 7 | Marital status of household head | Dummy | 1 if the household head is married, 0 otherwise | + |
Table 1: Definition of variables in WTP model and expected relationship Table 1: Definition of variables in WTP model and expecte
Table 1: Definition of variables in WTP model and expected relationship Table 1: Definition of variables in WTP model and expected relationship Household size was assumed to have a negative influence on willingness to pay for quality beef. This is because large households were expected to spend their resources on basic needs since the households require huge basic needs and other protein foods that are less expensive than quality beef. Findings of empirical studies suggest that there is a negative relationship between household size and WTP for quality foods [50, 52, 53].
With regard to sex of household head, previous studies suggest a positive relationship between WTP for quality foods and female headed households [44, 51, 54]. In this study, a negative relationship was hypothesized between female headed household and WTP for quality beef. This is due to the fact that women have poor access to the means of production and high paying jobs [55] that could allow them to earn higher incomes and thus increase the likelihood of paying premium prices for quality beef.
The body of literature portrays conflicting relationship between WTP and quality foods. Some authors revealed a positive relationship between age and WTP for foods [48], while others revealed negative associations between age and WTP for quality foods [50, 56, 57]. In this study, age of the household head was expected to have a positive relationship with WTP because as one gets older, s(he) develops skills to perform his/her job better, gets promotion in his/her carrier and increases his/her purchasing power. The increase in purchasing power is associated with higher likelihood of paying premium prices for quality beef.
Education level of household head was expected to have a positive influence on WTP for quality beef. This is because an increase in education level leads to more exposure of consumers that create awareness on quality beef attributes. Moreover, highly educated people are likely to get well-paying jobs which can in turn lead to high likelihood of purchasing quality beef. Previous studies [43, 53, 56] revealed a positive association between education levels and WTP for premium priced foods.
Lyford C, et al. [56] found a negative relationship between marital status and WTP for quality foods. In this study, a positive relationship was hypothesized between marital status and WTP for quality beef because married couples can pull together resources accrued for common consumption of the household hence increased purchasing power. The increase in purchasing power increases the likelihood of the household’s willingness to pay a premium price for quality beef.
Sampling
A multi-stage cluster sampling technique was used. In the first stage, municipals and districts were chosen from the sampled regions. In Dar es Salaam; Kinondoni municipal was selected as a case study because it has the most diverse society with different income levels including high income earners who are likely to consume quality beef. On the other hand, in Arusha region; Arusha
municipality was selected based on the fact that its residents have higher incomes compared to other districts in the region. This is because, the municipal serves as the Arusha regional economic base whereby most organizations that employ highly paid expatriates exist; and it is the centre for the regional business activities that allow income multiplier effect among its residents.
In the second stage, wards under study were selected. In Kinondoni; Tandale and Manzese wards were chosen to cater for low income households while Sinza and Msasani wards were chosen to cater for households with middle and high income respectively. In Arusha, Unga Ltd, Kaloleni, and Lemara wards were included in the sample to represent wards with low, middle and high income households respectively.
In the third stage, proportionate stratified sampling technique was used to select household respondents. Proportionate stratified sampling was used to obtain a sample comprising of clusters of respondents with different characteristics such as sex, education, occupation and income levels.
Data Collection
Primary data were collected using structured questionnaires for five months between February and June, 2012. Appointments were made two days before the date of interview through Wards Executives. Interviews with household heads/representatives took place at their homes.
Results and Discussion
Consumer Preferences for Quality Beef
A sample of beef consumers were asked to rank different quality attributes taken into consideration when buying beef. Figure 1 displays consumers’ ranking of quality attributes according to their order of importance. ‘Freshness’ attribute scored the highest rank of being ‘strongly important’ as it was considered by consumers when purchasing beef. This finding supports the finding by Teklebrhan T, et al. [59] who found that freshness was among quality attributes preferred by consumers of beef in Germany. The ‘less fat content’ quality attribute was ranked second to ‘freshness’ among sampled household beef consumers in the study area (Figure 1). This finding supports the finding by CIRAD [60] who found that beef consumers in Ethiopia preferred lean and red meat color than fat and white meat.
Cleanliness of retailing outlet facilities attribute ranked third after ‘freshness’ and ‘less fat content’ attributes. The sampled household beef consumers relied on cleanliness of retailing outlet facilities as a safety measure of the beef they bought. This is because interviewed consumers had no alternative mechanism of measuring beef safety. Few beef consumers looked at municipal stamps which could act as a safety measure for the consumers. This finding supports the finding by Kamugisha PP [27] Nandonde et al [26] who found hygiene among retailing outlet facilities as the most important valued attribute among beef consumers in the southern highlands of Tanzania.
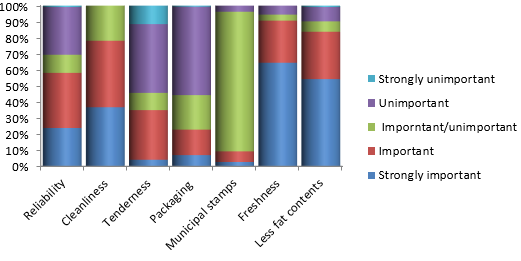
Table 2 shows that respondents in Dar-es-Salaam preferred to consume beef with less fat content as opposed to Arusha beef consumers who preferred beef with relatively higher fat content. Cold weather condition might be the reason behind Arusha consumers’ preference of beef with relatively higher fat content than their counter parts in Dar-es-Salaam. CIRAD [60] reported similar findings in Ethiopia whereby lean meat (red in color) was most preferred among meat consumers. Freshness was identified by most (61.8%) of Arusha beef consumers as a very important quality attribute as opposed to only 36.1% of Dar-es-Salaam beef consumers (Table 2). The proportion of beef consumers who preferred fresh beef in the study area is smaller than that reported by Delgado CL [61] who found that 92% of beef consumers in India preferred fresh beef. However, this proportion is higher than the finding by Teklebrhan T [59] who found that 58% of beef consumers in Germany preferred fresh beef.
| Arusha | n | % Very important | % Important | % Un important | ||||||||
|---|---|---|---|---|---|---|---|---|---|---|---|---|
| Cleanliness of retailing outlets | 135 | 28.9 | 61.5 | 9.6 | ||||||||
| Tenderness | 134 | 1.5 | 29.9 | 68.7 | ||||||||
| Packaging | 133 | 3 | 6 | 91 | ||||||||
| Less fat content | 135 | 28.1 | 34.8 | 37 | ||||||||
| Reliability | 124 | 48.4 | 33.1 | 18.5 | ||||||||
| Freshness | 123 | 61.8 | 26 | 12.2 | ||||||||
| Dar-es-Salaam | ||||||||||||
| Cleanliness of retailing outlets | 134 | 68.7 | 27.6 | 3.7 | ||||||||
| Tenderness | 130 | 5.4 | 45.4 | 49.2 | ||||||||
| Packaging | 134 | 11.9 | 26.1 | 61.9 | ||||||||
| Less fat content | 134 | 51.5 | 21.6 | 26.9 | ||||||||
| Reliability | 133 | 45.1 | 29.3 | 25.6 | ||||||||
| Freshness | 133 | 36.1 | 50.4 | 13.5 |
Table 2: Preference attributes of beef consumers in Arusha and Dar-es-Salaam.
| Component | Initial Eigen values | Extraction Sums of Squared Loadings | ||||||||||||||||
|---|---|---|---|---|---|---|---|---|---|---|---|---|---|---|---|---|---|---|
| Tota | l | % of Variance | Cumulative % | Total | % of Variance | Cumulative % | ||||||||||||
| 1 | 1.55 | 38.748 | 38.748 | 1.55 | 38.748 | 38.748 | ||||||||||||
| 2 | 1.27 | 31.725 | 70.474 | 1.27 | 31.725 | 70.474 | ||||||||||||
| 3 | 0.67 | 16.803 | 87.277 | |||||||||||||||
| 4 | 0.51 | 12.723 | 100 | |||||||||||||||
| Extraction Method: Principal Component Analysis. |
Table 3: Principal component analysis of beef quality attributes.
NB: Components 1, 2, 3, and 4 are freshness, less fat content, cleanliness of retailing outlets and tenderness quality attributes. Table 3: Principal component analysis of beef quality attributes.
while heads of household in this group were mainly self- employed with primary and tertiary education levels (Table 4).
The third group comprised of consumers who considered freshness as the most important quality attributes. It is the largest group that accounted for almost 33% of the sampled consumers. This group can be termed as ‘fresh beef consumers’. About 42% of this group had family size of between 1and 4 household members; and the group was dominated by self-employed household heads (58%) with primary school education levels (Table 4). Their opinion on freshness was similar to that of the second group which associated freshness with safety and non-deterioration of meat. They were also unaware of post slaughtering handling practices of meat such as chilling it in cold rooms to prevent deterioration.
The second group comprised of consumers who preferred beef with both freshness and less fat content quality attributes. However, they were more sensitive to freshness than to fat contents. This group accounted for 22% of the sampled consumers. Household heads in this group were relatively highly educated and had high incomes. This group can be termed as ‘safety scares consumers’ because most of them were of the opinion that fresh beef was preferred to avoid eating deteriorated beef. Moreover, they were of the opinion that eating meat with large amount of fats causes health problems. However, consumers were unaware that meat quality could be maintained through post-slaughtering processes such as aging/chilling of meat.
| Consumers’ characteristics | Group 1 | Group 2 | Group 3 | Group 4 | ||||||||||
|---|---|---|---|---|---|---|---|---|---|---|---|---|---|---|
| Education level | ||||||||||||||
| Primary education | 25(36.68) | 14(26.92) | 42(50.60) | 28(50.00) | ||||||||||
| Secondary education | 15(23.80) | 10(19.23) | 12(14.46) | 15(26.79) | ||||||||||
| Tertiary education | 22(34.92) | 27(51.92) | 20(24.09) | 13(23.21) | ||||||||||
| Informal education | 1(1.59) | 1(1.92) | 9(10.84) | 0(0.00) | ||||||||||
| Total | 63(100.00) | 52(100.00) | 83(100.00) | 56(100.00) | ||||||||||
| Marital status | ||||||||||||||
| Married | 47(74.60) | 41(78.85) | 60(72.83) | 51(91.07) | ||||||||||
| Single | 2(3.17) | 4(7.70) | 4(4.82) | 2(3.37) | ||||||||||
| Widow | 7(11.11) | 6(11.54) | 12(14.46) | 2(3.37) | ||||||||||
| Separated | 7(11.11) | 1(1.92) | 7(8.43) | 1(1.79) | ||||||||||
| Total | 63(100.00) | 52(100.00) | 83(100.00) | 56(100.00) | ||||||||||
| Occupation | ||||||||||||||
| Salaried employment | 13(20.63) | 24(46.15) | 18(21.69) | 15(26.790 | ||||||||||
| Self employed | 45(71.43) | 22(42.31) | 58(69.88) | 36(64.29) | ||||||||||
| Retired officers | 0(0.00) | 2(3.84) | 3(3.61) | 2(3.57) | ||||||||||
| Farming | 1(1.58) | 1(1.92) | 4(4.82) | 23.57) | ||||||||||
| Remittance dependence | 4(6.34) | 3(5.71) | 0(0.00) | 1(1.79) | ||||||||||
| Total | 63(100.00) | 52(100.00) | 83(100.00) | 56(100.00) | ||||||||||
| Household size | ||||||||||||||
| Small family size (1 – 4 members) | 24(38.09) | 21(40.38) | 35(42.16) | 18(32.15) | ||||||||||
| Middle family size (5 -6 members) | 27(42.85) | 18(34.61) | 26(31.33) | 24(42.86) | ||||||||||
| Large family size (> 6 members) | 12(19.04) | 13(25.00) | 22(26.51) | 14(25.00) | ||||||||||
| Total | 63(100.00) | 52(100.00) | 83(100.00) | 56(100.00) | ||||||||||
| Expenditure (Tsh/month) | ||||||||||||||
| Below 500 000 | 14(22.22) | 10(20.41) | 23(28.40) | 6(10.91) | ||||||||||
| 500 000 < X ≤ 1 000 000 | 20(31.75) | 11(22.45) | 38(46.91) | 28(50.91) | ||||||||||
| 1 000 000 < X ≤ 2 000 000 | 26(41.27) | 16(32.65) | 13(16.05) | 21(38.18) | ||||||||||
| 2 000 000 < X ≤ 3 000 000 | 7(11.11) | 9(18.37) | 3(3.70) | 0(0.00) | ||||||||||
| Above 3 000 000 | 6(9.52) | 3(6.12) | 4(4.94) | 0(0.00) | ||||||||||
| Total | 63(100.00) | 49(100.00) | 81(100.00) | 55(100.00) |
Table 4: Beef consumers’ segmentation.
NB: Numbers in parenthesis are percentages. Table 4: Beef consumers’ segmentation.
The fourth group comprised of beef consumers who were neither concerned with ‘freshness’ nor ‘less fat content’ of beef. It accounted for 22% of the sampled households. They were influenced by other factors especially the price of beef in making decision to buy beef. This group can be termed as ‘price conscious beef consumers’. Members of this group were low income earning households with low frequency of beef consumption. Heads of households in this group were young and had small household sizes.
Willingness to Pay for Quality Beef
Table 5 shows the proportion of interviewed consumers who were willing to pay for quality beef at different prices. At the price of 14,205Tsh/kg, only 9.35% of the sampled household respondents bought and consumed quality beef. Questions on higher bids of quality beef were set to determine WTP for the beef at higher price premiums. With an increase in price by a premium of 33% of the prevailing price, the proportion of respondents who were willing to pay for quality beef dropped to 5.75%, at 66% premium price only 5% of the sampled respondents were ready to pay for quality beef and at 100% price premium only 1.08% were willing to buy and consume quality beef (Table 2). The decline in the proportion of respondents who were willing to pay for quality beef explains why there is low consumption of quality beef among interviewed respondents. The price of quality beef of 14,205 Tsh/kg was more than 3 folds the price of conventional beef of 4,270 Tsh/kg. The findings that consumers of quality beef decrease as the premium price increase is supported by findings from other studies in China, South Carolina and Korea [45, 47, 48] respectively.
| n | Respondents who indicated willingness to pay | |||
|---|---|---|---|---|
| Price level (Tsh/kg) | n | % Increase | Frequency | Percentage |
| Price level (Tsh/kg) | n | - | 26 | 9.35 |
| 14,205 | 278 | 33 | 16 | 5.75 |
| 19,205 | 278 | 66 | 13 | 5 |
| 24,205 | 278 | 100 | 3 | 1.08 |
Table 5: Distribution WTP among interviewed respondents Table 5: Distribution WTP among interviewed respondents When consumers we
Table 5: Distribution WTP among interviewed respondents Table 5: Distribution WTP among interviewed respondents When consumers were asked behind their low rate of consuming quality beef, they stated that the beef is too expensive to afford. Apart from expensiveness of the quality beef, interviewed consumers stated other reasons behind low consumption of quality beef as indicated in Figure 2. Unfreshness and chemical composition attributes were found to be other major reasons scaring beef consumers from eating quality beef. About 51% of consumers rated unfreshness as a ‘strongly important’ and ‘important’ quality attribute’ scaring them from consuming quality beef. This is because most consumers had experienced deterioration of conventional beef which is normally sold warm in butchers whereby meat deterioration increases as time elapses. Loss of natural flavours in meat which increases with an increase of time the meat stays in the shelves before being consumed after slaughtering and lack of information on chilling procedures of quality beef leads to low WTP for quality beef.
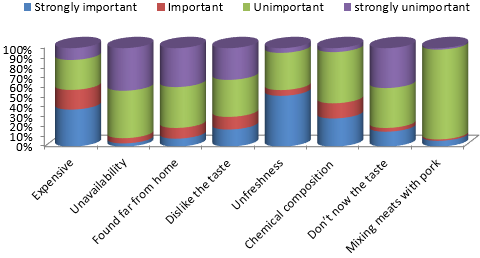
High cost attribute was rated as ‘strongly important’ by 56% of the interviewed household beef consumers. The high cost of quality beef reflects the fact that high price and low income were reasons limiting the consumption of quality beef. When asked as to whether they could consume quality beef if their income rise, or if the price for quality beef decreased, 43.86% reported that, they would consume quality beef if their income rose. This indicates that, with the expansion of middle-income class in developing countries including Tanzania as projected by various authors [62, 63, 64] is likely to lead to an increase of the consumption of quality beef. Other two major reasons restricting respondents from consuming quality beef are unfreshness and the perception that quality beef contain chemicals for preservation. Wrong perception on quality beef can be associated with the lack of awareness among consumers regarding quality beef attributes. Awareness has been noted by various authors as a major influencing factor in making purchasing decisions [65, 66, 67, 68].
Chemical composition was also rated high among respondents as the reason behind non consumption of quality beef (Figure 2). A big proportion of consumers (53%) who were unaware that chilling preserves beef and increases its tenderness; perceived that the beef stays longer because they contain chemicals for preservations that could be hazardous to their health. If awareness on the benefits of chilling beef could be created, consumers who were skeptical to consume quality beef believing that the beef is preserved with chemicals could be potential consumers of quality beef. The finding on skepticism of consuming quality beef on the belief that the beef is preserved with chemicals is more or less similar to the findings of study by Phillip B, et al. [51] Alphonce R and Alfenes F [50] who found that Tanzanian consumers are Expenditure coefficient was significant within 95% confidence interval. Expenditure levels of households had a positive influence on WTP for quality beef (Table 6). This observation conforms to the Engel’s model whereby increased expenditure levels relate to increased consumption of goods. Moreover, it was revealed that, females had a likelihood of 0.23 times higher for WTP for quality beef than was the case with males counterparts. This observation supports the finding by Mapunda FM [25] who found that, women had high probability of buying tender chilled beef than men in southern highlands of Tanzania.
Variable Coefficient Std error Z p>IzI 95% conf. interval Lower Upper Sex 0.2368458 0.41908 -0.6 0.57 -1.058228 0.5845364 Age 0.0062292 0.016112 0.39 0.7 -0.025349 0.0378071 Family size -0.09767 0.095629 -1 0.31 -0.2851 0.089759 Expenditure** 1.05E-07 1.70E-08 6.18 0 7.15E-08 1.38E-07 Constant -2.631568 1.156952 -2.3 0.02 -4.899153 -0.363984 willing to pay for safety inspected and organically produced tomatoes. Inspection and organic produced tomatoes cater for safety attribute which consumers looked for, which is similar to skepticism of consuming quality beef, for consumers who perceive that chemicals are used in preserving the beef.
Selling of different types of meat particularly pork in the same retailing outlet (supermarkets and modern butchers) was found to limit the consumption of quality beef by 7% of consumers who were Muslims. These consumers were of the opinion that selling of different meat types including pork in the same retailing outlet (though in different containers) might make quality beef loses its halaal status if it comes in contact with pork, something which is unacceptable in Islamic belief.
Table 3 displays summary statistics of variables used in WTP analytical model. The model for estimated parameters was able to describe 91% variation for factors influencing WTP for quality beef and was found to be significant with 2= 46.91 and desirable Fadden pseudo R2 = 0.2037.
- **significant at 95% confidence interval
- Log likelihood, 91.679432, Prob > chi2 = 0.0000, LR chi2 (4) = 46.91, Pseudo R2 = 0.2037
Table 6: Estimates of factors influencing WTP for quality beef.
Conclusions and Recommendations
Two major quality attributes preferred by consumers were revealed to be the level of freshness of beef and consumers’ mindset that lack of freshness is a sign of meat deterioration. Meanwhile the ‘less fat content’ attribute accounted for 31.72% of variance in the preference variation indicating that beef consumers perceive that more fat in the meat would lead to health complications. Willingness to pay was revealed to be relatively low (9%) among respondents due to expensiveness, unfreshness of the beef and wrong perception that as beef is refrigerated it deteriorates faster as time elapses and therefore it could be hazardous to human health. It can be concluded that low rate of willingness to pay is attributed to wrong perception on the quality attributes of beef and hence reduces its market share.
From the study findings three major conclusions can be made regarding low consumption of quality beef. (1) Majority (70%) of consumers prefer unrefrigerated fresh beef with little content of fat. (2) Major portion (91%) of consumers is not willing to pay for quality beef because their definition of quality beef is different from that of the main stream quality beef market. (3) Most important driver for willingness to pay for quality beef is the price of beef rather than quality attributes. To commercialize the quality beef subsector, consumers’ needs have to be taken on board for new beef products development. Awareness creation to demystify wrong perception of traditional beef consumers that storing beef in refrigerators loses quality. Quality beef suppliers need to design and supply a range of beef products tailored to meet the needs of traditional beef consumers who have limited knowledge with the mainstream market quality beef attributes. Therefore, consumption of and WTP for quality beef can be promoted by creating awareness through participation in trade fairs, advertisements in mass media and provision of training in primary and secondary schools as part of curriculum for technical education. The promotion could increase its market share that increases the livestock sector’s commercialization and increased incomes of stakeholders along the quality beef value chain.
References
-
A sample of beef consumers were asked to rank different quality attributes taken into consideration when buying beef. Figure 1 displays consumers’ ranking of quality attributes according to their order of importance. ‘Freshness’ attribute scored the highest rank of being ‘strongly important’ as it was considered by consumers when purchasing beef. This finding supports the finding by Teklebrhan T, et al. [59] who found that freshness was among quality attributes preferred by consumers of beef in Germany. The ‘less fat content’ quality attribute was ranked second to ‘freshness’ among sampled household beef consumers in the study area (Figure 1). This finding supports the finding by CIRAD [60] who found that beef consumers in Ethiopia preferred lean and red meat color than fat and white meat. Cleanliness of retailing outlet facilities attribute ranked third after ‘freshness’ and ‘less fat content’ attributes. The sampled household beef consumers relied on cleanliness of retailing outlet facilities as a safety measure of the beef they bought. This is because interviewed consumers had no alternative mechanism of measuring beef safety. Few beef consumers looked at municipal stamps which could act as a safety measure for the consumers. This finding supports the finding by Kamugisha PP [27] Nandonde et al [26] who found hygiene among retailing outlet facilities as the most important valued attribute among beef consumers in the southern highlands of Tanzania. [INLINE_FIGURE:6:0] Figure 1: Importance of beef quality attributes among consumers. Table 2 shows that respondents in Dar-es-Salaam preferred to consume beef with less fat content as opposed to Arusha beef consumers who preferred beef with relatively higher fat content. Cold weather condition might be the reason behind Arusha consumers’ preference of beef with relatively higher fat content than their counter parts in Dar-es-Salaam. CIRAD [60] reported similar findings in Ethiopia whereby lean meat (red in color) was most preferred among meat consumers. Freshness was identified by most (61.8%) of Arusha beef consumers as a very important quality attribute as opposed to only 36.1% of Dar-es-Salaam beef consumers (Table 2). The proportion of beef consumers who preferred fresh beef in the study area is smaller than that reported by Delgado CL [61] who found that 92% of beef consumers in India preferred fresh beef. However, this proportion is higher than the finding by Teklebrhan T [59] who found that 58% of beef consumers in Germany preferred fresh beef. [INLINE_TABLE:7:0] Table 2: Preference attributes of beef consumers in Arusha and Dar-es-Salaam. [INLINE_TABLE:7:1] Table 3: Principal component analysis of beef quality attributes. NB: Components 1, 2, 3, and 4 are freshness, less fat content, cleanliness of retailing outlets and tenderness quality attributes. Table 3: Principal component analysis of beef quality attributes. while heads of household in this group were mainly self- employed with primary and tertiary education levels (Table 4). The third group comprised of consumers who considered freshness as the most important quality attributes. It is the largest group that accounted for almost 33% of the sampled consumers. This group can be termed as ‘fresh beef consumers’. About 42% of this group had family size of between 1and 4 household members; and the group was dominated by self-employed household heads (58%) with primary school education levels (Table 4). Their opinion on freshness was similar to that of the second group which associated freshness with safety and non-deterioration of meat. They were also unaware of post slaughtering handling practices of meat such as chilling it in cold rooms to prevent deterioration. The second group comprised of consumers who preferred beef with both freshness and less fat content quality attributes. However, they were more sensitive to freshness than to fat contents. This group accounted for 22% of the sampled consumers. Household heads in this group were relatively highly educated and had high incomes. This group can be termed as ‘safety scares consumers’ because most of them were of the opinion that fresh beef was preferred to avoid eating deteriorated beef. Moreover, they were of the opinion that eating meat with large amount of fats causes health problems. However, consumers were unaware that meat quality could be maintained through post-slaughtering processes such as aging/chilling of meat. [INLINE_TABLE:8:0] Table 4: Beef consumers’ segmentation. NB: Numbers in parenthesis are percentages. Table 4: Beef consumers’ segmentation. The fourth group comprised of beef consumers who were neither concerned with ‘freshness’ nor ‘less fat content’ of beef. It accounted for 22% of the sampled households. They were influenced by other factors especially the price of beef in making decision to buy beef. This group can be termed as ‘price conscious beef consumers’. Members of this group were low income earning households with low frequency of beef consumption. Heads of households in this group were young and had small household sizes.
- In Situ Evaluation of the Anthelmintic Effect of the Aqueous Extract of Syzygium aromaticum (L) Merr and Perry on Bovine Strongyles
- Successful in Vitro Embryo Production with Oocytes Aspirated from Live White-Tailed Deer (Odocoileus Virginianus Texanus) Donors under Captivity in Northeast Mexico
- Bangladeshi Finches with their Evolutionary Thoughts (Aves: Passeriformes)
- Note on the Survival Status of Przewalski’s Horse, Equus ferus przewalskii (Perissodactyla: Equidae)
- In-Situ and Ex-Situ Protection of White-Breasted Waterhen (Amaurornis Phoenicurus) (Pennant, 1769) (Aves: Rallidae)
- Meat Examination in the Laboratory, the Acceptability and the Human Health