Assessment of Sheep Fattening Practices around Chalia District West Shoa Zone
The study was conducted in Chalia district with the objectives to understand farmers’ sheep fattening practices, and identify the opportunities and challenges of sheep fattening practices. The study area was stratified into two groups based on agroecology in the district (highland and midland) with an average altitude of 2870 to 1387 meters above sea level respectively. Four kebeles were selected purposively from these agro-ecologies. A total of 160 households (HHs) were selected randomly that is forty from each kebeles (two kebeles from highland and two kebeles from midland). Each HHs was interviewed with a semi-structured questionnaire. General issues related to sheep fattening practices, opportunities and challenges were obtained through group discussion with key informants. Data analyses were carried out using both SPSS software and excel index method. The major crop residues grown by farmers in the study area are teff straw, wheat straw, barely straw, bean and pea haulms, Linseed residue and maize stover in the order of their abundance or farmers participation. Three months of feeding of fattening sheep was reported by majority of HHs. The reported major constraints for sheep fattening practice in the study area in the order of importance were feed shortage, disease and parasite, capital, market, and house. Keywords: Agro ecology, Sheep, fattening.
Introduction
Fattening has been defined as intensive feeding of highly nutritious feed to promote fast growth and fat deposition to achieve desired carcass growth and quality [1]. Sheep fattening in Ethiopia has been recognized as a potential profitable activity that enhances the income of smallholder farmers [2, 3]. Success stories from the project “Improving Productivity and Market Success of Ethiopian Farmers [4]” highlighted that sheep fattening has transformed the lives of smallholder farmers in parts of the Oromia region by enhancing household incomes which has led to diversification of agricultural activities. However, such benefits have not been realized on a wider scale due to insufficient interventions as a result of the limited attention that sheep fattening has been received to date.
Traditionally, farmers in Ethiopia are used to fatten a few sheep based on available inputs targeting sales during festive holidays. This is based on limited scientific and technical knowhow in feeding systems and husbandry practices. Shapiro, et al. [2] suggested that there appears to be a lack of appropriate feed packages to make sheep fattening an economically viable system. Ethiopia’s vast sheep estimated around 31.3 million [5] is found widely distributed across the different agro-ecological zones of the country [6, 7]. Sheep fattening and breeding practices are owned smallholder farmers as an integral part of the livestock sub sector and contribute to both subsistence and cash income generation [6, 8].
Sheep fattening is a common practice in different parts of the country, though the degree of fattening and resource base differs markedly. Less than 39% of the farmers who owned small ruminants practice some form of fattening before marketing while majority of the farmer’s sale their animals earlier before the animals attaining the optimum market weight [9, 10]. Fattening is generally profitable because the value per kilogram of live weight increases as both weight and condition increase [11]. Therefore, it is important to assess the sheep fattening practice to increase the income generation of the HH in the area. Therefore, this study was initiated with the objective to assess baseline information on sheep fattening practices and major constraints and opportunities for sheep fattening in the Chalia district west shoa zone.
Materials and Methods
Description of the Study Area
Chaliya district is located in west shoa zone which is known for predominantly growing teff. It is located 165 km from Addis Ababa and about 24km west of the Ambo town. The district has two farming system namely shaded coffee livestock farming system and cereal/livestock. The average annual rainfall of the district is 1524 mm with low variability. It is bimodal distributed in which the small rains are from March to April and the main rainy season last from June to October. Agro-ecologically chaliya district is classified as weina dega (midland) and Dega (highland). Altitude in chaliya ranges from 1387 to 2870 meters above sea level (masl).
Sampling Methods and Sample Size
Prior to undertaking any sampling procedure background information on sheep population and potential for sheep production in Chalia district was collected through rapid exploratory field visits together with focus group discussions and available secondary information from published and unpublished sources, so as to device suitable sampling stages for study. Based on the available information, Chalia district has a total of 20 kebeles distributed into Dega (high altitude), and Woyna-dega (medium altitude). The study site were selected purposively taking into account the agro-ecological conditions, access to transport, number of sheep population and fattening potential in study site. Hence to calculate the number of HHs sampled in the study area will be determined by N = 0.25/SE2, where N = number of sampled HHs, SE = standard error [12]. Considering, SE of 3.95% at a precision level of 5% and 95% confidence interval. Accordingly, 160HHs were selected purposively based on sheep fattening practice and experience of keeping livestock. The survey was undertaken in four kebeles stratified based on altitude as highland (Bada Elamu, Rafiso Halanga) and mid land (Cobi, Waliya) and 40 heads of the households (HHs) were purposively selected and interviewed from each kebele administrations. Therefore, a total of 160 HHs were used in the study.
Data Collection
Survey data were collected by interviewing the farmers with a semi-structure questionnaire. One day orientation was given to four development agents how to deliver the questionnaire. The major issues raised in the questionnaire interview were: sheep production and fattening practices; feed sources for fattening; constraints and opportunities of sheep fattening. Focus group discussion was also conducted in the study area to complement the information which obtained through questionnaire. Field observation was made by the researcher to enrich the data about feeding, watering and housing of the fattening sheep, utilization and management of communal grazing land and crop-residues, left over and local brewery by-products (atela) and feed resource situation.
Statistical Analysis
Statistical package for social science (SPSS, version 22, 2013) was used for the analysis of the survey data. Person Chi-square with absolute frequency and percentage used for ranking of different levels within the group of variables. Index was calculated for questions that require ranking of the response. Index was computed with the principle of weighted average according to the following formula as employed by Musa et al. [13]: Index = Rn*C1+Rn-1*C2….R1*Cn/Σ Rn*C1+ Rn-1*C2….R1 Where; Rn = Value given for the least ranked level (example if the least rank is 5th rank, then Rn-5, Rn-1=4 and … R1= 1) Cn = Counts of the least ranked level (in the above example, the count of the 5th rank = Cn, and the counts of the 1st rank = C1).
Results and Discussions
Socio-Economic Characteristics of the Households
The socio economic characteristics of house hold were summarized in Table 1. The proportion of sex of respondents was 75% and 25%, 87.5% and 12.5%, 77.5 and 22.5% and 80% and 20 % male and female for Bada Elamu, Rafiso halanga, Cobi and Waliya kebele respectively. In the study area, the majority of the sheep fatteners owning households were male headed (80%) while (20%) were headed by females. This result revealed that most of sheep fatteners in the area were male headed and there was no variation between agro ecology of the Study district. This finding was in line with Sisay, et al. [14], in Degahabur zone.
The overall average family size of the respondents was 5.7 ± 0.2 persons per household which was in line with average family size (5.23 ± 0.195 and 5.54 ± 0.16) per household reported by (Beyene, et al. Belete) [15, 16] in Esera District, of Dawro Zone, Southern Ethiopia and Goma district of Jimma zone respectively and lower than average family size (11 ± 0.55) per household reported by Sisay and Kefyalew in Degahabur Zone of Eastern Ethiopia. Relatively small family size reported in current study might be due to awareness creation for family planning measures and by changing the local perception of respondents on large family size to make better life of house hold. The average family sizes of respondents were 4.9 ± 0.2, 5.8 ± 0.3, 6.4 ± 0.4 and 5.7 ± 0.3 persons per households in Bada Elamu, Rafiso halanga, Cobi and Waliya kebele respectively.
The average age of respondents were 35.3 ± 1.2, 37.3 ± 1.5, 36.6 ± 1.6 and 37 ± 1.4 years in Bada Elamu, Rafiso halanga, Cobi and Waliya kebele respectively with overall average ages of the respondents in the study district was 36.5 ± 0.7 years. On average (7.5%, 20%, 5 and 10%) of the respondents were illiterate, (12.5%, 15%, 17.5 and 20%) were Read and write only, (30%, 35%,32.5 and 32.5%) have attended primary school, (35%, 17.5%, 22.5 and 25%) have attended junior and (15, 12.5, 22.5 and 12.5) have attended diploma and above. According to the respondents the overall average education status of respondents were 10.6%, 16.3%, 32.5%, 25%, and 15.6% illiterate, read and write only, primary school, secondary diploma and above respectively in study District. This current study revealed that on average majority of sheep fatteners in the study area was primary school followed respondents who completed secondary school and read and write only.
| Variable | Highland | Midland | Over all | ||
|---|---|---|---|---|---|
| Bada Elamu n=40 | Rafiso Halanga n=40 | Cobi n=40 | Waliya n=40 | n=160 | |
| Sex of HH heads (n (%)) | |||||
| Male | 30 (75) | 35 (87.5) | 31 (77.5) | 32 (80) | 128 (80) |
| Female | 10 (25) | 5 (12.5) | 9 (22.5) | 8 (20) | 32 (20) |
| Family size of HH (Mean±SE) | 4.9±0.2 | 5.8±0.3 | 6.4±0.4 | 5.7±0.3 | 5.7±0.2 |
| Age of the HH (Mean±SE) | 35.3±1.2 | 37.3±1.5 | 36.6±1.6 | 37±1.4 | 36.5±0.7 |
| Educational bag ground of HH (n (%) | |||||
| Illiterate | 3 (7.5) | 8 (20) | 2 (5) | 4 (10) | 17 (10.6) |
| Reading and writing | 5 (12.5) | 6 (15) | 7 (17.5) | 8 (20) | 26 (16.3) |
| Primarily Education (1-8) | 12 (30) | 14 (35) | 13 (32.5) | 13 (32.5) | 52 (32.5) |
| Secondary Education | 14 (35) | 7 (17.5) | 9 (22.5) | 10 (25) | 40 (25) |
| Diploma and above | 6 (15) | 5 (12.5) | 9 (22.5) | 5 (12.5) | 25 (15.6) |
Table 1: Socio-economic characteristics of respondents.
HH=household, M= mean, n= number of sample size, SE= standard error Table 1: Socio-economic characteristics of respondents.
Land Holding and Land Use Pattern in Study Area
The average land holding and use pattern were summarized in Table 2. The average land holding per household in study were 2.93 ± 0.16, 3.15 ± 0.13, 3.35 ± 0.17 and 3.26 ± 0.15 hectares in Bada Elamu, Rafiso halanga, Cobi and Waliya kebele respectively with 3.17 ± 0.08 ha overall average landholding per household in study district. This result was in line with 3.23 ha reported by Dawit and Ajebu (2013) [17] in Adami Tullu, Oromia region and 3.1288 ± 0.19 ha reported by Beyene, et al. (2018) [15] in Esera District, of Dawro Zone, Southern Ethiopia and, Higher than 2.5 ha reported by Belay, et al. (2012) [18] in Dandi District of Oromia Region, 1.29 ha reported by Beyero, et al. (2018) in Badawacho district of Hadiya zone, southern Ethiopia. The average land allocated for crop production, grazing land and fallow land per HH were 2.38 ± 0.06, 0.63 ± 0.015 and 0.159 ± 0.004 respectively.
This result shows that the large proportion of land was allocated for crop production followed by pasture for grazing in the study district. This implies that large proportion of respondents depends on crop production as a source of food item and source of cash income and livestock production as source of food for Home consumption, Cash income, Manure, Draft power and traction.
| Variables | Highland | Mideland | Over all | |
|---|---|---|---|---|
| Bada Elamu | Rafiso Halanga | Waliya | ||
| n=40 | n=40 | n=40 | n=160 | |
| Total land holding (ha) | 2.93 ± 0.16 | 3.15±0.13 | 3.26±0.15 | 3.17±0.08 |
| Crop land (ha) | 2.2 ±0.12 | 2.36±0.09 | 2.45±0.11 | 2.38±0.06 |
| Grazing land (ha) | 0.586±0.03 | 0.63±0.01 | 0.65±0.03 | 0.63±0.015 |
| Fallow land (ha) | 0.147±0.01 | 0.158±0.01 | 0.16±0.01 | 0.159±0.004 |
Table 2: Land holding and land use pattern in Chalia district (M ± SE).
Livestock Holding and Composition in Study Area
The average livestock holding per household was summarized by Table 3. Farmers of the study area keep a mix of different livestock species namely cattle, sheep, goats, equines and chicken, integrated with crop farming and also engaged in off-farm activities. The average number of cattle herd size per households was 5.05 ± 0.256, 4.82 ± 0.258, 5.08 ± 0.238 and 5.42±0.295 for Bada Elamu, Rafiso halanga, Cobi and Waliya kebele respectively. The overall average cattle herd size per households was 5.09 ± 0.1 in study district. This result was higher than 2.4 reported by Selamawit, et al. [19] in Gedio Zone of Southern Ethiopia, 3.3 reported by Abera et al. [20] in Baresa Watershed, Ethiopia and lower than 14.8 reported by Kassahun in Chilega Woreda, North Gondar and 7.51 ± 0.323 reported by Beyene, et al. [15] in Esera District, of Dawro Zone, Southern Ethiopia.
The average size of sheep flock in study area was 4.8 ± 0.413, 4.5 ± 0.34, 5.2 ± 0.394 and 5.0 ± 0.33 Bada Elamu, Rafiso halanga, Cobi and Waliya kebele respectively. The overall average flock size of sheep per households was 4.88 ± 0.185 in the study district. This current finding was in line with 4.8 reported by Dhaba, et al. in Illu Abba Bora Zone of oromia region average less than sheep flock size 6.10 reported by Deriba in Alaba Southern Ethiopia and 5.33 reported by Selamawit and Matiwos in Gedio Zone of southern Ethiopia, and higher than 3.6 reported by Belete [16] in Goma District of Jimma zone (Table 3).
| Livestock Category | Highland | Mideland | Over all n=160 | |
|---|---|---|---|---|
| Bada Elamu n=40 | Rafiso Halanga n=40 | Cobi n=40 | ||
| Cattle | 5.05±0.256 | 4.82±0.258 | 5.08±0.238 | 5.09±0.1 |
| Sheep | 4.8±0.413 | 4.5±0.34 | 5.2±.394 | 4.88±0.185 |
| Goats | 2.58±0.258 | 2.42±0.258 | 2.7±.259 | 2.62±0.129 |
| Equine | 3.0±0.203 | 2.85±0.166 | 3.0±0.139 | 2.88±0.085 |
| Poultry | 8.33±0.458 | 7.9±0.48 | 8.8±0.49 | 8.63±0.26 |
Table 3: Mean and stand error of livestock holding and composition in study area (Mean ± SE).
The average size of goats flock in study area was 2.58 ± 0.258, 2.42 ± 0.258, 2.7 ± 0.259 and 2.77 ± 0.262 in Bada Elamu, Rafiso halanga, Cobi and Waliya kebele respectively. The overall average flock size of goats per households was 2.62 ± 0.129 in the study district. The average goat flock size was in line with 2.1 reported by Belete in Goma District of Jimma zone less than 4.5 reported Deriba in Alaba Southern Ethiopia, 3.99 reported by Dhaba, et al in Illu abba bora Zone of oromia region, and 3.46 reported by Selamawit and Matiwos in Gedio Zone of southern Ethiopia.
Equines (donkeys, horses and mule) were the most valuable pack animals for transportation of people and other goods in many parts of the study area especially where other means of transportation are limited. Equines were also used for threshing and transporting agricultural inputs and products, drinking water for animals and human beings, wood, crop residues and charcoal which is consistent with the report of Lemma [21]. The average number of equine was 3.0 ± 0.203, 2.85 ± 0.166, 3.0 ± 0.139 and 2.68 ± 0.169 in Bada Elamu, Rafiso halanga, Cobi and Waliya kebeles respectively with overall average number was 8.63±0.26 in study district. The average size of chicken in study area was 8.33±0.458, 7.9±0.48, 8.8±0.49 and 9.48±0.629 in Bada Elamu, Rafiso halanga, Cobi and Waliya kebeles respectively with overall average number was 2.88 ± 0.085 in study district.
Source, Type and Frequency of Sheep Fattening
Respondents’ preference for fattening sheep and sheep fattening practices are shown in Table 4. The source of fattening sheep in the study area were 63.7% own production and 36.3% immediate purchasing from nearby local market during the time of fattening. In respondents’ preference of sheep for fattening; the highland agro-ecology preference of respondents for fattening were lamb (36.3%), ram (26.9%), wether (castrated ram) (21.9%), cull ewe (15%). In the mid agro-ecology respondents preferred ram, cull ewe, lamb, wether (castrated ram) and maiden ewe. From the lower agro-ecology they preferred ram, wether (castrated ram), lamb, maiden ewe and cull ewe in the order of rank. As ranked, the type of sheep for fattening purpose ram, wether (castrated ram) and lambs were preferred mostly by respondents. The reasons for this were the preference of the demands or market need and attain their weight as fast as possible. Some farmers preferred for fattening purpose unproductive ewe that were not used for replacement or production. This indicates that farmers have knowledge or an experience for fattening animals and used to increase their income or profit.
Especially, the majority of high land agro-ecology farmer practiced sheep fattening by own production in dry season only due to long raining season during the summer time of the area that were not suitable for fattening. In the study area, frequency of fattening practiced 34.4%, 27.5%, 26.9% and 11.3% of respondents only three times, two times, four times, and one time were fatten per year. The fattening time were significantly different (P<0.05) across the study area. The majority of the respondents practiced only three time in a traditional/semi intensive way of fattening system. This system generally depends on grazing natural and crop residue with variable degrees of supplementation. Hence, animals require a long period of time to attain market weight and condition highland agro-ecology than mid land agro- ecology. It is also associated with huge fluctuations in the weights and conditions of the animals due to unavailability of feed, mating of rams and poor health, and housing of the animals. Generally, thus selected farmers averagely fatten 5 sheep per fattening period.
| Sheep fattening practices (%) Bada Elamu n=40 | Highland | Midland | Over all n=160 | |||
|---|---|---|---|---|---|---|
| Rafiso Halanga n=40 | Cobi n=40 | Waliya n=40 | ||||
| The source of fattening sheep | Own production | 25 (62.5) | 29 (72.5) | 25 (62.5) | 23 (57.3) | 102 (63.7) |
| Immediate purchase | 15 (37.5) | 11 (27.5) | 15 (37.5) | 17 (42.5) | 58 (36.3) | |
| Type of sheep prefer for fatten ing purpose | Ram | 11 (27.5) | 9 (22.5) | 12 (30) | 11 (27.5) | 43 (26.9) |
| Wether | 8 (20) | 9 (22.5) | 11 (27.5) | 7 (17.5) | 35 (21.9) | |
| Lamb | 14 (35) | 17 (42.5) | 11 (27.5) | 16 (40) | 58 (36.3) | |
| Culled ewes | 7 (17.5) | 5 (15.5) | 6 (15) | 6 (15) | 24 (15) | |
| Frequency of sheep Fattening per year | Only one time | 9 (22.5) | 4 (10) | 2 (5) | 3 (7.5) | 18 (11.3) |
| Two times | 4 (10) | 7 (17.5) | 17 (42.5) | 16 (40) | 44 (27.5) | |
| Three times | 14 (35) | 14 (35) | 14 (35) | 13 (32.5) | 55 (34.4) | |
| Four times | 13 (32.5) | 15 (37.5) | 7 (17.5) | 8 (20) | 43 (26.9) |
Table 4: Shows sources, types and frequency of sheep used for fattening purpose in Chalia district.
Major Crop Residues and Utilization
The major crop residues available in the study area and utilization were ranked according to their abundance in Table 5. The major crop residues grown by farmers in the study area are teff straw, wheat straw, barely straw, bean and pea haulms, Linseed residue and maize stover in the order of their abundance or farmers participation. Teff straw, wheat straw, barely straw and bean and pea haulms are the dominant grown crops and their residues constituted the largest share of crop residues fed to livestock in the area. Crop residues fed mostly started at the beginning of the dry season. However, feeding of fattening animals in the two agro-ecology highland and midland used crop residues such as mixing of teff straw, wheat straw, barely straw, bean and pea haulms and atela including salt. These crop residues are good sources of metabolizable energy and crude protein. According to Bedasa Eba, both farming systems of Fogera, most of the respondents practiced storage of the available crop residues around home. But, there were no treatments or improvements made during feeding to increase the quality of straws. Amare Haileslassie, et al. [22] and Descheemaeker, et al. [23] already demonstrated that crop residues management like chopping and urea treatment improves the feed quality and therefore livestock water productivity values. Smith also listed chopping, grinding, and treatment with urea as the most appropriate methods of improving the feed value of crop residues at the smallholder level. According to Bedasa Eba, untreated crop residues may reduce the quality of available feed for livestock and lower the value of livestock water productivity. Hence, treated crop residues may increase nutrient intake, digestibility and productivity of the animals. Therefore, it increases livestock water productivity. According to Njwe RM_,_ with increases in population pressure and the demand for more food and farmland, the use of crop residues and by-products is increasing. Straw, for example, is a valuable feed resource especially during the dry season.
| Crop Residues | Rank given by respondents (%) | ||||||||||||||
|---|---|---|---|---|---|---|---|---|---|---|---|---|---|---|---|
| 1 | 2 | 3 | 4 | 5 | 6 | Sum | Index value | Rank | |||||||
| M | M | M | M | M | M | ||||||||||
| N | Fre | N | Fre | N | Fre | N | Fre | N | Fre | N | Fre | ||||
| Teff straw | 35 | 210 | 29 | 145 | 26 | 104 | 17 | 78 | 2 | 4 | 0 | 0 | 541 | 0.224 | 1 |
| Barley straw | 28 | 168 | 31 | 155 | 30 | 120 | 17 | 51 | 0 | 0 | 0 | 0 | 494 | 0.204 | 3 |
| Wheat straw | 21 | 126 | 48 | 240 | 23 | 92 | 16 | 48 | 6 | 12 | 0 | 0 | 518 | 0.214 | 2 |
| Maize stover | 0 | 0 | 5 | 25 | 13 | 52 | 9 | 27 | 12 | 24 | 12 | 12 | 140 | 0.058 | 6 |
| Lineseed straw | 4 | 24 | 9 | 45 | 26 | 104 | 37 | 111 | 10 | 20 | 9 | 9 | 313 | 0.129 | 5 |
| Bean & peas | |||||||||||||||
| haulms | 19 | 114 | 39 | 195 | 19 | 76 | 4 | 12 | 8 | 16 | 0 | 0 | 413 | 0.171 | 4 |
Table 5: Major Crop residues used for animal feed in Chalia district (ranked according to abundance) based on respondents. *Fre =
Table 5: Major Crop residues used for animal feed in Chalia district (ranked according to abundance) based on respondents. *Fre = frequency; N= total number of respondent; M = weighted frequency; **Index for all agro-ecologies for Crop residue= sum of single crop residue parameter ranked in each agro-ecology i.e. 6*1st ranked crop residue parameter + 5*2nd ranked crop residue parameter + 4*3rd ranked crop residue parameter + 3*4th ranked crop residue parameter + 2*5th ranked crop residue parameter + 1*6th ranked crop residue parameter /sum of all weighted crop residue parameters described by the respondents in each agro-ecology
Feed Supplementing of Sheep Fattening
Natural pasture and crop residues do not fulfill the nutritional requirements of animals particularly in the dry season due to poor management and poor quality [24]. Thus, provision of supplementary feeds to increase the productivity of livestock is essential. The major livestock feed resources available in the study areas are shown in Table 6. The major available feed resources in the study areas are crop residues, natural pasture, stubble grazing and agro industrial by products and improved forages. The supplementing feed in the highland area was barley bran, house leftover ((local brewery (atela)), Noug seed cake, linseed cake and molasses in the order of their abundance or farmers participation. In the same way, the supplementing of feed in midland area house leftover, wheat bran, Noug seed cake, linseed cake and molasses in the order of their abundance or farmers participation. Similarly, the major available feed resources in Ethiopia are natural pasture, crop residues, aftermath grazing, agro-industrial by-products, to a lesser extent improved pasture, and forage crops [25, 26]. In dry season the major livestock feed resources identified in the study area were untreated crop residue (tef straw, barley straw, wheat straw, maize stover, bean and pea residue, bean hulls, and linseed residue), natural pasture, stubble grazing, fodder trees feed supplements (local brewery (atela), oil seed meals, and flour milling by products). Crop residue and crop stubble grazing are important sources of feed during the dry season. Similarly Belete Shenkute [16] reported from the interviewed households, 59.4%, 23.5%, 19.4% and 32.1% utilize communal grazing, roadside grazing, riverside grazing and grazing aftermath, respectively. In wet seasons of the year when the major feed source is communal grazing, 79.4% of households use herded grazing system so that sheep and goats do not go into crop fields as herders are closely following.
According to the respondents the major feed source used for supplementation of sheep fattening was barley/ wheat bran, house leftover (Atela, home refusal) salt/ local mineral, and oil seed cake and molasses in the two agro-ecology of the study area. About 28.8% of respondent supplement house leftover (Atela, home refusal, salt/local mineral) in the midland area and 30.4% of the feed supplement was barley bran in the highland area.
| Rank given by respondents (%) | ||||||||||||||
|---|---|---|---|---|---|---|---|---|---|---|---|---|---|---|
| 1 | 2 | 3 | 4 | 5 | Sum | Index value | Rank | |||||||
| Agro-ecologies | M | M | M | M | M | |||||||||
| N | Fre | N | Fre | N | Fre | N | Fre | N | Fre | |||||
| Highland | Barley bran | 19 | 96 | 20 | 80 | 5 | 15 | 0 | 0 | 0 | 0 | 190 | 0.304 | 1 |
| Noug seed cake | 0 | 0 | 12 | 48 | 21 | 63 | 3 | 6 | 0 | 0 | 117 | 0.188 | 3 | |
| Linseed cake | 1 | 5 | 8 | 32 | 7 | 21 | 13 | 26 | 1 | 1 | 85 | 0.136 | 4 | |
| Molasses | 0 | 0 | 0 | 0 | 5 | 15 | 14 | 28 | 15 | 15 | 58 | 0.093 | 5 | |
| House leftover | 16 | 80 | 19 | 76 | 6 | 18 | 0 | 0 | 0 | 0 | 174 | 0.279 | 2 | |
| Midland | Wheat bran | 21 | 105 | 19 | 76 | 6 | 18 | 0 | 0 | 0 | 0 | 199 | 0.284 | 2 |
| Noug seed cake | 1 | 5 | 13 | 52 | 21 | 63 | 4 | 8 | 0 | 0 | 128 | 0.183 | 3 | |
| Linseed cake | 1 | 5 | 9 | 36 | 9 | 27 | 14 | 28 | 1 | 1 | 97 | 0.138 | 4 | |
| Molasses | 0 | 0 | 1 | 4 | 9 | 27 | 15 | 30 | 14 | 14 | 75 | 0.107 | 5 | |
| House leftover | 20 | 100 | 21 | 84 | 6 | 18 | 0 | 0 | 0 | 0 | 202 | 0.288 | 1 |
Table 6: Provision of Supplementary feeding. *Fre = frequency; N= total number of respondent; M = weighted frequency; **Index for
Table 6: Provision of Supplementary feeding. *Fre = frequency; N= total number of respondent; M = weighted frequency; **Index for all agro-ecologies for Supplementary feeding = sum of single Supplementary feeding parameter ranked in each agro-ecology i.e. 5*1st ranked Supplementary feeding parameter + 4*2nd ranked Supplementary feeding parameter + 3*3rd ranked Supplementary feeding parameter + 2*4th ranked Supplementary feeding parameter + 1*5th ranked Supplementary feeding parameter Supplementary feeding parameter /sum of all weighted Supplementary feeding parameters described by the respondents in each agro-ecology
Purpose of Sheep Fattening In the Study Area
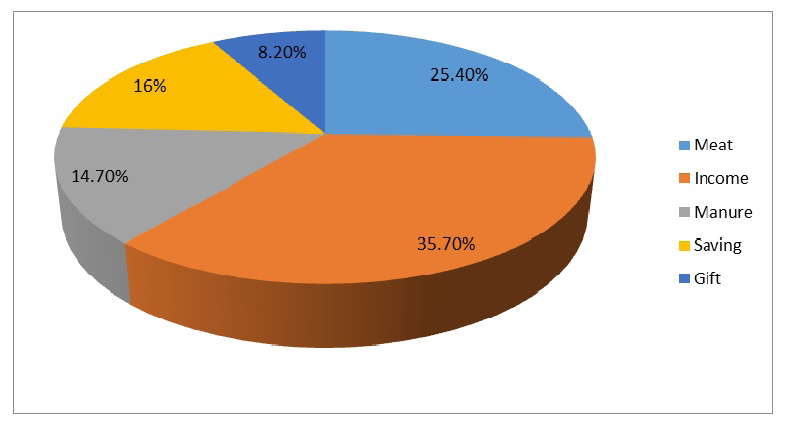
The purpose of sheep fattening in the study area is indicated in Table 7. According to the respondents of west shoa Chalia district, the purpose of fattening sheep was income sources, meat, saving, manure and gift. However, generally in Oromia region producers fattened sheep for the purpose of income. In addition to this, the purpose of sheep fattening in the Chalia district (Table 7) indicated that in Chalia district producers were involved in sheep fattening for the purpose of income source, meat, saving, manure, and gift in the order of their purpose or farmers participation (Figures 1 & 2). The present study agreed with the study of Solomon, et al. Farmers were keeping sheep for the purpose of income source in the area of Fogera, Alaba, Metema, Goma and Alamata. It was also in line with the finding of Dhaba, et al. [18] in Oromia region of Ilu Aba bora zone who pointed out that the purpose of keeping small ruminants was primarily income generation.
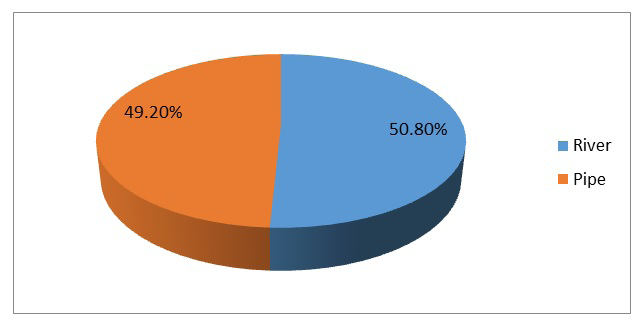
Water Resource for fattening sheep: Respondents’ used two types of water sources identified in the study area were in the river (50.8%) and pipe (49.2%). Similarly, the majority of surveyed farmers in IPMS PLWs (96.3% in Bure, 84% in Atsbi-Womberta, 85.6% in Metema, 56.9% in Gomma, 51.3%
in Fogera, 55.2% in Alaba, 44.7% in Alamata, and 66.7% in Dale) responded that rivers are the major source of water for the most part of the year [4].
Major Constraints of Sheep Fattening
The main reasons (as indicated by the respondents, presented in Table 8 limited sheep production in the study area were feed, disease and parasite, capital, market and house in the order of their rank. Lacks of proper feed resources followed by lack of disease and parasite controlling system were the other important limiting factor affecting production of sheep. According to Ayele Abebe, the major constraints are feed shortage, livestock diseases, and shortage of initial capital, poor genetic makeup of the livestock, lack of drinking water, limited information on animal husbandry practices, labor shortage and poor market access, predators and flooding were reported in Fogera district. Inadequate feed supply is one of the major constraints hampering market- oriented livestock development in the Amhara National Resgional State in particular and in Ethiopia in general [27]. Inadequate feed quantity and quality solutions are fodder trees, urea treatment of crop residues, use of agricultural by-products as concentrates, hay making, fodder storage, mixing residues of cereals with leguminous residues [23]. Generally, livestock production and productivity are affected by different factors.
Disease and parasite is the second important constraint in the study area. Health problems cause high mortality and reduce live weight gain resulting in reduced output per animal. Lack of capital was the third important constraint that hindered the performance of sheep fattening activity in the study area. To alleviate lack of capital, credit services are available from Oromia Credit and Savings Institution (ACSI), but farmers do not access it because they are unable to fulfill credit requirement such as organizing themselves in groups and also farmers are expected to get married to become entitled to the services. Marketing for fattening sheep is the fourth constraint in the area. Fluctuation of local market for fattened sheep was hindered continues fattening program of the producers [28, 29, 30, 31, 32, 33]. Actually, the study area have suitable environment for livestock investment. But, the focus of government for modern livestock production is low and biased to crop production to satisfy the need of human food in short term rather than integration. The diversified resource of the district like high potential of livestock, crop residue, huge grazing land and agro industrial by products utilization were not efficiently used due to lack of extension and policy supports (e.g. free grazing, crop residue management inputs and output markets). In comparable, the other constraints listed by farmers for sheep production include lack of improved forages species, inadequate feed conservation practices and absence of infrastructures. Housing for livestock is the fifth constraint in the area. Most farmers used sheep housing within the family which may favorable to zoonotic disease transmissions like tuberculosis. Respondents raised questions that the problems to build separated sheep house is money and low awareness of fattening investment in the area.
| Constraints | Rank given by respondents (%) | Sum | Index value | Rank | |||||||||
|---|---|---|---|---|---|---|---|---|---|---|---|---|---|
| 1 | 2 | 3 | 4 | 5 | |||||||||
| M | M | M | M | M | |||||||||
| N | Fre | N | Fre | N | Fre | N | Fre | N | Fre | ||||
| Feed | 69 | 345 | 27 | 108 | 23 | 69 | 2 | 4 | 0 | 0 | 526 | 0.29 | 1 |
| Market | 10 | 50 | 42 | 168 | 17 | 51 | 24 | 48 | 2 | 2 | 319 | 0.17 | 4 |
| Capital | 36 | 180 | 44 | 176 | 28 | 84 | 1 | 2 | 0 | 0 | 442 | 0.24 | 3 |
| Disease & parasite | 36 | 180 | 36 | 144 | 24 | 72 | 12 | 24 | 1 | 1 | 421 | 0.23 | 2 |
| House | 0 | 0 | 2 | 8 | 24 | 72 | 24 | 48 | 3 | 3 | 131 | 0.07 | 5 |
Table 7: Sheep fattening constraints assessment of Chalia districts. *Fre=frequency; M=weighted frequency; N= total number of res
Conclusion and Recommendation
Sheep fattening practice is an important farming activity in the study area. The source of fattening sheep in the study area were own production and immediate purchasing at the time of fattening. The type of sheep fattening were lamb, ram, wether (catrated sheep) and culled ewe used. The frequency of sheep fattening per year in the study area were 34.4%, 27.5%, 26.9% and 11.3% of respondents only three times, two times, four times, and one time. The major available livestock feed resources identified in the study area were natural pasture, crop residue, stubble grazing, fodder trees and improved forages and agro industrial by products. Available feed resource utilization (nonconventional like atela). The key feed sources in both agro-ecologies were communal or natural pasture and private pasture grazing. Disease and parasite prevalence and inadequate feed shortage were the two most important sheep production constraints in the study area [33, 34, 35, 36, 37, 38, 39].
Sheep and goat production are faced by the shortage feed especially during dry season, poor in quality and decreasing its productivity for grazing and in wet season expansion of crop cultivation on grazing areas are the majors’ problems. River water and pipe water are the main source for sheep fattening and other livestock in the study area.
The result showed that the major constraints of sheep fattening were shortage of feed, disease and parasite, capital, market and house in the order of importance. In addition, the shortage of grazing land, water and drought are the other problem. Therefore, all management aspects of fattening sheep require more attention for sustainable sheep fattening in the study areas.
References
-
Yami A (2008) Short term intensive fattening of sheep and goats. Technical Bulletin. Merkel RC (Ed.), Ethiopia Sheep and Goat productivity Improvement Program. pp: 14.
-
Shapiro BI, Mohamed Saleem MA, Reynolds L (1993) Socio-economic constraints to strategic sheep fattening: evidence from the Ethiopian highlands. In: Lebbie SHB, et al. Small Ruminant Research and Development in Africa. Addis Ababa: ILCA.
-
Pasha T (2006) Feedlot fattening of sheep and goats for quality mutton production. Islamabad: Livestock and Dairy Development Board.
-
IPMS (Improving Productivity and Market Success), 2013. Improving the productivity and market success of Ethiopian farmers, international livestock research institute (ILRI), Addis Ababa, Ethiopia, pp: 33-35.
-
CSA (2018) Agricultural Sample Survey (2017/18). Report on Livestock and Livestock Characteristics (Private Peasant Holdings). (Central Statistical Agency of the Federal Democratic Republic of Ethiopia) Statistical Bulletin 587, Addis Ababa, Ethiopia.
-
EARO (2000) National Small Ruminants Research Strategy Document. (Ethiopian Agricultural Research Organization), Addis Ababa, Ethiopia
-
Kassahun A (2004) The State of Ethiopia’s Farm Animal Genetic Resources-Country Report: A Contribution to the First Report on the State of the World’s Animal Genetic Resources. ESAP (Ethiopian Society of Animal Production) Newsletter 10.
-
Ehui K, Benin S, Gebreselassie N (2000) Factors Affecting Urban Demand for Live Sheep: The case of Adiss Abeba, Ethiopia. Socio-economics and policy research working paper 31. ILRI (International Livestock Research Institute), Nairobi, Kenya, pp: 1-23.
-
Abegaz S, Duguma G, Kumsa T, Soboka B, Bacha D, et al. (2005) On-farm verification of sheep finishing technology in Eastern Wollega Zone. In: Participatory Innovation and Research: Lessons for Livestock Development.
-
Getahun L (2008) Productive and economic performance of small ruminant production in production system of the Highlands of Ethiopia. Ph.D. dissertation. University of Hohenheim, Stuttgart-Hoheinheim, Germany.
-
ESGPIP (2012) Short Term Intensive. Fattening of Sheep and Goats for Rapid Improvement in Weight and Condition and also Producer Incomes, Ethiopia sheep and goat productivity improvement program Technical Bulletin, 11: 2-6.
-
Arsham H (2007) Questionnaire design and survey sampling. SySurvey: The Online Survey Tool.
-
Musa LMA, Peters KJ, Ahmed MKA (2006) On farm characterization of Butana and Kenana cattle breed production systems in Sudan. Livest Res for Rural Develop 18(12).
-
Fikru S, Gebeyew K (2015) Sheep and goat production systems in degehabur zone, eastern Ethiopia: Challenge and opportunities. Adv Dairy Res 3(2): 1000134.
-
Beyene A, Alilo AA, Mola M (2018) Assessment of Sheep and Goat (Small Ruminants) Production System in Esera District, of Dawro Zone, Southern Ethiopia. J Adv Dairy Res 6(4): 1000215.
-
Belete Shenkute, 2009. Production and marketing systems of small ruminants in Goma district of Jimma zone, western Ethiopia. Msc. Thesis Hawassa University, Awassa, Ethiopia, pp: 38-111.
-
Dawit A, Ajebu N, Sandip B (2013) Assessment of feed resource availability and livestock production constraints in selected Kebeles of Adami Tullu Jiddo Kombolcha District, Ethiopia. Afr J Agric Res 8(29): 4067-4073.
-
Dhaba U, Belay D, Solomon D, Taye T (2012) Breeding practices and reproductive performance of traditionally managed indigenous sheep and goat in Ilu Abba Bora Zone of Oromia Regional State, Ethiopia, pp: 676-80.
-
Selamawit D, Matiwos H (2015) Sheep and goat production practice in agro forestry systems of Gedio Zone, Ethiopia. Int J Env 4(2): 296-307.
-
Abera M, Tolera A, Assefa G (2014) Feed resource assessment and utilization in Baresa watershed, Ethiopia. Int J Sci Res 3(2): 66-72.
-
Lemma G (2002) Crude protein and mineral status of Forages grown on pelvic vertisol of Ginchi, central highlands of Ethiopia. University of the Free State, Bloemfontein.
-
Haileslassie A, Alan D, Michael B (2011) Feed Resources Assessment and Potential Implications for Interventions in the Menz Sheep Breed Areas, Ethiopia. International Livestock Research Institute (ILRI) Hyderabad, India and Addis Ababa, Ethiopia, pp: 8-19.
-
Descheemaeker K, Patricia M, Paulo van B, Amare H (2012) Livestock water productivity in sub-Saharan Africa: Entry points for improvement, Stockholm Water Week, Water and Livestock Seminar, pp: 2-20.
-
Byaruhanga C, Oluka J, Olinga S (2015) Socio-economic aspects of goat production in a rural agro-pastoral system of Uganda. Univ J. Agric Res 3(6): 203-210.
-
Mengistu A (1987) Feed resource in Ethiopia. Proceeding of the first National Livestock Improvement Conference, Addis Ababa, Ethiopia, pp: 143.
-
Bediye S, Sileshi Z (1989) The composition of Ethiopian feeds. IAR Research Report. Institute of Agricultural Research, Addis Ababa, Ethiopia, pp: 80.
-
Tegegne F, Getnet A (2010) Feed resource assessments in Amhara National Regional State. Ethiopian sanitary &physiology standards and livestock and meat marketing program (SPS-LMM) Texas A & M University System Addis Abeba, Ethiopia, pp: 2-105.
-
Mengistu A, Amare S (2003) Integrated livestock development project (ILDP) livestock feed resources survey, north Gonder Ethiopia, pp: 75.
-
Tadesse A (1998) The unexploited potential of improved forages in the mid altitude and Low land areas of Ethiopia and implements. Part II, CSA, Addis Ababa, Ethiopia, pp: 503-517.
-
Delgado C, Rosegrant M, Steinfeld H, Ehui S, Courbis C (1999) Livestock to 2020: The Next food revolution food, agriculture and the environment discussion paper 28.IFPRI (International food policy research Institute), Washington, DC, USA, pp: 1-72.
-
Devender C (2005) Small ruminants in Asia, contribution food security, Poverty alleviation and opportunities for productivity enhancement, pp: 19-34.
-
Getahun Degu M, Mwangi H, Verkuijil A, Wondimu (2000) An assessment of the adoption of seed and fertilizer packages and the role of credit in small holder maize production.
-
Hailemariam F, Melesse A, Banerjee S (2013) Traditional Sheep Production and Breeding Practice in Gamogofa Zone, Southern Ethiopia. International Journal of Livestock Production Research 1(3): 26-43.
-
Hurissa (2003) Livestock marketing in Ethiopia: a review of structure, performance and D e v e l o p m e n t initiatives. Socio- economic and policy research working paper 52. ILRI, Nairobi, Kenya.
-
ILCA (1990) Livestock systems research manual Working paper 1, Addis Ababa, International Livestock centre for Africa, Ethiopia 1: 287.
-
Jabbar MA (1998) Market niches for increased small ruminant production in southern Nigeria. Livestock policy Analysis Brief No. 18, International Livestock research Institute (ILRI).
-
Samuel MA, Seid G, Berhan T (2014) Assessment of cattle husbandry practices in Burji Woreda, Segen Zuria Zone of SNNPRS, Ethiopia. Int J Technol Enh Emer Eng Res 2(4): 11-26.
-
Abegaz S, Abebe G, Awgichew K (2010) Sheep and Goat Production Systems in Ethiopia (Chapter 3), pp: 28-32.
-
SPSS Version 13.0 2013 Software Package for Social Sciences for Window.
- In Situ Evaluation of the Anthelmintic Effect of the Aqueous Extract of Syzygium aromaticum (L) Merr and Perry on Bovine Strongyles
- Successful in Vitro Embryo Production with Oocytes Aspirated from Live White-Tailed Deer (Odocoileus Virginianus Texanus) Donors under Captivity in Northeast Mexico
- Bangladeshi Finches with their Evolutionary Thoughts (Aves: Passeriformes)
- Note on the Survival Status of Przewalski’s Horse, Equus ferus przewalskii (Perissodactyla: Equidae)
- In-Situ and Ex-Situ Protection of White-Breasted Waterhen (Amaurornis Phoenicurus) (Pennant, 1769) (Aves: Rallidae)
- Meat Examination in the Laboratory, the Acceptability and the Human Health