Ultrasound Findings of Diffuse Liver Disease: Basic Steps to Understanding Sonographic Features
The ultrasound examination, capable of non-invasively detecting subtle changes in the liver's structure and form, can be extremely helpful. It is not only useful in identifying liver tumors but also in diagnosing and differentiating various liver diseases. Continuous monitoring with ultrasound is especially valuable in patients with chronic hepatitis B and C, as well as other chronic liver diseases, for understanding disease progression and early detection of hepatocellular carcinoma. It is also used in determining the degree of liver fibrosis. Therefore, our goal is to enhance diagnostic capabilities by describing basic ultrasound findings related to diffuse liver diseases.
Key Essential Lists of the Ultrasound Surveillance of Chronic Liver Diseases
During the ultrasonographic examination, the following findings should be checked: the shape and size of the liver (liver contour/volume), parenchymal echo pattern, liver surface irregularity, changes in the vascular system, and extrahepatic structures.
Characteristic Ultrasound Findings for Each Disease
Fatty Liver
Fatty liver, characterized by fat accumulation within liver cells, can arise from various conditions such as alcohol consumption, obesity, diabetes, hyperlipidemia, and certain medications. It may progress from simple fatty liver (steatosis) to steatohepatitis, and eventually lead to cirrhosis [1]. This infiltration of intrahepatic fat is caused by the deposition of triglycerides into cytoplasmic lipid droplets within hepatic cells. It can be diagnosed when liver attenuation is at least 10 Hounsfield Units (HU) lower than that of the spleen, or when the absolute liver attenuation is less than 40 HU in non-contrast abdominal computed tomography [2, 3]. However, ultrasound exhibits superior sensitivity compared to CT scans in the diagnosis of fatty liver. As fat accumulates, the high reflectivity of fatty tissue increases the echogenicity of the liver parenchyma, resulting in a characteristic ultrasound finding known as a “bright liver” [4]. The extent of fat deposition correlates with the level of echogenicity, sometimes reaching levels similar to those of the hepatic portal walls. The liver parenchyma, exhibiting higher echogenicity than the renal cortex, creates a distinct contrast between the liver and kidney echoes on ultrasound (Figure 1A). High echogenicity in the liver parenchyma may obscure the visualization of intrahepatic vascular walls (Figure 1B), and in severe cases, there might be decreased echogenicity in the deep liver parenchyma, making the diaphragm less distinct (Figure 1C).
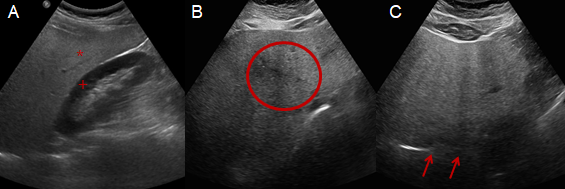
Figure 1: An intercostal scan showing increased echogenicity in the hepatic parenchyma (*) in comparison to the renal cortex (+) (A). A subcostal scan illustrating impaired visualization of periportal vein echogenicity (circled) (B). A subcostal scan depicting severely increased echogenicity of the hepatic parenchyma, with the diaphragm poorly visualized (indicated by arrows) (C).
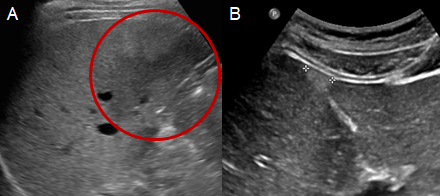
Focal Fat Sparing Zone and Focal Fatty Infiltration: A focal fat sparing zone is an area in the liver where there is a lack of local fat deposition, despite the presence of diffuse fat infiltration throughout the organ (Figure 2A). These areas, which do not cause a mass effect, are commonly observed around hepatic vasculature, ligaments, fissures, the anterior aspect of the portal vein branch in segment 4, and near the gallbladder. When fatty infiltration is localized (Figure 2B), it is often associated with factors such as obesity, alcohol consumption, diabetes, or certain medications, and is related to the local blood supply. These zones exhibit a well-defined, irregular, and geographic shape without an overt mass effect, and are typically round or oval, consistent with the local blood supply. They can manifest as a single lesion or involve an entire region of the liver in a few cases. Since they are most commonly observed around the porta hepatis (portal triad), segment 1, and segment 3, diagnosis is possible if there are high-echogenic lesions that do not interfere with the flow of blood vessels in these areas. However, if circular high-echogenic lesions are observed in other areas, additional tests may be required to differentiate them from other diseases.
Acute Hepatitis
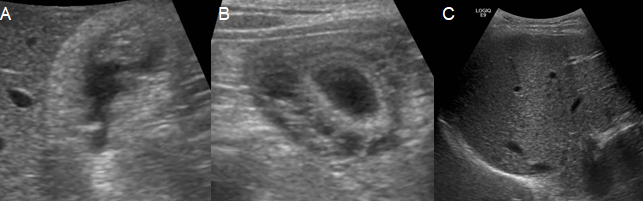
Acute hepatitis refers to a range of conditions marked by the acute inflammation of the hepatic parenchyma or damage to hepatocytes, leading to increased liver function indices. In acute hepatitis, typical ultrasound findings often appear normal. However, gallbladder atrophy and gallbladder wall thickening are the most common findings in acute hepatitis, which could sometimes lead to misdiagnosis as acute cholecystitis (Figure 3A & 3B) [5]. Along with hepatic enlargement, diffuse low-echoic liver parenchyma can be observed, and periportal edema, a form of edema around the portal vein, may be present. This edema emphasizes the reflection of the portal vein walls, a phenomenon known as the “starry night liver sign” (Figure 3C) [6, 7]. On the other hand, it is possible to observe on ultrasound that the gallbladder, which was shrunken in the acute phase, reversibly returns to its normal size as the disease recovers.
Chronic Hepatitis
Chronic hepatitis is characterized by liver inflammation persisting for a minimum of six months. The ultrasound findings for chronic hepatitis vary depending on the disease’s progression stage (Figure 4). In the early or mild stages of chronic hepatitis, ultrasound findings may appear normal. However, as the disease progresses, irregularities in hepatic parenchyma can become evident, characterized by nodular and irregular echoes. The changes in the hepatic parenchyma in chronic hepatitis are not as severe or irregular as those seen in cirrhosis, but there are no specific ultrasound criteria to clearly differentiate between chronic hepatitis and cirrhosis. In severe chronic hepatitis cases, rough hepatic parenchymal echoes, a blunted edge, enlargement of the left liver lobe, an irregular hepatic surface, mild hepatic hypertrophy, and splenomegaly can occur. Even in mild chronic hepatitis or early-stage cirrhosis cases, ultrasound examinations may appear normal. Therefore, chronic liver disease cannot be ruled out based solely on ultrasound findings [8]. It has been reported that up to 25% of patients diagnosed with chronic hepatitis or early-stage cirrhosis based on histology may not show corresponding ultrasound findings [9].
Liver Cirrhosis
Liver cirrhosis, the end stage of chronic liver damage, is characterized by morphological changes such as micronodular fibrosis and the formation of regenerative nodules, leading to increased portal pressure [10]. Accurate diagnosis of cirrhosis through radiological studies requires identifying both the morphological alterations in the liver and the hemodynamic changes affecting surrounding organs. In alcohol-related liver disease or hepatitis C, cirrhosis often presents as micronodular cirrhosis, with regenerative nodules smaller than 3 mm. Conversely, macronodular cirrhosis, characterized by nodules larger than 3 mm, is commonly associated with hepatitis B. Macronodular cirrhosis exhibits more pronounced surface irregularities due to larger nodules, while surface irregularities in micronodular cirrhosis are finer and less apparent [11].
Ultrasound imaging is capable of detecting several morphological changes in liver cirrhosis (Figure 5). These include coarse echotexture in the hepatic parenchyma, an irregular hepatic surface, reduction in the right lobe’s size (particularly the right posterior segment), and a decreased size in the fourth segment (indicated by a cross-sectional length of less than 3 cm) [12, 13]. Additionally, the liver’s left and caudal lobes may appear disproportionately large [14]. Ascites, thickening of the gallbladder wall, and splenomegaly commonly accompany these changes. However, these ultrasound findings of cirrhosis may not always correlate with worsening blood test results. In severe fatty liver disease leading to cirrhosis, the hepatic parenchymal echotexture might not show clear changes, posing diagnostic challenges. Hemodynamic changes include portal blood vessel dilatation (main vein diameter > 13 mm), decreased portal blood flow rate, altered portal blood flow direction, and changes in hepatic vein blood flow patterns, with observed umbilical vein as lateral blood flow and expanded left gastric vein [15]. As cirrhosis progresses and portal hypertension worsens, intrahepatic blood flow changes, leading to many studies measuring these changes using ultrasound examinations.
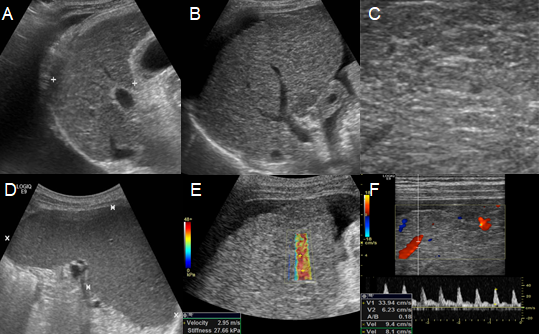
Figure 5: Ultrasound findings of patients with decompensated liver cirrhosis. An intercostal scan shows a moderate amount of right pleural effusion, (A) and displays atrophy of the right liver lobe (B). The hepatic parenchyma appears highly echogenic with numerous regenerative nodules, exhibiting diverse echoes ranging from low to high (C). A left intercostal scan shows splenomegaly more than 12 cm in length (D). Elastography demonstrates increased stiffness (E). Doppler flow of the portal vein is decreased to less than 15 cm/sec (F).
Under normal conditions during regular respiration, the main portal vein’s diameter is typically less than 13 mm [16]. An increase in this diameter can indicate cirrhosis. If intrahepatic resistance increases due to cirrhosis, resulting in a portal vein blood flow velocity of less than 15 cm/sec, portal hypertension can be diagnosed [17]. The direction of blood flow in the main portal vein changes to hepatofugal flow. As portal pressure increases and intrahepatic resistance rises, portal blood flow decreases, and hepatic artery blood flow compensatorily increases [18]. The normal Doppler waveform of the hepatic vein, initially triphasic due to cardiac blood flow influence, becomes biphasic or monophasic as cirrhosis progresses [19]. A previous study reported that a scoring system using ultrasound evaluations of liver surface irregularities, hepatic parenchymal echo changes, right lobe atrophy, splenomegaly, splenic vein thickness, and the presence of hepatic venous waveforms was highly correlated with liver tissue fibrosis (Table 1) [20].
| Clinical features | Score | ||
|---|---|---|---|
| 0 | 1 | 2 | |
| Surface and edge | Smooth and sharp | Mildly irregular and mildly blunted | Irregular and blunted |
| Parenchyma echogenicity | Fine | Mildly coarse | Corase |
| Right lobe atrophy | Absenta | Presentb | |
| Spleen size (cm) | < 10 | 10–14 | > 14 |
| Splenic vein diameter (cm) | < 0.7 | 0.7–0.9 | > 0.9 |
| Hepatic vein waveform | Triphasic | Bi or monophagic |
Table 1: Fibrosis scoring system by ultrasonography [20].
The total score from six ultrasonographic indices including surface nodularity and edge shape (0-2), parenchyma echogenicity (0-2), right lobe atrophy (0-2), spleen size (0-2), splenic vein diameter (0-2) and hepatic vein waveform (0- 1) was calculated. aRight lobe maximal oblique diameter > 7 cm with no subphrenic ascites. bRight lobe maximal oblique diameter < 10 cm with subphrenic ascites.
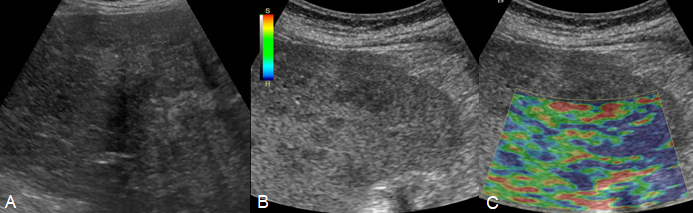
FibroScan®
The recently developed ultrasound pulse diagnostic device, FibroScan®, represents a novel method for assessing liver fibrosis (Figure 6). It measures liver elastography non- invasively and quickly. A probe, consisting of a vibrator and an ultrasound transducer, is placed perpendicular to the patient’s intercostal area. Upon pressing a button, vibration- induced elastic waves are transmitted to the tissue, captured by the ultrasound transducer, and the velocity of these elastic waves is measured. Previous studies suggest that liver elasticity, as measured by this ultrasound pulse diagnostic device, correlates significantly with the degree of liver fibrosis determined by liver histology and shows significant differences in liver elasticity by the clinical disease of chronic liver disease.
The advantages of ultrasound pulse diagnostic devices include being painless, rapid, and easy to perform without complications. There is also little variability in test results between different examiners. Furthermore, it can reflect the degree of fibrosis in the entire liver as it tests a large volume of liver tissue, about 100 times the volume taken during a liver biopsy. However, FibroScan® results may be less accurate in individuals with a body mass index of 30 or more, moderate to severe ascites, biliary obstruction, or scarring around the liver from surgery or radiation.
| CAP | Steatosis Grade | Amount of Liver showing Fatty Change |
|---|---|---|
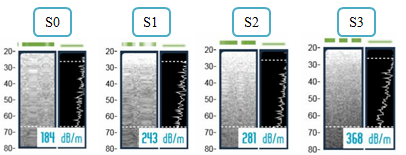
| 150 to 238 dB/m | S0 | 0% to 10% |
| 238 to 260 dB/m | S1 | 11% to 33% |
| 260 to 290 dB/m | S2 | 34% to 66% |
| Higher than 290 dB/m | S3 | 67% or more |
Table 2: Criteria for CAP score in FibroScan®. CAP Controlled Attenuation Parameter; dB/m decibels per meter.
The CAP (Controlled Attenuation Parameter) score measures the percentage of fatty changes in the liver, dividing the steatosis grade into S0, S1, S2, and S3. The unit for measuring liver stiffness is kilopascals (kPa). Generally, a normal liver is indicated by 5.4 kPa or less, liver fibrosis by 5.5-10.9 kPa, and cirrhosis by 11 kPa or more (Table 2) [21, 22].
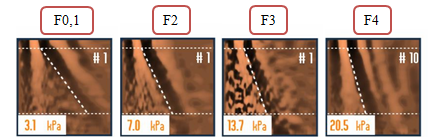
In the assessment of the extent of liver fibrosis, sensitivity and specificity are generally known to increase in cases where fibrosis has progressed (Figure 7). While the liver stiffness measurements for each stage of the METAVIR classification, which divides liver fibrosis histologically, may vary slightly depending on the underlying disease (Table 3) [23, 24]. The cutoff values required for predicting cirrhosis using liver stiffness measurements (LSM) vary by study, ranging from 11.8 kPa to 17.3 kPa (Table 4). The reason for these differences in cutoffs across studies is due to the varying distribution of cirrhosis in each study population [25]. The cutoff values for cirrhosis in chronic hepatitis B tend to be lower than those for chronic hepatitis C and this can be explained by the fact that chronic hepatitis B is the most common cause of macronodular cirrhosis, which tends to have a smaller total amount of fibrosis within the liver [26].
| Stage of Fibrosis (METAVIR Classification) | |
|---|---|
| F0 | No fibrosis |
| F1 | Stellate enlargement of portal tract but without septa formation |
| F2 | Enlargement of portal tract with rare septa formation |
| F3 | Numerous septa without cirrhosis |
| F4 | Cirrhosis |
Table 3: METAVIR classification for hepatic fibrosis score in FibroScan®.
| F0-F1 (kPa) | F2 (kPa) | F3 (kPa) | F4 (kPa) | |
|---|---|---|---|---|
| Hepatitis B | ≤ 6 | 6.1–9 | 9.1–10.9 | ≥ 11 |
| Hepatitis C | ≤ 7 | 7.1–9.4 | 9.5–12.4 | ≥ 12.5 |
| Hepatitis C (HIV) | ≤ 7 | 7.1–10 | 10.1–13.9 | ≥ 14 |
| Cholestatic Liver Disease | ≤ 7 | 7.1–9.9 | 10–16.9 | ≥ 17 |
| Autoimmune Hepatitis | ≤ 6.2 | 6.3–8.4 | 8.5–12.3 | ≥ 12.4 |
| NAFLD/NASH | ≤ 7 | 7.1–9.9 | 10–13.9 | ≥ 14 |
| Alcoholic Liver Disease | ≤ 6 | 6.1–7.9 | 8–12.4 | ≥ 12.5 |
| High Probability of Varcies | – | – | – | ≥ 19.5 |
| Low probability of CSPH | – | – | – | < 17 |
Table 4: Cut-off value of METAVIR score according to various liver diseases. HIV Human immunodeficiency virus; NAFLD Non-alcoholi
Conclusion
Ultrasonography is extremely useful in the diagnosis and follow-up examinations of chronic liver disease. Continuous monitoring of ongoing changes is particularly essential, and attention should be paid to the emergence of new lesions. Especially, continuous changes should be monitored vigilantly, and the appearance of new lesions should be noted. In situations where it becomes difficult to diagnose and determine the progression of the disease with ultrasound alone, additional imaging tests, along with blood tests, should be conducted. This approach is important to avoid missing advanced liver diseases, including hepatocellular carcinoma.
Conflicts of Interest
The authors declare no competing financial or other interests in relation to this article.
Author Contributions
Conception and design: Jun-young Seo Drafting of the article: Ha Young Kim, Boram Seo, Jun-young Seo Critical revision of the article for intellectual content: Jun- young Seo
References
-
Kudo M, Shiina T, Moriyasu F, Lijima H, Tateishi R, et al. (2013) JSUM ultrasound elastography practice guidelines: liver. J Med Ultrason (2001) 40(4): 325-357.
-
Boyce CJ, Pickhardt PJ, Kim DH, Taylor AJ, Winter CT, et al. (2010) Hepatic Steatosis (Fatty Liver Disease) in Asymptomatic Adults Identified by Unenhanced Low- Dose CT. American Journal of Roentgenology 194(3): 623-628.
-
Alpern MB, Lawson TL, Foley WD, Perlman SJ, Reif LJ, et al. (1986) Focal hepatic masses and fatty infiltration detected by enhanced dynamic CT. Radiology 158: 45-49.
-
Joy D, Thava VR, Scott BB (2003) Diagnosis of fatty liver disease: is biopsy necessary? European journal of gastroenterology & hepatology 15(5): 539-543.
-
Jüttner H, Ralls P, Quinn M, Jenney J (1982) Thickening of the gallbladder wall in acute hepatitis: ultrasound demonstration. Radiology 142(2): 465-466.
-
Zwiebel WJ (1995) Sonographic diagnosis of diffuse liver disease. Seminars in Ultrasound, CT and MRI 16(1): 8-15.
-
Needleman L, Kurtz A, Rifkin M, Cooper H, Pasto M, et al. (1986) Sonography of diffuse benign liver disease: accuracy of pattern recognition and grading. American Journal of Roentgenology 146(5): 1011-1015.
-
Sandford NL, Walsh P, Matis C, Baddeley H, Powell LW (1985) Is ultrasonography useful in the assessment of diffuse parenchymal liver disease? Gastroenterology 89(1): 186-191.
-
Goyal N, Jain N, Rachapalli V, Cochlin D, Robinson M (2009) Non-invasive evaluation of liver cirrhosis using ultrasound. Clinical radiology 64(11): 1056-1066.
-
Matsutani S, Fukuzawa T, Ebara M, Ohto M (1994) Ultrasonography in the diagnosis of liver cirrhosis. Nihon Rinsho 52(1): 56-62.
-
Yeom SK, Lee CH, Cha SH, Park CM (2015) Prediction of liver cirrhosis, using diagnostic imaging tools. World J Hepatol 7(17): 2069-2079.
-
Brown JJ, Naylor MJ, Yagan N (1997) Imaging of hepatic cirrhosis. Radiology 202(1): 1-16.
-
Lafortune M, Matricardi L, Denys A, Favret M, Déry R, et al. (1998) Segment 4 (the quadrate lobe): a barometer of cirrhotic liver disease at US. Radiology 206(1): 157-160.
-
Harbin WP, Robert NJ, Ferrucci JT (1980) Diagnosis of cirrhosis based on regional changes in hepatic morphology: a radiological and pathological analysis. Radiology 135(2): 273-283.
-
Iranpour P, Lall C, Houshyar R, Helmy M, Yang A, et al. (2016) Altered Doppler flow patterns in cirrhosis patients: an overview. Ultrasonography 35(1): 3-12.
-
Bolondi L, Gandolfi L, Arienti V, Caletti GC, Corcioni E, et al. (1982) Ultrasonography in the diagnosis of portal hypertension: diminished response of portal vessels to respiration. Radiology 142(1): 167-172.
-
Zironi G, Gaiani S, Fenyves D, Rigamonti A, Bolondi L, et al. (1992) Value of measurement of mean portal flow velocity by Doppler flowmetry in the diagnosis of portal hypertension. Journal of Hepatology 16(3): 298-303.
-
Gorka W, Kagalwalla A, McParland BJ, Kagalwalla Y, Al Zaben A (1996) Diagnostic value of Doppler ultrasound in the assessment of liver cirrhosis in children: histopathological correlation. Journal of clinical ultrasound 24(6): 287-295.
-
Baik SK, Kim JW, Kim HS, Kwon SO, Kim YJ (2006) Recent variceal bleeding: Doppler US hepatic vein waveform in assessment of severity of portal hypertension and vasoactive drug response. Radiology 240(2): 574-580.
-
Moon KM, Kim G, Baik SK, Choi E, Kim MY, et al. (2013) Ultrasonographic scoring system score versus liver stiffness measurement in prediction of cirrhosis. Clin Mol Hepatol 19(4): 389-398.
-
Ziol M, Handra-Luca A, Kettaneh A, Christidis C, Mal F, et al. (2005) Noninvasive assessment of liver fibrosis by measurement of stiffness in patients with chronic hepatitis C. Hepatology 41(1): 48-54.
-
Castera L, Vergniol J, Foucher J, Bail BL, Chanteloup E, et al. (2005) Prospective comparison of transient elastography, Fibrotest, APRI, and liver biopsy for the assessment of fibrosis in chronic hepatitis C. Gastroenterology 128(2): 343-350.
-
Theise ND (2007) Liver biopsy assessment in chronic viral hepatitis: a personal, practical approach. Mod Pathol 20 Suppl1: S3-14.
-
Kim SU, Jang HW, Cheong JY, Kim JK, Lee MH, et al. (2011) The usefulness of liver stiffness measurement using FibroScan in chronic hepatitis C in South Korea: a multicenter, prospective study. J Gastroenterol Hepatol 26(1): 171-178.
-
Poynard T, Halfon P, Castera L, Munteanu M, Bismut FI, et al. (2007) Standardization of ROC curve areas for diagnostic evaluation of liver fibrosis markers based on prevalences of fibrosis stages. Clin Chem 53(9): 1615- 1622.
-
Castera L, Forns X, Alberti A (2008) Non-invasive evaluation of liver fibrosis using transient elastography. J Hepatol 48(5): 835-847.
- Ramsay Hunt Syndrome Presenting as Gait Imbalance without Facial Paralysis: A Case Report
- Unveiling Hidden Culprits: An Observational Study of Upper Gastrointestinal Endoscopy Findings in Symptomatic Cholelithiasis Patients
- Assessing Health Care Providers’ Proficiency in International Patient Safety Goals: A Study to Assess the Knowledge &Practice on Patient Safety in a Tertiary Care Teaching Hospital in Gujarat
- Challenges in Diagnosing Child Language Disorders
- Stunting Service Management Model in the South-Central Timor Region, East Nusa Tenggara, Indonesia
- Acute Small Bowel Obstruction Presenting as Gangrenous Jejunal Loop Secondary to Intestinal Endometriosis – A Rare Case Report