Heavy Metals Analysis and Health Risk Assessment of Three Fish Species, Surface Water and Sediment Samples in Ogbaru Axis of River Niger, Anambra State, Nigeria
Human activities on environmental resources have negatively affected floras and faunas in maintaining fair balance. In this research study, selected heavy metals (Al, As, Cd, Cr, Cu, Fe, Hg, Pb, Ni, Zn) concentration in three fish species (Clarias gariepinus, Heterotis niloticus and Anguilla labiate), surface water and sediment samples in Ogbaru axis of River Niger, Anambra State, Nigeria. We evaluated the samples using atomic absorption spectrophotometer (AAS). The result of heavy metal analysis in fish samples showed that in decreasing order in Clarias garipinus in increasing order of Cu >Fe > Ni > Hg > Pb > Zn > As > Cd > Al > Cr, while Heterotis niloticus followed the order Cu > Zn > Fe > Ni > Pb > Cd > Al > As > Hg > Cr, and Anguilla labiate followed the pattern of Cu > Fe > Zn > Ni > Pb > Cd > Cr > As > Hg > Al. For surface water, As, Cd, Cr, Cu, Fe, Hg and Pb showed high concentration for the raining season compared to dry season, as Al, Ni and Zn were dominant during dry season, while sediment samples of Cr, Cu, Ni and Pb concentration in raining season were higher than dry season and vice versa for other As, Cd, Fe, Hg, Zn. Correlation matrices showed positive value showing that heavy metals were from a similar source with migration route and vice versa for negative correlation. Health and exposure risk assessment was conducted for carcinogenic and non-carcinogenic exposure in adults and children, where the cumulative cancer risk was within USEPA regulatory standard and cumulative hazard index were above 1 for adults (2.02) and children (4.93), implying that children are at risk of having adverse health issues compared to adults. Therefore, there is a need for regulatory advocacy and special care to mitigate anthropogenic release and safeguard the environment.
Introduction
The influence of human activities has been known to cause immerse environmental impact over a long period, which has made it difficult to contain pollution across environmental matrices especially in aquatic environment [1, 2, 3]. All over the world, water bodies are continuously overburdened with chemical effluents that have led to increase in heavy metals, pesticides, aromatic and aliphatic hydrocarbons, making it unfit for survival of aquatic organisms and inhibit water aesthetic [4, 5, 6, 7]. Heavy metals are metallic chemical element with relatively high density that are toxic or poisonous at low concentrations to organisms [8].
According to USEPA [9], heavy metals are classified as nutritional metals example are chromium (iii), copper, cobalt, iron, manganese, molybdenum, selenium, zinc; non-essential metals are aluminum, arsenic, cadmium, lead, mercury, silver that is been debated by scientific critics [9, 10]. Heavy metals in trace toxic amount can cause oxidative stress in relation to ecotoxicity in the aquatic organisms [11], as Woo, et al_._ [12] infers that degradation of bacteria is possible in marine environment. Due to anthropogenic releases, sediment and water sources are influenced negatively across various environmental factors such as temperature, dissolved oxygen, pH, and conductivity that in-turns causes potential threat to aquatic organisms and mammals over a period [13, 14].
Aquatic organisms ingest phytoplankton and dissolved food source in water with high metallic ions via ion-exchange across lipophilic membranes or adsorption on tissue or membrane surface, as such leads to increase metallic bioaccumulation, which thereafter is eaten by other aquatic mammals and humans [15, 16, 17]. Fish has over the decade been a major protein source for humans, which entails that peradventure these aquatic organisms or mammals have extreme concentration of heavy metals, after human consumption, it can lead to adverse health effect from high toxicity and chemical interaction with human organs and tissues [18]. Several studies have conducted heavy metal assessment across different aquatic organisms, which gives divergent inference in relation to anthropogenic pollutants [18, 19, 20, 21].
The purpose of this study is the evaluation and health risk assessment of heavy metals in selected fish species, water and sediment from Ogbaru axis of River Niger, Ogbaru local government area, Anambra state, Nigeria.
Materials and Methods
Study area
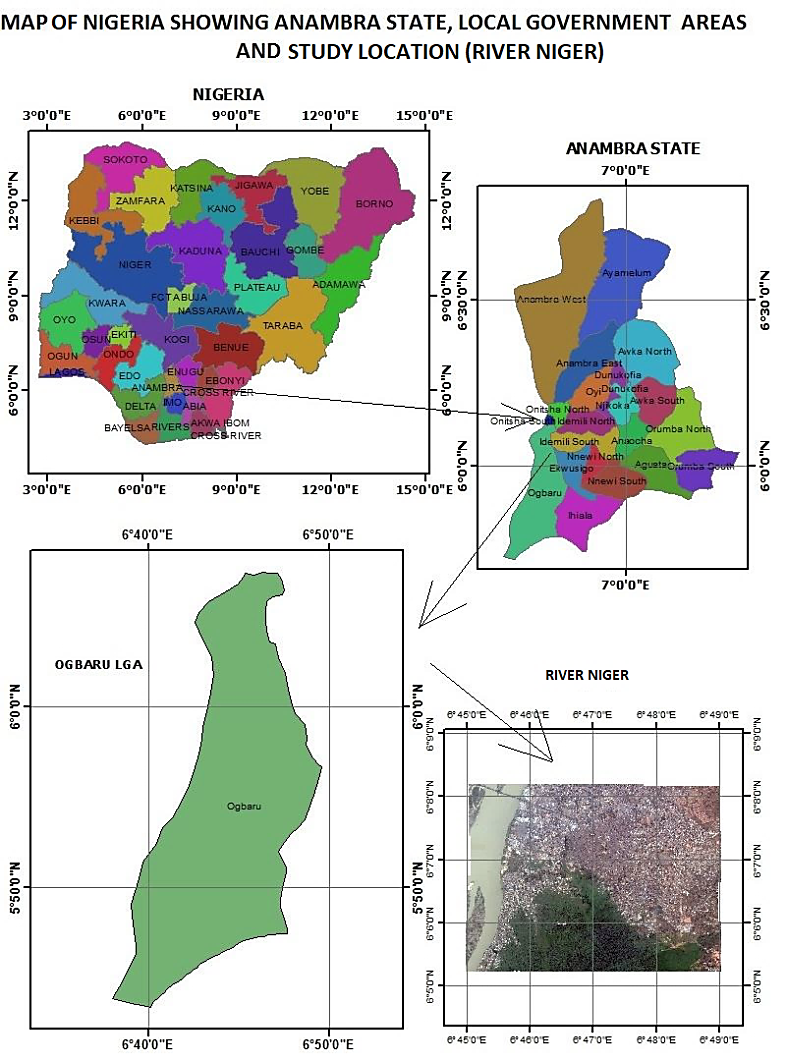
The study area was Ogbaru axis of River Niger as shown in Figure 1. Ogbaru local government area has an area of 453 km² in Anambra State, Nigeria, which is bounded to the north by Onitsha South local government area, in the west by the River Niger, in the south-east by Ihiala local government area, and in the east by Ekwusigo and Idemili South local government areas.
The River Niger in Ogbaru axis arises from a combination of two springs from Cameroun mountain, Cameroun and Guinea Highland, Guinea, that co-joins in Kogi State, Nigeria [22]. The water is discharged into diverse tributaries in the Niger Delta, which thereafter is deposited into the Atlantic Ocean. A closer investigation into the Rivers Niger shows that several commercial activities such as farming and fishing activities, oil and gas exploration and solid mineral mining is abundant across a large expanse of river lines, as such the water volume fluctuates significantly as a result of natural and man-made influences that causes extreme flooding in Niger Delta, Nigeria [23].
Sample Collection and Preparation
Three sample regiments (fish, surface water and sediment) were collected across Ogbaru axis of the River Niger. Three species of fish samples: Clarias gariepinus (Cat fish), Heterotis niloticus (African arowana) and Anguilla labiata (African mottled eel) were bought from the local market close to the study area. The fish samples were of similar size, which was labelled accordingly, packaged in a polyethene bag and transported to the laboratory for chemical evaluation.
The surface water and sediment samples were obtained via two seasons (wet and dry season), which was collected at different three (3) positions with a distance of five (5) meters and mixed to form a composite mixture, thereafter was packaged in a precleaned plastic container, labelled accordingly and subsequently sent to the laboratory for chemical evaluation [25].
Laboratory Analysis
Digestion of fish sample: Fish samples were dried at 105˚C in a laboratory oven until they reach a constant weight. The dried samples were grounded using a porcelain mortar and a pestle, as 5g of ground fish samples were weighed into Teflon crucible with 10ml of freshly prepared concentrated HCl/ HNO3 (aqua-regia) in the rations of 3:1 added to each sample, thereafter allow the crucible was covered and allowed to solubilize. The samples in the crucibles were heated in the oven at a constant temperature of 150°C for 2 hours until the solution became clear and completely digested as the samples were cooled. 10ml of deionized water was added to each sample and filtered using Whatman filter paper into 250ml volumetric flask, and made up to 250 ml level with deionized water for metal determination of arsenic (As), mercury (Hg), lead (Pb), aluminum (Al), cadmium (Cd), nickel (Ni), copper (Cu), chromium (Cr), zinc (Zn) and iron (Fe) using Varian AA240 atomic absorption spectrophotometer.
Digestion of surface water samples: 5 ml of 10 M concentrated HCl were added to 250 ml of surface water samples in 500 ml beaker, which was placed in water bath at 80°C and allowed to evaporate to 25ml. The concentrate was transferred to a 50 ml volumetric flask and diluted to mark with deionized water. Prior to analysis, the solution was filtered using Whatman filter paper as indicated by Izuchukwu, et al. [26]. Similar metal determination was done accordingly to Braid et al. [25] procedure.
Digestion of sediment samples: Sediment samples were dried at 105°C in a laboratory oven for 1 hour, thereafter the sediment was ground into fine powder using pestle and mortar. 5g of sediment sample were weighed into a 250ml beaker as 50ml deionized water, 0.5ml of concentrated HNO3 and 5ml of concentrated HCl was added accordingly.
The beaker was thereafter placed on a hot plate in a fume cupboard for digestion to prevent chemical spillage and allowed to evaporate to 15ml. the beaker were removed and allowed to cool to room temperature, as the digestate were filtered into a 50ml volumetric flask and made up to 50ml mark with deionized water, then metal determination was conducted as done for water samples.
Data Analysis: Microsoft Excel 2019 data analysis was utilized for determination of correlation matrix, which evaluates the strength and direction of a linear relationship between two variables (or metal ions of interest). Correlation coefficient of value greater than 0.71 is accepted for correlation matrix at significance level of 0.05 [27].
Health risk assessment: Cancer risk (CR) and Hazard Quotient (HQ) are indices developed by USEPA risk assessment models for evaluation of carcinogenic and non- carcinogenic health risk in adults and children in relation to fish, surface water and sediment samples in Ogbaru axis of river Niger. Exposure route were employed which is Fish (dietary ingestion), surface water (dermal and ingestion) and Sediment (dermal, accidental ingestion and inhalation) [28, 29]. The formulas are shown below:
Where C is the concentration of heavy metal in sample; EF is exposure frequency; ED is exposure duration; IRx is ingestion rate of sample; SA is skin surface area; RBA*: relative bioavailability for sediment calculation only; AF: adherence factor; Kp: dermal permeability constant for sediment calculation only; GIABS is gastrointestinal absorption factor for sediment calculation only; ET is inhalation exposure time; AT: average time; BW is body weight; PEF is particulate emission factor; VF is volatilization factor Tables 1 & 2.
| Parameter | Unit | Adult | Children |
|---|---|---|---|
| Concentration of heavy metals (C) | mg/kg | Laboratory data | Laboratory data |
| Exposure frequency (EF) | day/year | 350 | 350 |
| Exposure duration (ED) | years | 30 | 6 |
| Fish ingestion rate (IRF) | mg/day | 30400 | 12225 |
| Water ingestion rate (IRW) | L/day | 1.704 | 2.88 |
| Sediment ingestion rate (IRS) | mg/day | 100 | 200 |
| Relative bioavailability (RBA) | unitless | See Table 2 | See Table 2 |
| Skin surface area for soil (SAS) | cm²/day | 6,032 | 2,373 |
| Skin surface area for water SAW | cm² | 19652 | 6365 |
| Adherence factor (AF) | mg/cm² | 0.07 | 0.2 |
| Skin adsorption factor ABS | unitless | See Table 2 | See Table 2 |
| Dermal permeability constant (Kp) | unitless | 0.001 | 0.001 |
Table 1: Parameters used to evaluate health risk assessment [30-33].
- Gastrointestinal absorption factor (GIABS) dimensionless
- See Table 2
- See Table 2
- Inhalation exposure time (ET) hr/day
- 6
- 9
- Average time (AT) – carcinogen days/yr
- 25,550
- 25,550
- Average time (AT) – non-carcinogen days/yr
- 10,950
- 2,160
- Body weight (BW)
- Kg
- 80
- 15
- Volatilization factor (VF) m3/kg
- 1.00×10⁵
- 1.00×10⁵
- Particulate emission factor (PEF) m3/kg
- 6.79×10⁸
- 1.36×10⁹
- Cancer slope factor (CSF)
- (mg/kg/day)-1
- See Table 2
- See Table 2
- Refernce dose (RfD) mg/kg/day
- See Table 2
- See Table 2
- Cancer inhalation unit risk (IUR)
- (mg/m3)-1
- See Table 2
- See Table 2
- Reference inhalation concentration (RfC) mg/m3
- See Table 2
- See Table 2
Table 2: Parameters used to evaluate health risk assessment [30-33].
| Heavy metal | CSF (mg/kg/day)-1 | RfD (mg/kg/day) | IUR (mg/m3)-1 | RfC (mg/m3) | RBA | GIABS |
|---|---|---|---|---|---|---|
| Al | No CSF | 1.00 | No IUR | 0.005 | 1 | 1 |
| As | 1.5 | 0.0003 | 4.3 | 0.000015 | 0.6 | 1 |
| Cd (dietary) | No CSF | 0.001 | 1.8 | 0.00001 | 1 | 0.025 |
| Cd (water) | 6.3 | 0.0005 | 1.8 | 0.00001 | 1 | 0.05 |
| Cr (III) | No CSF | 1.50 | No IUR | 0.005 | 1 | 0.013 |
| Cr (VI) | 0.5 | 0.003 | 84 | 0.0001 | 1 | 0.025 |
| Cu | No CSF | 0.04 | No IUR | 0.004 | 1 | 1 |
| Fe | No CSF | 0.70 | No IUR | 0.8 | 1 | 1 |
| Hg | No CSF | 0.0003 | No IUR | 0.0003 | 1 | 0.07 |
| Ni | 0.84 | 0.02 | 0.26 | 0.00009 | 1 | 0.04 |
| Pb | 0.0085 | 0.0035 | 0.0085 | 0.0035 | 1 | 1 |
| Zn | No CSF | 0.30 | No IUR | 0.03 | 1 | 1 |
Table 3: Reference values for health risk assessment [30-33].
No CSF; No IUR – reference value unavailable Table 2: Reference values for health risk assessment [30, 31, 32, 33].
Results
Heavy metal concentration in fish samples
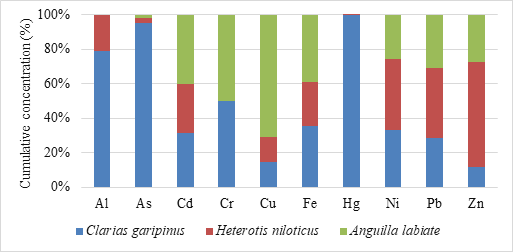
Table 3 and Figure 2 shows the concentration of heavy metals in different fish species assessed in Ogbaru axis of River Niger. The highest concentration of aluminum (Al) was indicated in Clarias gariepinus, followed by Heterotis niloticus with the concentration 0.019mg/kg and 0.005mg/kg respectively, as Ismaniza, et al. [5] observed a concentration range of 15.39 – 320.6 mg/kg for aluminum that was attributed to industrial waste, erosion, dissolution of minerals and salts, atmospheric dust pollution and rain [34]. Highest concentration of arsenic (As) was seen in Clarias gariepinus having 0.093mg/kg while the lowest concentration of 0.002mg/kg was found in Anguilla labiate which was lower than those reported in Zrnčić, et al. [35]
study ranging between 0.021–0.048 μg/g for Cyprinus carpio. Ashraf, et al. [1] observed a concentration of 0.87 mg/kg for Hampala macrolepidota from a tin mining catchment area.
Chromium (Cr) concentration was 0.001mg/kg in Clarias gariepinus and Anguilla labiate. The mean concentration of Cu ranged 2.16mg/kg – 10.56mg/kg as the highest value was found in Anguilla labiate with the lowest in Clarias gariepinus, which was far below Cu in Ikema and Egieborb [36] assessment in fish sample having 0.03mg/ kg. Mercury concentration was highest in Clarias gariepinus having 0.311mg/kg, which is lower than commission of the European communities [37] guideline of 0.5mg/kg. The mean lead concentration of Heterotis niloticus had highest concentration of 0.394mg/kg followed by Anguilla labiate with a concentration of 0.299mg/kg and the least value of 0.276mm/kg in Clarias gariepinus, which was below FAO/
WHO limit of 0.4mg/kg for fish species [38].
The concentrations of Cadmium ranged between 0.020mg/kg - 0.028mg/kg. The highest concentration was measured in the muscles of Anguilla labiate while the lowest was recorded from Heterotis niloticus. For zinc, the value recorded ranged between 0.245mg/kg - 1.242mg/kg for all three fish species. The highest concentration of nickel (0.514 mg/kg) was measured in Heterotis niloticus while the lowest concentration of 0.322mg/kg was detected in Anguilla labiate. The highest concentration of iron (Fe) was predominant in Anguilla labiate having 1.93mg/kg, while the lowest value of 1.23mg/kg was recorded in Heterotis niloticus.
| Heavy metal (mg/kg) | Clarias garipinus (Cat fish) | Heterotis niloticus (African Arowana) | Anguilla labiate (African mottled eel) |
|---|---|---|---|
| Al | 0.019±0.027 | 0.005±0.002 | 0.000±0.000 |
| As | 0.093±0.004 | 0.003±0.002 | 0.002±0.002 |
| Cd | 0.022±0.004 | 0.020±0.004 | 0.028±0.001 |
| Cr | 0.001±0.002 | 0.000±0.000 | 0.001±0.002 |
| Cu | 2.161±0.033 | 2.197±0.007 | 10.560±0.306 |
| Fe | 1.755±0.028 | 1.234±0.006 | 1.927±0.022 |
| Hg | 0.311±0.00058 | 0.00067±0.001 | 0.000±0.000 |
| Ni | 0.419±0.009 | 0.514±0.004 | 0.322±0.006 |
| Pb | 0.276±0.003 | 0.394±0.1 | 0.299±0.061 |
| Zn | 0.245±0.04 | 1.242±0.03 | 0.556±0.008 |
Table 4: Mean concentration of heavy metals in fish species.
Presented values shown as mean ± SD Table 3: Mean concentration of heavy metals in fish species.
Heavy Metal Concentrations in Surface Water and Sediment Samples
Table 4 and Figure 3 shows the concentration of heavy metals in surface water (mg/l) and sediments (mg/ kg) in seasonal variations (raining and dry seasons). For water samples, As, Cd, Cr, Cu, Fe, Hg and Pb showed high concentration for raining season in comparison to dry season, as Al, Ni and Zn were dominant during dry season respectively. Using percentage stark column arrangement (Figure 3i), we can see that Al and Zn was 100% at dry season, while As. was 100% at raining season; Cu and Pb had 96% for raining season and 4% for dry season. For sediment samples (Figure 3ii), Cr, Cu, Ni and Pb concentration in raining season were higher than dry season, and vice versa for dry season that is As, Cd, Fe, Hg, Zn were dominant, although As were similar in concentration for both season at 0.001 mg/kg. A view at Figure 3ii shows that As, Fe and Zn had 50%, 46% and 45% cumulative concentration for raining season as Al and Hg had 10% and 19% for raining season, while 90% and 81% for dry season respectively.
| Heavy metal | waterᵃ | waterᵇ | Sedimentᵃ | sedimentᵇ |
|---|---|---|---|---|
| Al | 0.000±0.000 | 0.246±0.058 | 0.160±0.018 | 1.458±0.892 |
| As | 0.005±0.003 | 0.000±0.000 | 0.0006±0.0009 | 0.001±0.003 |
| Cd | 0.032±0.026 | 0.270±0.190 | 0.316±0.059 | 0.788±0.131 |
| Cr | 0.099±0.084 | 0.039±0.023 | 0.112±0.052 | 0.030±0.023 |
| Cu | 0.186±0.167 | 0.007±0.011 | 0.029±0.042 | 0.022±0.033 |
| Fe | 2.308±0.823 | 0.180±0.063 | 2.371±0.216 | 2.653±0.918 |
| Hg | 1.501±1.093 | 0.195±0.017 | 0.150±0.035 | 0.614±0.302 |
| Ni | 0.254±0.067 | 0.773±0.464 | 0.945±0.189 | 0.781±0.134 |
| Pb | 0.724±0.789 | 0.023±0.014 | 0.039±0.024 | 0.002±0.003 |
| Zn | 0.000±0.000 | 2.903±1.263 | 0.766±1.016 | 0.931±1.397 |
Table 5: The concentrations of heavy metals in surface water and sediment samples.
a: raining season, b: dry season Presented values shown as mean ± SD Table 4: The concentrations of heavy metals in surface water and sediment samples.
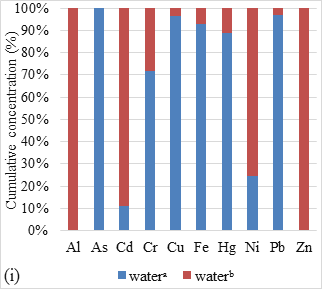
a: raining season, b: dry season Figure 3: percentage stark column of water and sediment samples.
Correlation Matrix of Fish, Surface Water and Sediment Samples
Pearson correlation was conducted for the heavy metal concentration in fish samples in relation to water and sediment as presented in Table 5. The correlation coefficient was significant at p ≤ 0.05 in most cases with presence of positive and negative correlation. A review of the three fish samples depicts that they had similar correlation matrices across all metal substrates in water and sediment samples attributed to bioaccumulation and bio-speciation of heavy metals and other pollutants in tandem to seasonal variation [39, 40, 41, 42].
A strong correlation indicates that metals across both fish and water/sediments have common pollution source and similar migration behavior, while if there is medium or weak correlation, it depicts that there is slight or no influence associated between the fish and water/sediment samples [43, 44]. In view of this correlating regression, positive values show that they are from similar or mutual source and reaction mode, while negative is associated to different polluting or interacting source and biochemical interaction taken place no associated to water and sediment samples [44, 45, 46].
Al As Cd Cr Cu Fe Hg Ni Pb Zn
Al -0.574 0.954 -0.181 -0.576 0.797 0.906 0.260 -0.671 0.747
As -0.481 -0.792 -0.702 0.999 -0.952 -0.173 -0.940 0.992 -0.970
C. garipinus and water Cd 0.994 -0.573 0.121 -0.793 0.941 0.739 0.536 -0.862 0.911 Cr -0.197 -0.765 -0.090 -0.700 0.449 -0.580 0.903 -0.608 0.519 Cu -0.505 0.999 -0.595 -0.747 -0.952 -0.176 -0.939 0.993 -0.970 Fe -0.979 0.292 -0.951 0.393 0.318 0.467 0.790 -0.983 0.997 Hg -0.625 -0.383 -0.537 0.888 -0.358 0.771 -0.173 -0.294 0.395 Ni 0.970 -0.252 0.937 -0.431 -0.278 -0.999 -0.797 -0.890 0.836 Pb -0.818 -0.111 -0.750 0.725 -0.084 0.918 0.961 -0.934 -0.990 Zn 0.999 -0.475 0.993 -0.204 -0.499 -0.980 -0.630 0.971 -0.822 Al -0.580 0.956 -0.166 -0.582 0.723 0.990 0.183 -0.648 -0.267 As -0.925 -0.793 -0.707 0.999 -0.982 -0.688 -0.907 0.996 0.940 Cd 0.998 -0.898 0.130 -0.794 0.893 0.988 0.462 -0.842 -0.537 H. niloticus and water Cr -0.139 0.506 -0.076 -0.705 0.562 -0.026 0.939 -0.644 -0.906 Cu -0.548 0.188 -0.600 -0.752 -0.983 -0.69 -0.906 0.997 0.939 Fe -0.864 0.991 -0.830 0.618 0.053 0.8123 0.812 -0.995 -0.859 Hg -0.412 0.728 -0.352 0.960 -0.537 0.814 0.318 -0.748 -0.399 Ni 0.874 -0.993 0.841 -0.602 -0.072 -0.999 -0.802 -0.867 -0.996 Pb -0.891 0.997 -0.860 0.574 0.107 0.998 0.781 -0.999 0.907 Zn 0.912 -0.999 0.884 -0.533 -0.156 -0.995 -0.749 0.996 -0.999 Al -0.583 0.959 -0.170 -0.583 0.851 0.990 0.327 -0.672 0.880 As -0.803 -0.788 -0.702 0.999 -0.923 -0.689 -0.959 0.993 -0.899 Cd 0.999 -0.792 0.115 -0.789 0.965 0.989 0.581 -0.854 0.978 A. labiate and water Cr -0.129 0.694 -0.111 -0.702 0.373 -0.032 0.876 -0.616 0.318 Cu -0.513 -0.100 -0.528 -0.785 -0.923 -0.69 -0.959 0.994 -0.899 Fe -0.982 0.902 -0.978 0.315 0.340 0.915 0.775 -0.961 0.998 Hg -0.395 0.865 -0.378 0.962 -0.586 0.563 0.455 -0.768 0.937 Ni 0.993 -0.869 0.990 -0.247 -0.406 -0.997 -0.503 -0.92 0.736 Pb -0.799 0.999 -0.788 0.699 -0.107 0.899 0.868 -0.865 -0.943 Zn 0.984 -0.897 0.980 -0.305 -0.349 -0.999 -0.554 0.998 -0.894 C. garipinus and sediment H. niloticus and sediment A. labiate and sediment
| Ln | 0.904 | 0.907 | 0.908 | 0.909 | 0.910 | 0.911 | 0.912 | 0.913 | 0.914 | 0.915 |
Table 6: Correlation matrix between fish samples in relation to water and sediment.
Table 6 represents correlation conducted for water and sediment samples during wet and dry season. We can see therefore that there was presence of positive and negative correlation across all heavy metals accessed. Al correlated with Cd (0.961) and Cr (-0.71) strongly, with As correlating with Cu (0.993), Hg (0.952), Ni (-0.911), Pb (0.976) and Zn (-0.772). vertical correlation of Cd and Cr produced medium and weak correlation, while Cu, Fe, Hg, Ni, Pb correlated strong, medium and weak accordingly, as there were presence of negative and positive correlation signifying all metal components were not from the same source and biochemical interaction mode between water and sediment samples [47, 48, 49, 50].
| Al | As | Cd | Cr | Cu | Fe | Hg | Ni | Pb | Zn | |
|---|---|---|---|---|---|---|---|---|---|---|
| Al | 1 | |||||||||
| As | -0.367 | 1 | ||||||||
| Cd | 0.961 | -0.567 | 1 | |||||||
| Cr | -0.710 | 0.533 | -0.652 | 1 | ||||||
| Cu | -0.442 | 0.993 | -0.644 | 0.524 | 1 | |||||
| Fe | 0.333 | 0.472 | 0.278 | 0.395 | 0.368 | 1 | ||||
| Hg | -0.14 | 0.952 | -0.390 | 0.248 | 0.943 | 0.426 | 1 | |||
| Ni | 0.296 | -0.911 | 0.547 | -0.200 | -0.930 | -0.168 | -0.962 | 1 | ||
| Pb | -0.497 | 0.976 | -0.699 | 0.499 | 0.994 | 0.268 | 0.929 | -0.949 | 1 | |
| Zn | 0.018 | -0.772 | 0.121 | -0.617 | -0.700 | -0.914 | -0.679 | 0.482 | -0.619 | 1 |
Table 7: Correlation matrices of water and sediment.
Correlation significant at p ≤ 0.05 Table 6: Correlation matrices of water and sediment.
Health Risk Assessment of Fish, Surface Water and Sediment Samples
Cancer risk: The result of carcinogenic risk assessment was conducted heavy metals (Al, As, Cd, Cr (III), Cr (VI), Cu, Fe, Hg, Ni, Pb, Zn) in fish samples, surface water and sediment in Ogbaru axis of River Niger as presented in Tables 7 & 8 across different exposure pathways in adults and children. Using USEPA reference range of 1.00E-06 – 1.00E-04 [51], one can see that both children and adults were within and above the range, which entails that there will be no associated cancer issues across different exposure pathways. The total exposure pathway (total CR) for adults is Al, Cr (III), Cu, Fe, Hg, Zn (0.00E+00), As (2.30E-05), Cd (1.74E-05), Cr (VI) 1.12E-06, Ni (1.72E-04), Pb (1.33E-06), while children is Al, Cr (III), Cu, Fe, Hg, Zn (0.00E+00), As (9.90E-06), Cd (2.14E-05), Cr (VI) (1.68E-06), Ni (7.83E-05), Pb (5.96E- 07). The cumulative cancer risk for adults is 2.15E-04, while children is 1.12E-04, which entails that there is likelihood that children will encounter cancer health risk compared to adults even though the value is within USEPA reference range [32]. Hazard quotient (HQ): The result of heavy metals (Al, As, Cd, Cr (III), Cr (VI), Cu, Fe, Hg, Ni, Pb, Zn) in Ogbaru axis of River Niger is presented in Tables 9 & 10. A review of hazard quotient evaluated for all exposure pathways in fish, surface water and sediment shows that HQ were less than 1 for adults, while for children were less than 1 except for fish dietary exposure (Anguilla labiate) in Cu having 2.09. The total exposure pathway (total HQ) of heavy metals for adult is Al (1.26E-05), As (1.19E-01), Cd (2.82E-02), Cr (III) (1.61E-06) , Cr (VI) (3.01E-04), Cu (1.36E+00), Fe (2.59E- 03), Hg (3.82E-01), Ni (2.30E-02) , Pb (1.01E-01), Zn (2.57E- 03), which shows that Cu is greater than 1 and vice versa for others heavy metals. For children, the total HQ is Al (4.39E- 05), As (2.60E-01), Cd (1.11E-01), Cr (III) (8.93E-06), Cr (VI) (4.45E-03) Cu (2.96E+00), Fe (5.89E-03), Hg (1.30E+00), Ni (5.42E-02) Pb (2.37E-01) Zn (6.36E-03), which shows that Cu and Hg were greater than 1 and less than 1 for other heavy metals. Therefore, we can see that the cumulative hazard quotient for adults is 2.02, while children are 4.93 implying children are extremely at risk in tandem to adults.
| Fish Exposure pathway | Surface water Exposure pathways | Sediment Exposure pathways | Total CR | |||||||||||
|---|---|---|---|---|---|---|---|---|---|---|---|---|---|---|
| Dietary Ingestion | Ingestion | Dermal | Ingestion | Dermal | Inhalation | |||||||||
| C.garipinus | H. niloticus | A. labiate | Waterᵃ | Waterᵇ | Waterᵃ | Waterᵇ | Sediment ᵃ | Sediment ᵇ | Sediment ᵃ | Sediment ᵇ | Sediment ᵃ | Sediment ᵇ | ||
| Al | No CSF | No CSF | No Data | No Data | No CSF | No Data | No CSF | No CSF | No CSF | No CSF | No CSF | No IUR | No IUR | 0.00E+00 |
| As | 2.18E-05 | 7.03E-07 | 4.68E-07 | 6.57E-11 | 0 | 5.30E-08 | 0 | 4.62E-10 | 4.62E-10 | 3.25E-12 | 3.25E-12 | 1.56E-10 | 1.56E-10 | 2.30E-05 |
| Cd | No CSF | No CSF | No CSF | 1.82E-09 | 1.49E-08 | 1.47E-06 | 1.20E-05 | 1.02E-06 | 2.55E-06 | 8.64E-08 | 2.15E-07 | 2.07E-08 | 5.15E-08 | 1.74E-05 |
| Cr (III) | No CSF | No Data | No CSF | No CSF | No CSF | No CSF | No CSF | No CSF | No CSF | No CSF | No CSF | No IUR | No IUR | 0.00E+00 |
| Cr (VI) | 7.81E-08 | No Data | 7.81E-08 | 4.33E-10 | 1.71E-10 | 3.50E-07 | 1.38E-07 | 2.88E-08 | 7.71E-09 | 4.86E-09 | 1.30E-09 | 3.42E-07 | 9.15E-08 | 1.12E-06 |
| Cu | No CSF | No CSF | No CSF | No CSF | No CSF | No CSF | No CSF | No CSF | No CSF | No CSF | No CSF | No IUR | No IUR | 0.00E+00 |
| Fe | No CSF | No CSF | No CSF | No CSF | No CSF | No CSF | No CSF | No CSF | No CSF | No CSF | No CSF | No IUR | No IUR | 0.00E+00 |
| Hg | No CSF | No CSF | No Data | No CSF | No CSF | No CSF | No CSF | No CSF | No CSF | No CSF | No CSF | No IUR | No IUR | 0.00E+00 |
| Ni | 5.50E-05 | 6.74E-05 | 4.22E-05 | 1.87E-09 | 5.68E-09 | 1.51E-06 | 4.59E-06 | 4.07E-07 | 3.29E-07 | 4.30E-08 | 3.47E-08 | 8.91E-09 | 7.19E-09 | 1.72E-04 |
| Pb | 3.66E-07 | 5.23E-07 | 3.97E-07 | 5.39E-11 | 1.71E-12 | 4.35E-08 | 1.38E-09 | 1.70E-10 | 8.73E-12 | 7.19E-13 | 3.69E-14 | 1.20E-11 | 6.17E-13 | 1.33E-06 |
| Zn | No CSF | No CSF | No CSF | No CSF | No CSF | No CSF | No CSF | No CSF | No CSF | No CSF | No CSF | No IUR | No IUR | 0.00E+00 |
| ∑ HM | 7.72E-05 | 6.87E-05 | 4.32E-05 | 4.24E-09 | 2.07E-08 | 3.42E-06 | 1.67E-05 | 1.46E-06 | 2.89E-06 | 1.34E-07 | 2.51E-07 | 5.42E-07 | 1.96E-07 | 2.15E-04 |
Table 8: Cancer risk (CR) of heavy metal exposure matrix in adults.
No data – Analytical data unavailable; No CSF; No IUR – reference value unavailable; Total CR: total cancer risk; ∑ HM: sum total of heavy metals. Table 7: Cancer risk (CR) of heavy metal exposure matrix in adults.
| Fish Exposure pathway | Surface water Exposure pathways | Sediment Exposure pathways | Total CR | |||||||||||
|---|---|---|---|---|---|---|---|---|---|---|---|---|---|---|
| Dietary Ingestion | Ingestion | Dermal | Ingestion | Dermal | Inhalation | |||||||||
| C.garipinus | H. niloticus | A. labiate | Waterᵃ | Waterᵇ | Waterᵃ | Waterᵇ | Sediment ᵃ | Sediment ᵇ | Sediment ᵃ | Sediment ᵇ | Sediment ᵃ | Sediment ᵇ | ||
| Al | No CSF | No CSF | No Data | No Data | No CSF | No Data | No CSF | No CSF | No CSF | No CSF | No CSF | No IUR | No IUR | 0.00E+00 |
| As | 9.34E-06 | 3.01E-07 | 2.01E-07 | 1.18E-10 | No Data | 5.23E- 08 | No Data | 9.86E-10 | 9.86E-10 | 3.90E-12 | 3.90E-12 | 4.68E-11 | 4.68E-11 | 9.90E-06 |
| Cd | No CSF | No CSF | No CSF | 3.28E-09 | 2.68E-08 | 1.45E- 06 | 1.19E-05 | 2.18E-06 | 5.44E-06 | 1.04E-07 | 2.58E-07 | 6.20E-09 | 1.55E-08 | 2.14E-05 |
| Cr (III) | No CSF | No Data | No CSF | No CSF | No CSF | No CSF | No CSF | No CSF | No CSF | No CSF | No CSF | No IUF | No CSF | 0.00E+00 |
| Cr (VI) | 3.35E-08 | No Data | 3.35E-08 | 9.84E-09 | 3.88E-09 | 3.45E- 07 | 1.36E-07 | 7.73E-07 | 2.07E-07 | 5.83E-09 | 1.56E-09 | 1.02E-07 | 2.75E-08 | 1.68E-06 |
| Cu | No CSF | No CSF | No CSF | No CSF | No CSF | No CSF | No CSF | No CSF | No CSF | No CSF | No CSF | No IUR | No IUR | 0.00E+00 |
| Fe | No CSF | No CSF | No CSF | No CSF | No CSF | No CSF | No CSF | No CSF | No CSF | No CSF | No CSF | No IUR | No IUR | 0.00E+00 |
| Hg | No CSF | No CSF | No Data | No CSF | No CSF | No CSF | No CSF | No CSF | No CSF | No CSF | No CSF | No IUR | No IUR | 0.00E+00 |
| Ni | 2.36E-05 | 2.89E-05 | 1.81E-05 | 3.37E-09 | 1.02E-08 | 1.49E- 06 | 4.53E-06 | 8.69E-07 | 7.01E-07 | 5.16E-08 | 4.16E-08 | 2.67E-09 | 2.16E-09 | 7.83E-05 |
| Pb | 1.57E-07 | 2.24E-07 | 1.70E-07 | 9.71E-11 | 3.09E-12 | 4.29E- 08 | 1.36E-09 | 3.63E-10 | 1.86E-11 | 8.62E-13 | 4.42E-14 | 3.61E-12 | 1.85E-13 | 5.96E-07 |
| Zn | No CSF | No CSF | No CSF | No Data | No CSF | No Data | No CSF | No CSF | No CSF | No CSF | No CSF | No IUR | No IUR | 0.00E+00 |
| ∑ HM | 3.31E-05 | 2.94E-05 | 1.85E-05 | 1.67E-08 | 4.10E-08 | 3.38E- 06 | 1.65E-05 | 3.83E-06 | 6.35E-06 | 1.61E-07 | 3.01E-07 | 1.63E-07 | 5.88E-08 | 1.12E-04 |
Table 9: Cancer risk (CR) of heavy metal exposure matrix in children.
No data – Analytical data unavailable; No CSF; No IUR – reference value unavailable; Total CR: total cancer risk; ∑ HM: sum total of heavy metals. Table 8: Cancer risk (CR) of heavy metal exposure matrix in children.
| Fish Exposure pathway | Surface water Exposure pathways | Sediment Exposure pathways | Total HQ | |||||||||||
|---|---|---|---|---|---|---|---|---|---|---|---|---|---|---|
| Dietary Ingestion | Ingestion | Dermal | Ingestion | Dermal | Inhalation | |||||||||
| C.garipinus | H. niloticus | A. labiate | Waterᵃ | Waterᵇ | Waterᵃ | Waterᵇ | Sediment ᵃ | Sediment ᵇ | Sediment ᵃ | Sediment ᵇ | Sediment ᵃ | Sediment ᵇ | ||
| Al | 6.92E-06 | 1.82E-06 | No Data | No Data | 5.02E-09 | No Data | 1.74E-06 | 1.92E-07 | 1.78E-06 | 3.47E-10 | 3.22E-09 | 1.36E-08 | 1.26E-07 | 1.26E-05 |
| As | 1.10E-01 | 3.64E-03 | 2.43E-03 | 3.4E-07 | No Data | 3.53E-08 | No Data | 2.04E-06 | 2.40E-06 | 2.17E-12 | 2.17E-12 | 8.47E-11 | 8.47E-11 | 1.19E-01 |
| Cd | 8.02E-03 | 7.29E-03 | 1.02E-02 | 1.35E-06 | 1.1E-05 | 2.33E-07 | 1.91E-06 | 7.58E-04 | 1.89E-03 | 1.37E-08 | 3.42E-08 | 2.68E-08 | 6.68E-08 | 2.82E-02 |
| Cr (III) | 2.43E-07 | No Data | 2.43E-07 | 1.35E-09 | 5.31E-10 | 7.00E-07 | 2.76E-07 | 8.95E-08 | 2.40E-08 | 1.87E-08 | 5.01E-09 | 9.49E-09 | 2.54E-09 | 1.61E-06 |
| Cr (VI) | 1.21E-04 | No Data | 1.21E-04 | 6.74E-07 | 2.66E-07 | 7.00E-07 | 2.76E-07 | 4.47E-05 | 1.20E-05 | 9.72E-09 | 2.6E-09 | 9.49E-09 | 2.54E-09 | 3.01E-04 |
| Cu | 1.97E-01 | 2.00E-01 | 9.62E-01 | 9.50E-08 | 3.57E-09 | 1.31E-06 | 4.95E-08 | 8.39E-07 | 6.59E-07 | 6.07E-11 | 4.77E-11 | 2.37E-09 | 1.86E-09 | 1.36E+00 |
| Fe | 9.14E-04 | 6.42E-04 | 1.00E-03 | 6.91E-08 | 5.25E-09 | 1.67E-05 | 1.27E-06 | 4.06E-06 | 4.54E-06 | 5.14E-09 | 5.75E-09 | 2.01E-07 | 2.25E-07 | 2.59E-03 |
| Hg | 3.77E-01 | 1.22E-03 | No Data | 1.02E-04 | 1.31E-05 | 1.06E-05 | 1.36E-06 | 5.99E-04 | 2.45E-03 | 4.65E-09 | 1.9E-08 | 1.27E-08 | 5.19E-08 | 3.82E-01 |
| Ni | 7.63E-03 | 9.37E-03 | 5.87E-03 | 2.59E-07 | 7.89E-07 | 1.79E-06 | 5.46E-06 | 5.66E-05 | 4.57E-05 | 5.12E-08 | 4.13E-08 | 8.00E-08 | 6.46E-08 | 2.30E-02 |
| Pb | 2.87E-02 | 4.10E-02 | 3.11E-02 | 4.22E-06 | 1.34E-07 | 5.12E-06 | 1.63E-07 | 1.34E-05 | 6.85E-07 | 8.46E-11 | 4.34E-12 | 3.30E-09 | 1.69E-10 | 1.01E-01 |
| Zn | 2.98E-04 | 1.51E-03 | 6.75E-04 | No Data | 1.98E-06 | No Data | 2.05E-05 | 3.06E-05 | 3.72E-05 | 1.66E-09 | 2.02E-09 | 6.49E-08 | 7.89E-08 | 2.57E-03 |
| ∑ HM | 7.33E-01 | 2.65E-03 | 1.01E+00 | 1.09E-04 | 2.73E-05 | 3.72E-05 | 3.30E-05 | 1.51E-03 | 4.44E-03 | 1.05E-07 | 1.13E-07 | 4.24E-07 | 6.20E-07 | 2.02E+00 |
Table 10: Hazard quotient (HQ) of heavy metal exposure matrix in adults.
No Data: Analytical data unavailable; Total HQ: total hazard quotient; ∑ HM: sum total of heavy metals. Table 9: Hazard quotient (HQ) of heavy metal exposure matrix in adults.
| Fish Exposure pathway | Surface water Exposure pathways | Sediment Exposure pathways | Total HQ | ||||||||||||
|---|---|---|---|---|---|---|---|---|---|---|---|---|---|---|---|
| Dietary Ingestion | Ingestion | Dermal | Ingestion | Dermal | Inhalation | ||||||||||
| C.garipinus | H. niloticus | A. labiate | Waterᵃ | Waterᵇ | Waterᵃ | Waterᵇ | Sediment ᵃ | Sediment ᵇ | Sediment ᵃ | Sediment ᵇ | Sediment ᵃ | Sediment ᵇ | |||
| Al | 1.51E-05 | 3.96E-06 | No Data | No Data | 4.59E-08 | No Data | 2.03E-05 | 4.09E-07 | 3.80E-06 | 4.92E-09 | 4.57E-08 | 2.06E-08 | 1.91E-07 | 4.39E-05 | |
| As | 2.46E-01 | 7.92E-03 | 5.28E-03 | 3.11E-06 | No Data | 1.38E-03 | No Data | 5.11E-06 | 5.11E-06 | 1.03E-07 | 1.03E-07 | 1.29E-10 | 1.29E-10 | 2.60E-01 | |
| Cd | 1.74E-02 | 1.58E-02 | 2.22E-02 | 1.23E-05 | 1.01E-04 | 5.45E-03 | 4.46E-02 | 0.001616 | 4.03E-03 | 9.72E-07 | 4.85E-05 | 4.07E-08 | 1.02E-07 | 1.11E-01 | |
| Cr (III) | 5.28E-07 | No Data | 5.28E-07 | 1.23E-08 | 4.85E-09 | 5.45E-06 | 2.15E-06 | 1.91E-07 | 5.11E-08 | 2.99E-11 | 6.15E-10 | 1.44E-08 | 3.87E-09 | 8.93E-06 | |
| Cr (VI) | 2.64E-04 | No Data | 2.64E-04 | 6.16E-06 | 2.43E-06 | 2.72E-03 | 1.07E-03 | 9.55E-05 | 2.56E-05 | 2.87E-08 | 3.08E-07 | 1.44E-08 | 3.87E-09 | 4.45E-03 | |
| Cu | 4.28E-01 | 4.35E-01 | 2.09E+00 | 8.68E-07 | 3.27E-08 | 3.84E-04 | 1.44E-05 | 1.79E-06 | 1.41E-06 | 2.15E-08 | 1.69E-08 | 3.61E-09 | 2.84E-09 | 2.96E+00 | |
| Fe | 1.99E-03 | 1.40E-03 | 2.18E-03 | 6.31E-07 | 4.80E-08 | 2.79E-04 | 2.12E-05 | 8.66E-06 | 9.69E-06 | 1.04E-07 | 1.17E-07 | 3.06E-07 | 3.42E-07 | 5.89E-03 | |
| Hg | 8.21E-01 | 2.64E-03 | No Data | 9.34E-04 | 1.19E-04 | 4.13E-01 | 5.28E-02 | 0.001279 | 5.23E-03 | 1.08E-06 | 6.29E-05 | 1.93E-08 | 7.90E-08 | 1.30E+00 | |
| Ni | 1.66E-02 | 2.04E-02 | 1.28E-02 | 2.37E-06 | 7.21E-06 | 1.05E-03 | 3.19E-03 | 1.21E-04 | 9.74E-05 | 5.81E-08 | 1.17E-06 | 1.22E-07 | 9.82E-08 | 5.42E-02 | |
| Pb | 6.25E-02 | 8.92E-02 | 6.77E-02 | 3.86E-05 | 1.23E-06 | 1.71E-02 | 5.42E-04 | 2.85E-05 | 1.46E-06 | 3.43E-07 | 1.76E-08 | 5.03E-09 | 2.58E-10 | 2.37E-01 | |
| Zn | 6.47E-04 | 3.28E-03 | 1.47E-03 | No Data | 1.81E-05 | No Data | 7.98E-04 | 6.53E-05 | 7.94E-05 | 7.85E-08 | 9.55E-08 | 9.87E-08 | 1.20E-07 | 6.36E-03 | |
| ∑ HM | 1.59E+00 | 5.76E-01 | 2.20E+00 | 9.98E-04 | 2.49E-04 | 4.41E-01 | 1.03E-01 | 3.22E-03 | 9.48E-03 | 2.79E-06 | 1.13E-04 | 6.44E-07 | 9.43E-07 | 4.93E+00 |
Table 11: Hazard quotient (HQ) of heavy metal exposure matrix in children.
No data – Analytical data unavailable; Total HQ: total hazard quotient; ∑ HM: sum total of heavy metals. Table 10: Hazard quotient (HQ) of heavy metal exposure matrix in children.
Discussion
Heavy metals in diverse concentration are released from a host of natural and anthropogenic source that pose negative environmental and health-based risk over a period of time [52, 53]. According to Vu, et al. [54], anthropogenic activities lead to the release of heavy metals that a readily mobile in surface water, which thereafter suspend and deposit them on sediment fine grains. As these anthropogenic metals reach high threshold, aquatic organism is impacted negatively via bioactivity and mobile bio-accessibility from contaminated sediment finegrains and water body [55, 56]. In this study, heavy metal concentration varied over fish, surface water and sediment samples, thus implies that biochemical transformation and geochemical interaction has great impact to floras and faunas in relation to humans [57, 58, 59].
According to WHO [60], arsenic (As) is found in diet, mostly in fish and shells, which exist as less toxic organic form in comparison to inorganic form, as such limited data has suggested that natural and anthropogenic source could impact on the concentration depending on the location. Arsenic in high concentration is known to cause short- and long-term health risks such as tissue and organ cancer, dermal lesion and vascular diseases, although arsenic exposure in humans are excreted via urine or sweat as organic acids in minute concentration [60, 61, 62, 63]. Aluminum (Al) and iron (Fe) are known to exist in water and sediment as combined component of carbonates, sulphates, chlorides, oxides that are easily absorbed in tissues and bones of aquatic organisms and humans also. Similarly, they both impact water quality such as color, turbidity, hardness, conductivity and dissolved oxygen [64, 65]. There is little indication that aluminum and iron have health implication, but hypothetically, it has been said that extreme aluminum exposure leads to Alzheimer diseases in humans [66]. Iron (Fe) is an essential element in human nutrition, which estimated daily requirement depends on age, sex, physiological status and iron bioavailability [60].
Cadmium (Cd) and zinc (Zn) in high concentration is an indication of pollution from each other, as they are released into the environment from several industrial activities such as steel, plastics, fertilizer that get absorbed and/or assimilated by aquatic organism and agricultural plants. Zinc impacts taste at minimum concentration of 4mg/l (as sulphate, carbonate and chloride). In humans, cadmium and zinc accumulate in kidney after exposure leading to cytotoxicity induced tumors in urinary tract and development of hyperplasia and subsequently neoplasia [67, 68, 69].
Cadmium (III) and (VI) are known valence group of chromium that are prevalent different in biochemical interaction in human body [70]. Chromium (III) is a vital source of nutrient that exist in food source, although chromium (VI) is known to be carcinogenic via different exposure route (inhalation, oral and dermal). A national toxicology program (NTP) study shows that chromium (VI) is reduced to chromium (III) in human stomach and gastrointestinal tract in a dose-response interaction at very low concentration, but at high concentration can lead to tumor and cancer in organs and tissues in humans [71].
Copper (Cu) and lead (Pb) are released into the environment from natural and anthropogenic sources, as its solubility is initiated by pH dominant anions (sulphate, nitrate, phosphate, chloride, carbonate) that impacts water quality (temperature, taste, color, dissolved oxygen) over a period of time [72, 73]. Short-term exposure of copper leads to gastrointestinal irritation (diarrhea), which is concentration dependent, as long-term effect can lead to metabolic homeostasis and trigger Wilson disease in gene carriers [60].
Exposure to lead has been known to cause neurodevelopmental issues, cardiovascular diseases, impaired renal function and fertility, hypertension, as lead in blood is known to cause blood cell-tumor and systolic blood pressure [38, 65, 74]. In children, lead decreases intelligence quotient (IQ) point by at least two (2) point and increase systolic blood pressure by about 3 mmHg [75].
Mercury exist as organic and inorganic forms in aquatic environment as inorganic mercury exposure in human causes genotoxic health activities (tissue and organ tumor) as oral exposure above recommended guideline of 0.0006mg/l result in hemorrhagic gastritis in stomach and intestinal tissue and kidney damage [63, 76, 77, 78, 79].
Nickel exist predominantly in food source as water and sediment exposure is a minor contributor to adult and children over a period of time. Although presence of steel industries can lead to increase nickel pollution from industrial effluents, which impacts the aquatic and land environment. High concentration of nickel causes dermal allergies (dermatitis) [80].
The correlative review as shown in Table 5 and 6 shows that diverse activities such as industrial effluents and emission, agricultural land use, sanitary landfill, mining activities, fishing and water-land transport has negative influence on surface water and sediment, which in turn leads to exposure to floras and faunas over a period of time [30, 31]. As the aforementioned activities takes place, it leads to the release of chemical toxins in high concentration that has the potential to cause immerse health risk to a population, which leads to carcinogenesis, mutagenesis and non-carcinogenesis (adverse health effect) [51]. The calculated total cancer risk (Table 7 and 8) suggest that children will have cancer-based symptoms as compared to adults from fish dietary exposure, surface water (ingestion and dermal) exposure and sediment (ingestion, dermal and inhalation) exposure [51, 81].
The calculated total hazard quotient Tables 9 & 10 suggest that both adult and children are at risk of having adverse health issues from all exposure pathways for fish most especially, as such special care is advocated [31, 32].
Conclusion
The study evaluated significant concentration of heavy metals in three fish species, surface water and sediment samples from Ogbaru axis of River Niger. However, the concentration was low or moderate within set WHO standard, as correlation showed positive and negative regression indicating that they were from similar source and vice-versa thus lead to bioaccumulation and increased toxicity in fish samples. Cancer risk and hazard quotient showed that fish dietary exposure is a major contributor compared to surface water and sediment exposure for both adults and children respectively. Children are more prone to have adverse health effect from consumption of fish samples exposed to low or moderate heavy metal concentration in comparison to adults. Based on these results, one can draw that fish samples were immensely impacted by anthropogenic activities that are released into the River Niger that span over a wide distance. Therefore, the following recommendations are advocated: a) Further evaluation of pollutants in microscale and nanoscale is advocated to derive required information on the exposure medium of environmental matrices to human. b) Regulatory action and proactive attention should be enforced on environmental polluters involved in diverse activities. c) Regular public health check on the level of heavy metals among the populace in the communities that border the study area should be employed in order to safeguard health and wellbeing.
References
-
Ashraf MA, Maah MJ, Yusoff I (2012) Bioaccumulation of heavy metals in fish species collected from former tin mining catchment. Int J Environ Res 6(1): 209-218.
-
Babatunde OA, Ogundajo LA (2010) Determination of heavy metals in fish tissues, water and sediment from Epe and Badagry Lagoons, Lagos, Nigeria. J Chem 7(1): 215-221.
-
Ali HM, Abdel Satar MA (2005) Metals in water, sediment, fish and fish diet in some fish farms in El-Fayoum Province, Egypt. Egy J Aqua Res 31(2): 261-273.
-
Omokpariola JO, Omokpariola DO, Omokpariola ECO (2021) Risk Assessment of Polycyclic Aromatic Hydrocarbons and Total Petroleum Hydrocarbons in Oilfield Produced Water and Sea Water at Gulf of Guinea Oilfield, Nigeria. Adv J Chem Sect B 3(1): 68-85.
-
Ismaniza I, Saleh IM (2012) Analysis of Heavy Metals in Water and Fish (Tilapia Sp.) Samples from Tasik Mutiara, Puchong. Mal J Anal Sci 16(3): 346-352
-
Eneji IS, Sha’Ato R, Annune PA (2011) Bioaccumulation of Heavy Metals in Fish (Tilapia Zilli and Clarias Gariepinus) Organs from River Benue, North Central, Nigeria. Pak J Anal Environ Chem 12(1-2): 25-31.
-
Dopp E, Hartmann LM, Florea AM, Rettenmier AW, Hirner AV (2004) Environmental distribution, analysis, and toxicity of organometalloid compounds. Crit Review Toxicol 34: 301-333.
-
World Health Organization (2011) Guidelines for drinking water quality. Recommendation, 4th (Edn.), World Health Organization, New Delhi, AUBS Publishers.
-
United States Environmental Protection Agency (2007) Framework for metals risk assessment. Washington DC, USA.
-
Baldisserotto B, Chowdhury MJ, Wood CM (2004) Effects of Dietary Calcium and Cadmium on Cadmium Accumulation, Calcium and Cadmium Uptake from the Water and Their Interactions in Juvenile Rainbow Trout. Aquatic Toxicol 72(1): 99-117.
-
Ayandiran TA, Fawole OO, Adewoye SO, Ogundiran MA (2009) Bioconcentration of metals in the body muscle and gut of _Clarias gariepinus_ exposed to sublethal concentrations of soap and detergent effluent. J Cell Animal Biol 3(8): 113-118.
-
Woo S, Yum S, Park HS, Lee TK, Ryu JC (2009) Effects of heavy metals on antioxidants and stress-responsive gene expression in Javanese medaka (_Oryzias javanicus_). Compar Biochem Physiol Part C Toxicol Pharmacol 149(3): 289-299.
-
Omokpariola DO, Nduka JK, Omokpariola PL, Omokpariola ECO (2020) Ionic composition of rainwater from different sampling surfaces across selected locations in Rivers, Nigeria. World Sci News 150: 132- 147.
-
Liu JJ, Ni ZX, Diao ZH, Hu YX, Xu XR (2018) Contamination level, chemical fraction and ecological risk of heavy metals in sediments from Daya Bay, South China Sea. Mar Pol Bull 128: 132-139.
-
Bawuro AA, Voegborlo RB, Adimado AA (2018) Bioaccumulation of Heavy Metals in Some Tissues of Fish in Lake Geriyo, Adamawa State, Nigeria. J Environ Pub Health 1: 1-7.
-
Koki IB, Bayero AS, Umar A, Yusuf S (2015) Health risk assessment of heavy metals in water, air, soil and fish. Afr J Pure Appl Chem 9(11): 204-210.
-
Ikem A, Egiebor NO Nyavor K (2003) Trace elements in water fish and sediment from Tuskegee Lake, Southeastern USA. Water Air Soil Pol 149: 51-75.
-
Zhang W, Wang WX, Zhang L (2016) Comparison of bioavailability and biotransformation of inorganic and organic arsenic to two marine fish. Environ Sci Technol 50(5): 2413-2423.
-
Tran TAM, Leermakers M, Hoang TL, Nguyen VH, Elskens M (2018) Metals and arsenic in sediment and fish from Cau Hai lagoon in Vietnam: Ecological and human health risks. Chemosphere 210: 175-182.
-
Javed M, Usmani N (2016) Accumulation of heavy metals and human health risk assessment via the consumption of freshwater fish (_Mastacembelus armatus_) inhabiting, thermal power plant effluent loaded canal. Springerplus 5(1): 776.
-
Dhanakumar S, Solaraj G, Mohanraj R (2015) Heavy metal partitioning in sediments and bioaccumulation in commercial fish species of three major reservoirs of river Cauvery delta region, India. Ecotoxicol Environ Safety 113: 145-151.
-
Zwarts L, van Beukering P, Bakarykone B, Wymenga E (2005) The Niger: A lifeline. Effective water management of the Upper Niger Basin. Springer publisher pp: 6-9.
-
Welcomme RL, Dumont H (1986) The Niger River system Ins: Davies B, Walker K (Eds.), The Ecology of River Systems Springer, Netherlands 60: 9-59.
-
Onwuzuligbo CU, Nnam VC, Alozie PO, Ejezie EV (2017) Implementation of Social Tenure Domain Model in Okpoko, Anambra State, Nigeria. FIG Working Week, Helsinki, Finland pp: 1-13.
-
Braid RN, Eaton AD, Rice EW, Bridgewater L (2017) Standard methods for the examination of water and wastewater 23rd (Edn.), Washington, DC. United States: Water Environment Federation. American. Water Works Association.
-
Izuchukwu UI, Okeke DO, Okpashi VE (2017) Determination of Heavy Metals in Fish Tissues, Water and Sediment from the Onitsha Segment of the River Niger Anambra State Nigeria. J Environ Anal Toxicol 7: 507-513.
-
Thepanodh S, Ayer GP, Hooper MA (2005) Analysis of precipitation chemistry in northern Thailand. Clean Air Environ Quantity 39(4): 43-47.
-
United States Environmental Protection Agency (2004) Risk assessment guidance for superfund, volume I: human health evaluation manual (Part E, supplemental guidance for dermal risk assessment). Washington, DC, USA: United States Environmental Protection Agency.
-
United States Environmental Protection Agency (2007) Framework for metals risk assessment. Washington, DC 20460, USA: United States Environmental Protection Agency. EPA 120/R-07/001.
-
Southern Environmental Law Center (2018) Human Health and Ecological Risk Assessment of Chesterfield Power Station Ash Ponds, Richmond, Virginia, US.
-
Verbruggen EMJ (2012) Environmental risk limits for polycyclic aromatic hydrocarbons (PAHs) for direct aquatic, benthic and terrestrial toxicity. RIVM Report 607711007/2012. National Institute for Public Health and the Environment Ministry of Health, Welfare and Sport.
-
United States Environmental Protection Agency (2011) Exposure Factors Handbook 2011 Edition. National Center for Environmental Assessment, Office of Research and Development, Washington DC.
-
United States Environmental Protection Agency (1989) Risk assessment guidance for Superfund. Volume I: Human health evaluation manual (Part A Interim Final: EPA/540/1-89/002. (Office of Emergency and Remedial Response), Washington DC.
-
Lenhardt M, Jaric I, Visnjic Jevtic Z, Skoric S, Gacic Z, et al. (2012) Concentrations of 17 elements in muscle, gills, liver and gonads of five economically important fish species from the Danube River. Knowl Manag Aqua Ecosys 407: 1-10.
-
Zrncic S, Oraic D, Caleta M, Mihaljevic Z, Zanella D, et al. (2013) Biomonitoring of heavy metals in fish from the Danube River. Environ Mon Ass 185(2): 1189-1198.
-
Ikema A, Egieborb N (2005) Assessment of trace elements in canned fishes (mackerel, tuna, salmon, sardines and herrings) marketed in Georgia and Alabama, United States of America. J Food Comp Anal 18(8): 771-787.
-
European Commission Council Directive (1998) The quality of water intended for human consumption.
-
Food Agricultural Organization/World Health Organization (2011) Evaluation of certain food additives and contaminants. Seventy-third report of the Joint FAO/ WHO Expert Committee on Food Additives. Geneva, World Health Organization (WHO Technical Report Series, No. 960).
-
Shinn C, Dauba F, Grenouillet G, Lek S (2009) Temporal variation of heavy metal contamination in fish of the river lot in southern France. Ecotoxicol Environ Safety 72(7): 1957-1965.
-
Obasohan EE, Eguavoen IO (2008) Seasonal variations of bioaccumulation of heavy metals in a freshwater fish (Erpetoichthys calabaricus) from Ogba River, Benin City, Nigeria. Afr J Gen Agricul 4(3): 153-156.
-
Nnaji JC, Uzairu A, Harrison MF, Balarabe M (2007) Heavy metals in muscles of Oreochromis niloticus and Bagrus bayad of River Galma, Zaria, Nigeria. Biol Environ Sci J Trop 4: 181-189.
-
Sivapermal P, Sankar JV, Nair-Viswanathan PG (2007) Heavy Metal Concentrations in Fish, Shellfish and Fish Products from Internal Markets of India visa-vis International Standards. Food Chem 102(3): 612-620.
-
Onwukeme VI, Okechukwu VU (2021) Leaching matrix of selected heavy metals from soil to ground water sources in active dumpsites: A case study of Southern Nigeria. IOSR J Environ Sci Toxicol Food Technol 15(4II): 1-18.
-
Olagunju TE, Olagunju AO, Akawu IH, Ugokwe CU (2020) Quantification and Risk Assessment of Heavy Metals in Groundwater and Soil of Residential Areas around Awotan Landfill, Ibadan, Southwest-Nigeria. J Toxicol Risk Ass 6(1): 1-12.
-
Ezeonyejiaku CD Nwuba LA, Obiakor MO, Okonkwo CN (2014) Bioaccumulation of Heavy Metals in Fish Sourced from Environmentally Stressed Axis of River Niger: Threat to Ecosystem and Public Health. Int J Environ Prot Poli 2(4): 126-131.
-
Mohammadi M, Askary SA, Khodadadi M (2012) Accumulation Variations of selected heavy metals in _Barbus xanthopterus_ in Karoon and Dez Rivers of Khuzestan, Iran. Ir J Fish Sci 11(2): 372-382.
-
El-Metwally MEA, Darwish DH, Dar MA (2021) Spatial distribution and contamination assessment of heavy metals in surface sediments of Lake Burullus, Egypt. Arab J Geosci 14: 19-26.
-
Ukah BU, Egbueri JC, Unigwe CO, Ubido OE (2019) Extent of heavy metals pollution and health risk assessment of groundwater in a densely populated industrial area, Lagos, Nigeria. Int J Energy Water Res 4: 234-241.
-
Ustaoglu F (2020) Ecotoxicological risk assessment and source identification of heavy metals in the surface sediments of Çömlekci stream, Giresun, Turkey. Environ Foren 22 (1-2): 130-142.
-
Zhang G, Bai J, Xiao R, Zhao Q, Jia J, et al. (2017) Heavy metal fractions and ecological risk assessment in sediments from urban, rural and reclamation-affected rivers of the Pearl River Estuary, China. Chemosphere 184: 278-288.
-
USEPA, United States Environmental Protection Agency (2020) Regional Screening levels (RSLs) Table. Updated May 1, 2020. Washington D.C.: USEPA.
-
Alinnor J, Obiji I (2010) Assessment of Trace Metal Composition in Fish Samples from Nworie River. Pak J Nut 9(1): 81-85.
-
Anshumali A, Ramanatha AL, Singh G, Ranjan R, Tripathi P (2009) Chemodynamics of trace metal fractions in surface sediments of the Pandoh Lake, Lesser Himalaya, India. Environ Geochem 57(8): 1865-1879.
-
Vu CT, Lin C, Shern CC, Yeh G, Le VG, et al. (2017) Contamination, ecological risk and source apportionment of heavy metals in sediments and water of a contaminated river in Taiwan. J Ecol Ind 82: 32-42.
-
Farombi EO, Adelowo DA, Ajimoke YR (2007) Biomarker of oxidative stress and heavy metal levels as indicators of environmental pollution in African catfish (_Clarias_ _gariepinus_) from Ogun, Nigeria. Int J Env Res Pub Heal 4(2): 58-163.
-
Kumari P, Maiti SK (2019) Bioaccessibilities and health risk assessment of heavy and trace elements in fish from an urban city, India. Human Ecol Risk Ass: An Int J 27(1): 50-70.
-
Harikumar PS, Nasir UP (2010) Ecotoxicological impact assessment of trace elements in core sediments of a tropical estuary. Ecotoxicol Environ Safety 73(7): 1742- 1747.
-
Christopher E, Vincent O, Grace I, Rebecca E, Joseph E (2009) Distribution of Heavy Metals in Bones, Gills, Livers and Muscles of (Tilapia) _Oreochromis niloticus_ from Henshaw Town Beach Market in Calabar, Nigeria. Pak J Nut 8(8): 1209-1211.
-
Chapman PM (2000) The sediment quality triad: then, now and tomorrow. Int J Environ Pol 13: 351-360.
-
WHO, World Health Organization (2017) Guidelines for drinking-water quality: fourth edition incorporating the first addendum. Geneva: WHO. ISBN 978-92-4-154995- 0. License: CC BY-NC-SA 3.0 IGO.
-
WHO, World Health Organization (2011) Arsenic in drinking-water. Background document for preparation of WHO Guidelines for drinking-water quality. Geneva:
-
USNRC, United States National Research Council (2001) Arsenic in drinking water, 2001 update. Washington, DC, USNRC, National Academy Press.
-
IPCS, International Programme on Chemical Safety (2003) Elemental mercury and inorganic mercury compounds: Human health aspects. Geneva, World Health Organization. Concise International Chemical.
-
WHO, World Health Organization (2010) Aluminum in drinking-water. Background document for preparation of WHO Guidelines for drinking-water quality. Geneva: WHO (WHO/SDE/ WSH/03.04/53).
-
FAO/WHO, Food Agricultural Organization/World Health Organization (2007) Aluminum (from all sources, including food additives). In: Evaluation of certain food additives and contaminants. Sixty-seventh report of the Joint FAO/WHO Expert Committee on Food Additives. Geneva: WHO. 33–44 (WHO Technical Report Series, No. 940).
-
WHO, World Health Organization (1997) Guidelines for drinking-water quality, 2nd (edn.) vol. 3 In: Surveillance and control of community supplies. Geneva: WHO.
-
WHO, World Health Organization (2011) Cadmium in drinking-water. Background document for preparation of WHO Guidelines for drinking-water quality. Geneva: WHO.
-
WHO, World Health Organization (2003) Zinc in drinking-water. Background document for preparation of WHO Guidelines for drinking-water quality. Geneva: WHO.
-
ATSDR, Agency for Toxic Substances and Disease Registry (1994) Toxicological profile for zinc. U.S. Department of Health and Human Service, Public Health Service, United States.
-
ATSDR, Agency for Toxic Substances and Disease Registry (2000) Toxicological Profile for Chromium. Atlanta, GA: ATSDR, U.S. Department of Health and Human Service, Public Health Service. 1600 Clifton Road N.E, E-29 Atlanta, Georgia, United States.
-
WHO, World Health Organization (2003) Chromium in drinking-water. Background document for preparation of WHO Guidelines for drinking-water quality. Geneva: WHO.
-
WHO, World Health Organization (2004) Copper in drinking-water. Background document for preparation of WHO Guidelines for drinking-water quality. Geneva: WHO.
-
Cogun HY, Kargin F (2004) Effects of pH on the Mortality and Accumulation of Copper in Tissues of _Oreochromis_ _niloticus_. Chemosphere. 55(2): 277-282.
-
FAO/WHO, Food Agricultural Organization/World Health Organization (2011) Safety evaluation of certain contaminants in food. Prepared by the seventy-second meeting of the Joint FAO/WHO Expert Committee on Food Additives. Geneva: WHO. 685-762.
-
WHO, World Health Organization (2016) Lead in drinking-water. Background document for development of WHO Guidelines for drinking-water quality. Geneva: WHO (WHO/FWC/WSH/16.53).
-
Voegborlo RB, Atta A, Agorku ES (2012) Total mercury distribution in different tissues of six species of freshwater fish from the Kpong hydroelectric reservoir in Ghana. Environ Model Ass 184(5): 3259-3265.
-
Holmes P, Hames KAF, Levy LS (2009) Is low-level mercury exposure of concern to human health? Sci Total Env 408(2): 171-182.
-
Guzzi G, LaPorta CAM (2008) Molecular mechanisms triggered by mercury. Toxicol 244(1): 1-12.
-
WHO, World Health Organization (2005) Mercury in drinking-water. Background document for development of WHO Guidelines for drinking-water quality. Geneva: WHO (WHO/SDE/ WSH/05.08/10).
-
WHO, World Health Organization (2007) Nickel in drinking-water. Background document for development of WHO Guidelines for drinking-water quality. Geneva: WHO (WHO/SDE/WSH/07.08/55).
-
Omokpariola DO, Omokpariola PL (2021) Health and exposure risk assessment of heavy metals in rainwater samples from selected locations in Rivers State, Nigeria. Phy Sci Rev pp: 1-14.
- Spectrophotometric Determination of Lanthanum (III) and Some Rare Earths with Xylenol Orange
- Introduction and Sources of Molluscicides
- Trimetazidine: An Antianginal Drug and Not Only!
- Nature Inspired Discovery and Development of Antibacterials: An Update
- Fungal Biodegradation of Polycyclic Aromatic Hydrocarbons (PAHs)
- Recent Approaches of Impurity Profiling in Pharmaceutical Analysis: A Concise Review