Raman (Rs) Spectroscopy for Biopharmaceutical Quality Control and PAT. Raw Material - Final Products: the Nanolipids Effect on Signal Intensity. Regulatory and Toxicological Aspects
Relvant for this role the analytical procedure, specificity and sensibility of the methods to test raw materials but also the final products before commercialization. Aim of this work is to verify the role played by nanolipids on Raman (RS) Spettroscopy encapsulating active principle or other substantia unsing different procedure: • Destructive • Non destructive technique. This is relevant because regualtory agency authorized (EMA) for cGMP rules the use also of non destructive methods like RAMAN (RS) spettroscopy in various stage of manifacturing drugs (for raw material and final product).
Introduction
In last decades RAMAN (RS) spectroscopy was deeply introduced in various settings and also in pharmaceutical Drugs production because innovative, non invasive and easy to use technology (Figure 1).
This work start with the interesting facts that some single researcher finded GRAPHENE deivates in some Vials of m RNA covid-19 vaccine but this whas not confirmed by regulatory agency that written. In as official document (EMA): Last updated: 27 January 2022. Parliamentary question - P-000303/2022(ASW) European Parliament Answer given by Ms Kyriakides on behalf of the European Commission 8.3.2022 Written question In the EU a marketing authorisation is granted to a medicinal- product only after its quality, safety and efficacy have been evaluated and a positive benefit-risk balance related to its use has been concluded. For EU authorisations of COVID-19 (sars cov-2) vaccines this assessment is carried out by the EMA.
EMA has analysed reports describing the analysis of several vials of COVID-19 (sars cov-2) vaccines suggesting the presence of graphene and they concluded that the currently available data do not show presence of graphene in the vaccines concerned. The analysis by EMA’s working party for biological- medicines included an input on the Raman (RS)- spectroscopy from the European Directorate for Quality of Medicines and the independent national testing labs. responsible for the batch release (OMCLs).
Graphene oxide GO is not used in the manufacture or formulation of any of the COVID-19 (sars-cov-2) vaccines or other medicines, so it would not be present at manufacturing -facilities and there is no obvious way that it could get into the vaccines. Quality control testing CQ and quality assurance review, by the vaccine manufacturers and OMCLs responsible for batch/lots release, confirm that each batch met all quality standards prior to the release. No product complaints have been received for the batches mentioned in the paper. The presence of graphene or graphene derivatives in the vaccines therefore are not plausible. The Commission and EMA do not consider that any further- actions are necessary at this stage. But if we read the work of one of this researcher: Campra P [1].
Analytical Methodology
Fundamentals of the micro-Raman (RS) technique Due to the characteristics of the sample and to the dispersion of objects with a graphene appearance of micro-metric size in a complex matrix of an indeterminate composition, the direct application of spectro-scopic methods does not allow characterization of the nano-particles studied here without a previous microscopic- localization or fractionation from the original sample.
Therefore, microscopy coupled to RAMAN (RS) spectroscopy (micro-RAMAN (RS)) was selected as an effective technique for an exhaustive screening of micro metric objects visible under the optical micro-scope (1).
So it is possible to verify that in example Young RO reported a pretreatment of the sample before test with Other Technique: Young RO, et al. [2]. Steps of Analysis of Vaccine Aqueous Fractions Refrigerated samples were processed under sterile conditions, using laminar -flow chamber and sterilized lab ware.
Steps for analyses were:
- Dilution in 0.9% sterile physiological saline (0.45ml + 1.2ml)
- Polarity fractionation: 1.2ml hexane + 120ul of RD1 sample
- Extraction of hydrophilic- aqueous pHase
- UV- absorbance and fluorescence spectroscopy scanning” (2) It can be considered a destructive method.
And according the Eurpean pharmacopeia EP : Among the methods established for quality control of classical medicines the so called “non-invasive”, non-destructive, techniques, such as near-infrared and Raman (RS)- spectroscopy have been applied for molecular imaging and analytics in process -analytical technology (PAT) and are implemented in quality by design (QbD) concepts.
But what is Raman (RS) Spectroscopy?
Raman (RS) spectroscopy is an chemico - analytical technique where scattered light is used to measure the vibrational - energy modes of a sample. It is named after the Indian physicist researcher C. V. Raman (RS) who, together with his research partner Krishnan KS, was the first to observe Raman (RS) scattering in the year 1928.
Raman (RS) spectroscopy can provide both chemical- structural information, as well as the identification of substances through their characteristic Raman (RS) ‘finger- print’. Raman (RS) spectroscopy extracts this information through the detection of Raman (RS) scattering from the sample.
This method is based on the phenomena of diffusion of an electro-magnetic mono- cromatic radiation laser. By the sample tested it is obvious and clear that it is relevant to separate the sample from its chemical contest in order to avoid other shade or interference form other molecule inside the same sample. This last molecule make possible not to obtain reviability results. For this kind of reason often it is used to extract the analite to be detected with solvent – or diluent before test.
And what is the Raman (RS) Scattering?
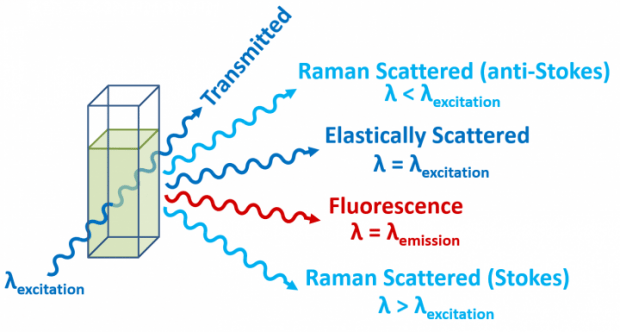
When light is scattered by molecule, the oscillating electro magnetic -field of a photon induces a polarisation of the molecular -electron cloud which leaves the molecule in a higher energy- state with the energy of the photon -transferred to the molecule.
This can be considered as the formation of a very short- lived complex between the photon and molecule which is commonly called the virtual -state of the molecule. The virtual- state is not stable and the photon is re-emitted almost immediately, as scattered light.
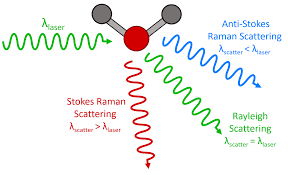
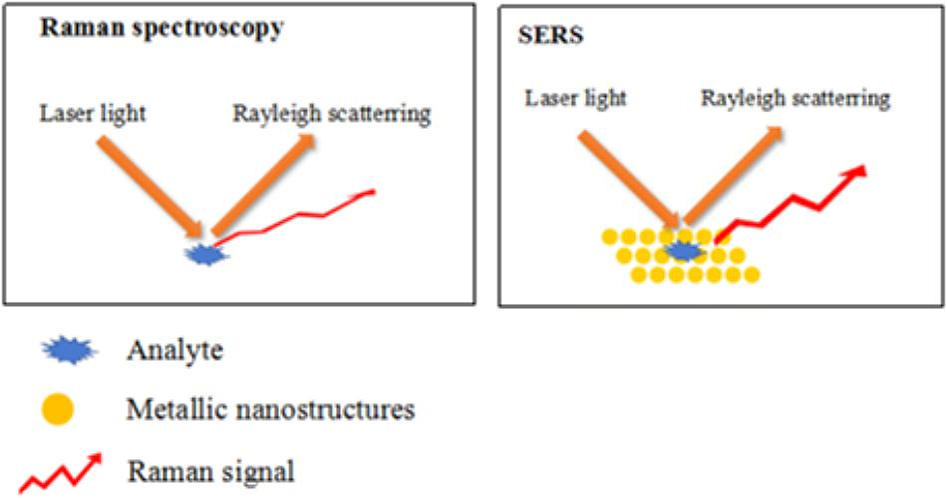
In the vast majority of scattering- events, the energy of the molecule is un-changed after its interaction with the photon; and the energy, the wavelength, of the scattered photon is equal to that of the incident photon. This is called elastic (energy of scattering particle is conserved) or Rayleigh scattering and is the dominant process.
In a much rarer event (1 in 10 million photons) Raman (RS) scattering occurs, which is an inelastic scattering process with a transfer of energy between the molecule and the scattered photon.
If the molecule gains energy from the photon during the scattering (excited to a higher vibrational- level) then scattered- photon loses energy and its wave-length increases which is called Stokes -Raman (RS) scattering. In inverse way, if the molecule loses energy by relaxing to a lower vibrational level the scattered photon gains the corresponding energy and its wave length decreases; which is called Anti-Stokes Raman (RS)- scattering. Quantum mechanically Stokes and Anti-Stokes are equally likely processes. With an ensemble of molecules, the majority of molecules will be in the ground vibrational level (as Boltzmann distribution) and Stokes scatter is the statistically more probable process. As a result, the Stokes- Raman (RS) scatter is always more intense than the anti-Stokes and for this reason, it is nearly always the Stokes Raman (RS) scatter that is measured in the Raman- (RS)- spectroscopy.
Raman (RS) Shift
It is clear from the Figure 2, that the wavelength of the Raman (RS) scattered light will depend on the wavelength of the excitation -light. This makes the Raman- (RS) scatter wavelength an impractical number for comparison between the spectra measured using different lasers. The Raman (RS)- scatter position is therefore converted to a Raman (RS) shift away from excitation wave -length:
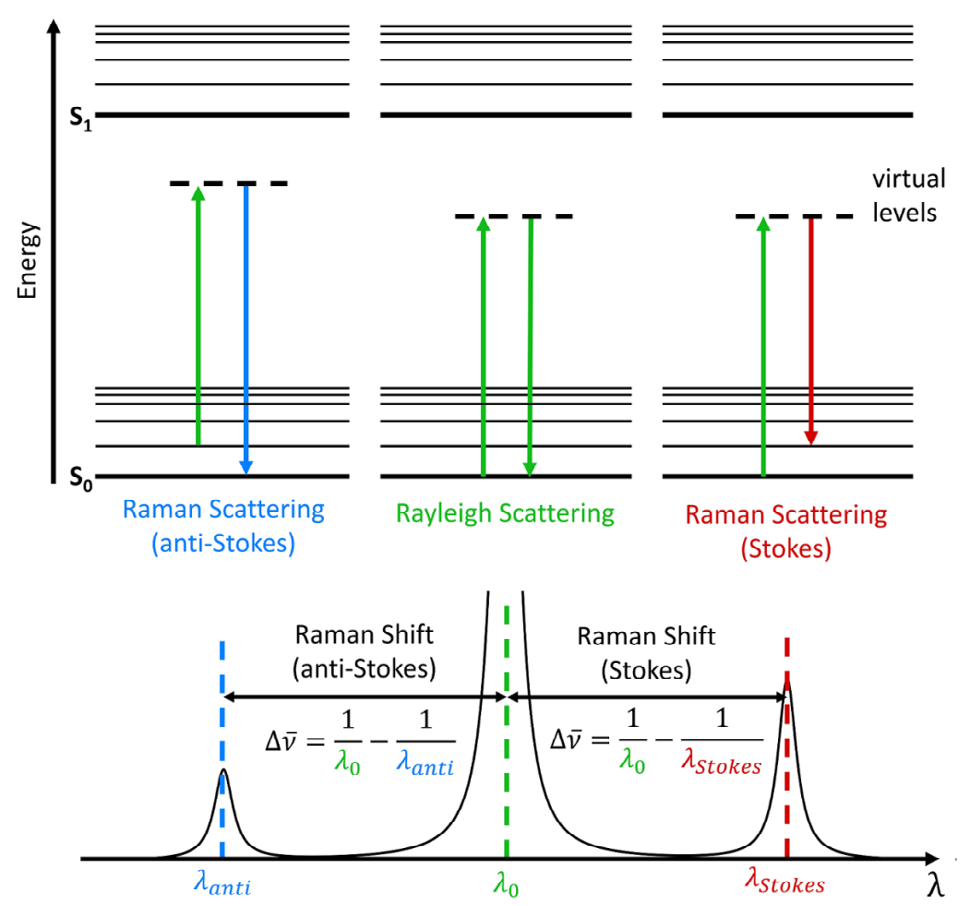
Raman (RS) shift Equation
The first term is the wave number Raman- (RS) shift in cm-1, λ(0) is the wave length of excitation -laser in nm, and λ(1) is the wave length of the Raman (RS) scatter in nm.
Vibrational Modes
Figure 3 reported shows that Raman (RS)- spectroscopy measures the energy gap between the vibrational levels of the molecule. The ladder of vibrational- levels shown in Figure 4 reported is for a single vibrational mode of the molecule. Poly-atomic molecules will contain many vibrational modes, each with their own ladder of vibrational- levels.
From European Pharmacopea : 32.3 July 2020 Applications
“Raman (RS) spectroscopy is commonly used for qualitative and quantitative applications and can be applied to solid, liquid and gaseous samples. Raman (RS) spectroscopy is a rapid and non-invasive analytical method and can be performed off-line, at-line, on-line or in-line, e.g. for process analytical technology (PAT)- Process analytical technology. Raman (RS) spectrometers can be situated far from the point of measurement using long-distance optical fibres to collect the Raman (RS) signal. Raman (RS) spectroscopy has a wide variety of applications, for example:
- identification of materials, active substances or excipients;
- determination of solid-state properties, polymorphism and solvated state;
- quality control, assay, uniformity of dosage units;
- process analysis, monitoring of biological and chemical reactions, synthesis, crystallisation, granulation, mixing, drying, lyophilisation, extrusion, encapsulation and coating;
- detection of falsified products;
- mapping, imaging and depth profiling of pharmaceutical forms, distribution of chemical
- compounds, detection of un-known substances.
Equipment
2 types of Raman (RS) spectrometers can be distinguished depending on the detection principle, dispersive and Fourier transform (FT) instruments. These may be benchtop instruments (including microscope-coupled devices, portable -instruments) or hand-held instruments.
Response-Intensity Scale
The absolute and relative intensities of Raman (RS) signals are affected by variations of several factors including:
- polarisation of the irradiating -light
- polarisation of the Raman (RS) scattered -light
- intensity of the irradiating- light
- instrument response
- focus and geometry at sample
- packing density of particles in solid samples
- refractive index n or change of n (Δn) between analyte and the environment
- the particle- size and particle-size distribution
- the scattering cross-section
- the absorption cross-section The verification of the response-intensity scale is principally performed for quantitative- methods.
Procedure
Preparation of the Sample: Raman (RS) spectra can be obtained from solids, liquids or gases directly, in suitable glass or plastic containers or through films (provided that un-wanted signal contributions are under control), generally with-out prior the sample preparation or dilution. Qualitative Methods Since frequency shift positions are employed for identification, identical laser intensity for both the reference standard and the material to be examined may not be necessary. The material to be examined is measured in the same physical -state (liquid, solid) as the reference or library material. Raman (RS) techniques offer the advantage of non- invasive measurements of the material to be examined with- out removal from the packaging. Some packaging materials may lead to additional signals in the Raman (RS)- spectrum. This is especially the case when the packaging material absorbs at the laser’s excitation wave-length.
Quantitative Methods
Quantitative determination requires that the reference - standard RS and the material to be examined must be measured at the same laser -intensity and frequency. Ensure that the material to be examined is measured in the same physical state (liquid, solid) and concentration range as the reference standard or library used for calibration. While the Beer- Lambert law is not valid for Raman (RS) spectroscopy, Raman (RS) -intensity is directly proportional to the concentration of the Raman (RS) scattering analytes; For solid samples and suspensions the Raman (RS) intensity may be affected by the matrix (owing to fluorescence and self-absorption). The Raman (RS) signal is influenced by the refractive- index of the material, the particle size and the particle-size distribution (where small -particles give a relatively more- intense Raman (RS) scattering than the large particles), the packing density, the scattering cross-section, the absorption cross-section.”
Material and Methods
With an observational method some relevant scientific literature and Figures 1-16 are reported and then analizyed. After this review and experimental project hypotesys is submitted in order to provide a complexive glogal conclusion related the topic of this article. All literature comes from scientific bio medical database.
Results
From literature: 04 August 2016 Raman (RS) spectroscopy as a process analytical technology for pharmaceutical manufacturing and bioprocessing. Karen AEW, et al. [3] “Adoption of Quality by Design principles, regulatory support of QbD, process analytical technology (named PAT), and continuous manufacturing are major factors effecting new approaches to pharmaceutical manufacturing and bio processing. In this review work , we highlight new technology developments, data analysis models, and applications of Raman (RS) spectro-scopy, which have expanded the scope of Raman (RS) spectro-scopy as a process analytical technology. Emerging technologies such as transmission and enhanced reflection Raman- (RS), and new- approaches to using available technologies, expand the scope of Raman (RS) spectroscopy in pharmaceutical manufacturing process, and now Raman (RS) spectroscopy is successfully integrated into real-time release testing, continuous manufacturing, and statistical process control. Since the last major review of Raman (RS) as a pharmaceutical PAT in 2010, many new Raman (RS) applications in bio processing have emerged. Exciting work reports of in situ Raman (RS) spectroscopy in bioprocesses complement a growing scientific field of biological and bio-medical Raman (RS) spectroscopy. Raman (RS) spectroscopy has made a positive impact as a process analytical and control tool for pharmaceutical manufacturing and bio processing, with demonstrated scientific and financial benefits throughout a product’s lifecycle. Raman (RS) spectroscopy is an optical spectroscopy technique that provides a “molecular finger-print” of a sample.
As optical- method, Raman (RS) enables non-destructive analysis of chemical composition and molecular structure. Applications of Raman (RS) spectroscopy in polymer, pharmaceutical, bio processing, and bio medical analysis have surged in the past 3 decades as laser sampling and detector technology has improved. Because of these technological advances, Raman (RS) spectro-scopy is a practical analysis technique inside and outside the laboratory. The Raman (RS) spectro scopy is an established PAT tool. Since 1980s, Raman (RS) spectro scopy has been used to study active pharmaceutical ingredients (API). Raman (RS) spectro scopy as a tool for API analysis has been described for various applications, as polymorph identification, quantitative analysis QA, in situ crystallization monitoring, real-time release testing, pharmaceutical -unit operations PUO, and process-induced transformations . In addition to identifying isolated poly-morphic forms, mixtures of forms can be analyzed and quantified . The diverse structures that have been measured by Raman (RS), from the discovery lab. to the manufacturing environment, show that Raman (RS) can reliably provide quantitative data. In-line Raman (RS) spectro scopy can control critical process parameters, enables real- time process corrections, and ensures consistent production of the correct API form. We highlight the new applications in API synthesis and crystallization, real-time release testing, flow or continuous- manufacturing, and new developments in Raman (RS) spectroscopy for understanding and controlling bio processes Regulatory- perspectives and also guidance.
A philosophical change in pharmaceutical manufacturing quality, which is strongly encouraged by regulatory agencies, has created opportunities to integrate real-time process analytics into manufacturing processes. In 2002, the U.S. FDA launched an initiative to encourage innovation in manufacturing technology and quality system approaches. The FDA 2004 PAT- framework strongly emphasized a shift from tested-in quality after the drug product was produced to building in quality throughout production with “continuous real time quality assurance”. The EMA established a PAT team in 2003, which released guidance documents on process PAT, quality by design (QbD), and real-time release testing. International Conference on Harmonization (ICH) Q8, Q9, Q10, and Q11 documents reinforced FDA and EMA guidance, which has been implemented in the USA, EU, and Japan since 2009.
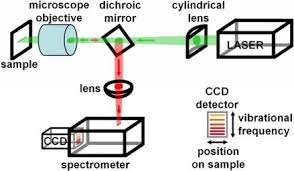
The FDA and ICH documents provided a strategic- guidance, rather than prescriptive- guidance, on developing an approach to understand and manage the risks that might affect critical quality attributes. PAT has an crucial role in this new framework to understand and manage risk throughout a pharmaceutical product’s lifecycle. Recently, these principles were extended to bio processing. As a PAT in pharmaceutical manufacturing and bio processing, Raman (RS) spectro scopy has demonstrated value from scientific understanding to process control. Over the past 25 years, Raman -(RS) spectroscopy instrumentation has evolved from home-built academic lab. Instruments to robust commercially available solutions-based systems. The advent of stable laser sources, high-speed optical fibers, volume holo graphic gratings, and low-noise charge coupled device detectors enabled robust commercial Raman (RS)- spectroscopy instruments. Newer commercial instruments are straight-forward to use because they do not require constant realignment or sophisticated knowledge of optics, are equipped with instrument control -software CS, and are integrated with Raman (RS) spectral -libraries. Thus, Raman (RS) spectroscopy is accessible to scientists and environments beyond the academic research environment world. Modern instrumentation has been reviewed in detail elsewhere. There are three basic components of a Raman (RS) spectro-graph, including a laser, sampling optics, and detector. Modern Raman- (RS) instruments optimizes the amount of inelastically scattered -photons and their detection. Modern Raman (RS) instruments use a laser as the illumination source because it is a high-intensity mono-chromatic source of light.
While the laser wavelength can vary from the UV to the near-infrared (λ = 200-1064nm), most pharmaceutical or bio-processing applications use near-infrared wavelengths (λ = 785 or 830nm), primarily to minimize fluorescence interferences.
Articles, bubbles, or droplets with sizes approaching the excitation wave-length exhibit Lorenz-Mie scattering, which causes aqueous systems to become turbid. Photons can be scattered multiple- times, resulting in photons being diffusely distributed in a turbid- media. API or excipient particles and cellular organelles, like mitochondria and nuclei, also strongly scatte-r light. Understanding photon -transport in turbid media is an important consideration for the quantitative Raman (RS) spectroscopy applications in content uniformity, real-time release RTR testing, and in situ bio process control. Much research has been devoted in developing Raman (RS) spectroscopy for pharmaceutical solids analysis, taking into consideration process compatibility, validation, and ease of use. Figure 5 reported shows the variants of Raman (RS) spectro scopy that utilize fiber optic probes. Within the process environment, the sampling flexibility of Raman -(RS) spectro scopy means that Raman (RS) can be employed as an off-line, at-line, on-line, or in-line (or in situ) PAT. Pharmaceutical excipient chemical and physical -properties are typically a critical process parameter because they affect manufacturability, bio-availability, and risk of process- induced API transformations. Raman (RS)- spectroscopy measures excipient material attributes non-destructively and rapidly, with handheld systems typically used for this application. A comprehensive database of commonly used pharmaceutical- excipients contains both the Raman (RS) spectrum and band assignments . The excipient spectrum can be affected by different crystal forms, amorphous -content, or other process variations. In-house preparation of excipients or bio pharmaceutical formulations may require its own risk-based manufacturing approach (3)”.
Journal of Pharmaceutical and Biomedical Analysis
Volume 76, March 2013. In situ monitoring of powder blending by non-invasive Raman (RS) spectrometry with wide area illumination Pamela A, et al. [4].
“A 785 nm diode -laser (and probe with a 6 mm spot size) were used to obtain spectra of stationary- powders and powders mixing at 50 rpm in a high shear convective blender. 2 methods of assessing the effect of particle characteristics on the Raman (RS) sampling depth for micro-crystalline cellulose (Avicel), aspirin or sodium- nitrate were compared: (A) the information depth, based on the diminishing Raman (RS) signal of TiO2 in a reference plate as the depth of powder prior to the plate was increased, and (B) the depth at which a sample became infinitely thick, based on the depth of powder at which the Raman (RS)- signal of the compound became constant. The particle size, shape, density and/or light absorption capability of the compounds were shown to affect the “information” and “infinitely- thick” depths of individual compounds.
When different sized -fractions of aspirin were added to Avicel as the main component, the depth values of aspirin ASA were the same and matched that of the Avicel: 1.7 mm for the “information” depth and 3.5 mm for the “infinitely- thick” depth. This latter value was considered to be the minimum Raman (RS) sampling depth when monitoring the addition of aspirin to Avicel in the blender. Mixing profiles for aspirin ASA were obtained non-invasively through the glass- wall of the vessel and could be used to assess how the aspirin blended into the main component, identify the end- point of the mixing process (which varied with the particle size of the aspirin ASA), and determine the concentration of aspirin in real time. The Raman (RS) procedure was compared to 2 other non-invasive monitoring techniques, near infrared (NIR) spectro-metry and broadband acoustic emission spectro- metry. The features of the mixing profiles generated by the 3 techniques were similar for addition of aspirin to Avicel. Even if Raman (RS) was less sensitive than NIR spectrometry, Raman (RS) allowed compound specific mixing profiles to be generated by studying the mixing behaviour of an aspirin a High lights. Powder blending monitored non-invasively by wide area Raman (RS) spectro metry. Effect of the particle size on sampling depth and Raman (RS) -signal investigated for wide area illumination. Raman (RS) measurements used to monitor mixing dynamics, determine end-point and perform quantitative analysis. Higher chemical specificity of Raman -(RS) compared to near infrared- spectrometry offers advantages for multi-component mixtures spartame/Avicel mixture” (4).
![Figure 7: Figure 1. Illustration of the portable Raman (RS) device used: (A) sample holder, (B) the device, (C) mean Raman (RS) spectrum of the de-ionised water collected from a glass vial, and (D) a Raman (RS) spectrum of glass. From Molecules In Situ Water Quantification in Natural Deep Eutectic Solvents Using Portable Raman (RS) Spectroscopy by Elderderi S, et al. [5]](/fulltextimages/9220/fig_7.png)
Figure 6: n from Raman (RS) Spectroscopy: a non-destructive, non-contact and simple technique to characterize carbon materials - part 1: Carbon nanotubes VENERDÌ, 02 OTTOBRE 2020 07:53. From ABCS website https://www.abcs.it/it/ blog/caratterizzazione-materiali/Raman (RS)-spectroscopy-a-non-destructive-non-contact-and-simple-technique-to- characterize-carbon-materials-part-1-carbon-nanotubes Why Raman (RS) spectroscopy has been used?
- Advantages of Raman (RS) spectroscopy
- Very small samples
- No special preparation of samples
- Ease of use
- Non-destructive and non-contact analysis
- Measurement of various types of samples (liquids, solids, powders, etc.)
- Raman (RS) Spectro scopy needs relative short time. So we can do Raman (RS) Spectro scopy detection very quickly.
- Raman (RS) spectro scopy is one of the most informative probes for studies of material properties under extreme conditions of high pressure and low- temperature
Depth Analysis
https://www.contractpharma.com/issues/2021-09-01/ view_features/Raman (RS)-spectroscopy-for- pharmaceutical-analysis-quality-control/
Raman (RS) Spectroscopy for Pharmaceutical Analysis & Quality Control
Raman (RS) spectroscopy helps ensure quality along the pharma supply chain of materials—from incoming raw materials through to finished product.
Jacques Ledru, Head of Characterization, Catalent, Nottingham 2021
“Raman (RS) spectro scopy has many applications within the pharmaceutical- industry. It can be used to identify polymorphs, to analyze active pharmaceutical ingredient (API) forms and their distribution within formulated -products. But what is it, and how can it be applied in practice filed?
In contrast to the standard infrared (IR)- spectroscopy, which identifies the specific frequencies of radiation that are absorbed by a sample, Raman (RS) spectro-scopy studies the way light is scattered by the molecules. As a laser beam passes through the sample, much of the light passes through and scatters with its energy un-changed; this is known as Rayleigh- scattering. Some of its photons collide with the molecules and lose -energy, in a phenomenon known as a Stokes -shift. Others may pick up energy from the excited molecules and emerge with a higher- energy level, or an anti-Stokes shift. In Raman- (RS) spectro-scopy, the light that emerges is collected, and that which is scattered without changing energy is filtered out. What remains provides a unique spectral- pattern for that individual molecule. This finger print can be used to identify the molecule by comparing the pattern to an knowed reference substantia.
Transmission Raman (RS) spectrometry, mean while, often gives better results when sampling solids than a conventional backscatter Raman (RS) technique as the radiation passes through the sample analyzing a much larger volume. As the technique is a non-evasive and non- destructive, it can be used for the direct analysis of batches of hundreds of whole -tablets, or capsules, that can be scanned in minutes, and can quantify both the API (down to less than 1% drug loading) and the excipient in a single measurement using appropriately developed partial least- squares calibration- models.
In this kind of technique, the incident light is passed through an objective - lens, and focused onto a very small spot. This allows resolution down to fractions of a micron to be achieved. The distribution of components within a sample can be determined in this way, the laser can be focus on the sed on specific areas of concern. This may be to determine the presence / identification of a suspected contaminant, particle or other un expected feature, and as such, Raman- (RS)- microscopy is much more sensitive than techniques used for the analysis of a material’s bulk -properties.”
Talanta
Volume 250, 1 December 2022, 123719 Talanta Raman (RS)-based detection of ciprofloxacin and its degradation in pharmaceutical formulations Chen Liu Lisa Müller-Bötticher ChangLiude Jürgen Poppa Dagmar Fischerg Dana Cialla- Mayab “A Raman (RS)-based label-free analytical method was developed to detect antibiotic ciprofloxacin (CIP) in various pharmaceutical formulations in the presence of different matrices (ear drops, eye drops and infusion- solutions)”.
“European Pharmacopoieia (Ph. E.), provides the legislative framework for product testing and regulatory- bodies such as the European Directorate for Quality of the Medicines (EDQM) prequalify methods for these purposes, including the biological- standards to be used to obtain comparability. Between the methods established for quality control of classical medicines the so called “non-invasive”, e.g., non-destructive, techniques, such as near-infrared and the Raman -(RS)- spectroscopy have been applied for molecular- imaging and analytics in process analytical- technology and are implemented in quality by design (QbD) concepts.
Recent technical developments and works in the field of the Raman (RS) - technology now enable manufacturers to use this technique for analysis of more- complex biological products including protein mixtures in bio reactors and cell- based and tissue-engineered products. Raman (RS) -micro spectroscopy is an inelastic light scattering-based method useful for the non-destructive analysis of bio chemical samples. It provides a wealth of molecular information on a specimen by the sample’s own inherent vibrational -signatures.
As the bio-chemical composition of a sample is mirrored in the Raman (RS) spectrum, mathematical methods including analytical modelling translate the physically recorded Raman -(RS) data into higher level information, which can further be exploited for comparative analyses. The fingerprint-like specificity of spectral -signatures can be utilized to setup a reference data base of tested biological -products for identification purposes” (5).

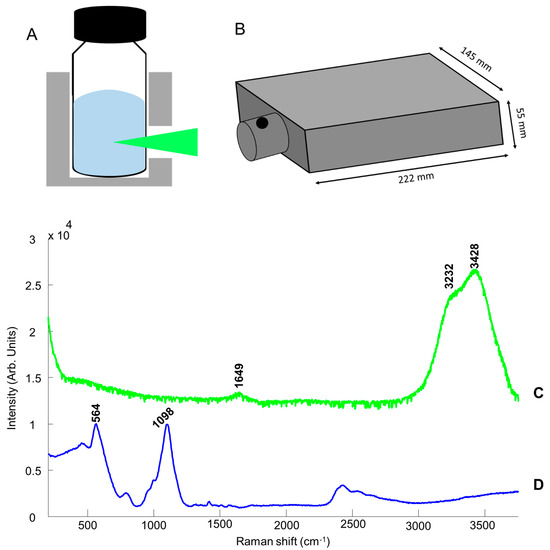
Figure 7: Figure 1. Illustration of the portable Raman (RS) device used: (A) sample holder, (B) the device, (C) mean Raman (RS) spectrum of the de-ionised water collected from a glass vial, and (D) a Raman (RS) spectrum of glass. From Molecules In Situ Water Quantification in Natural Deep Eutectic Solvents Using Portable Raman (RS) Spectroscopy by Elderderi S, et al. [5]
Analytical and Bioanalytical Chemistry Anal Bioanal Chem. 2022
The role of Raman (RS) spectroscopy in biopharmaceuticals from development to manufacturing Karen A, et al. [6] (RS) spectroscopy as a process analytical technology (PAT) in bioprocessing “Advances in cell -engineering, process control, and media composition are credited with improving the volumetric yield of cell- culture bio processes, making bio pharmaceutical manufacturing more cost-effective and practical . Adoption of the PAT and Quality by Design (QbD) principles is an important contributor to improvements in bio- process control. PAT provides real-time understanding which helps to manage risk throughout a bio pharmaceutical product’s lifecycle. The PAT- framework is an integrated approach using historical process knowledge, modeling, and analyses. Many types of physical and chemical analyses are used for bio processing. Traditional parameters like pH, temperature, dissolved oxygen, feed composition, and feed timing are measured in situ.
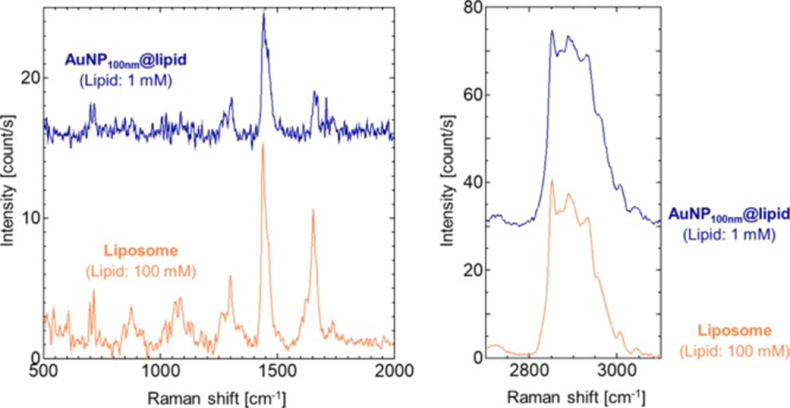
Figure 8 : 16 Raman (RS) spectra of AuNP100nm@lipid (blue) and liposome (orange), obtained wit h total lipid concentrations of 1 and 100mM, respectively. Lipid- compositions were DOPC/Chol (60/40). All the samples were measured at 25°C. At least three reproducible spectra were obtained for each system. Raw- spectral data are shown in the Supporting Info.
Bio-chemical -parameters such as nutrients, metabolites, amino acids, proteins, cell viability, and biomass can be measured by spectroscopy, electro-chemical sensors, bio- chemical assay, or chromatography. These biochemical PATs can be used in situ, integrated with an automated sampler for at-line measurements, or off-line. Spectroscopy- PAT techniques are based on light’s interactions with materials. They provide a fast, label-free, non-invasive, and non- destructive chemical analysis of a material” (6).
And in Article 2017
Adenosine Triphosphate-Encapsulated Liposomes with Plasmonic Nanoparticles for Surface Enhanced Raman (RS) Scattering-Based Immunoassays Xuan HP, et al. [7] ,Eunil Hahm ,Tae Han Kim ,Hyung-Mo Kim ,Sang Hun Lee ,Yoon-Sik Lee ,Dae Hong Jeong Bong-Hyun Jun Sensors 2017.
Preparation of ATP-Encapsulated Liposomes and SiO2@Au@Ag NPs
We designed and fabricated ATP-en-capsulated liposomes that could release ATP only when the liposome structure was ruptured for SERS-based immuno-assays as shown in the Scheme reported. So For this, ATP en-capsulated lipo-somes and gold-silver alloy (Au@Ag)-assembled silica NPs (SiO2@Au@Ag) were prepared, separately. Both liposomes and SiO2@Au@Ag NPs alone were inactive for SERS -measurement. When the liposome’s structure is broken, and the ATP is released, a strong SERS signal could be obtained, because the released ATPs are immobilized on SiO2@Au@Ag NPs.” (7).
From https://patents.google.com/patent/ US20130273561 (19) United States (12) Patent Application Publication (10) Pub. No.: US 2013/0273561 A1 Walker et al. US 20130273561A1 (43) Pub. Date: Oct. 17, 2013.
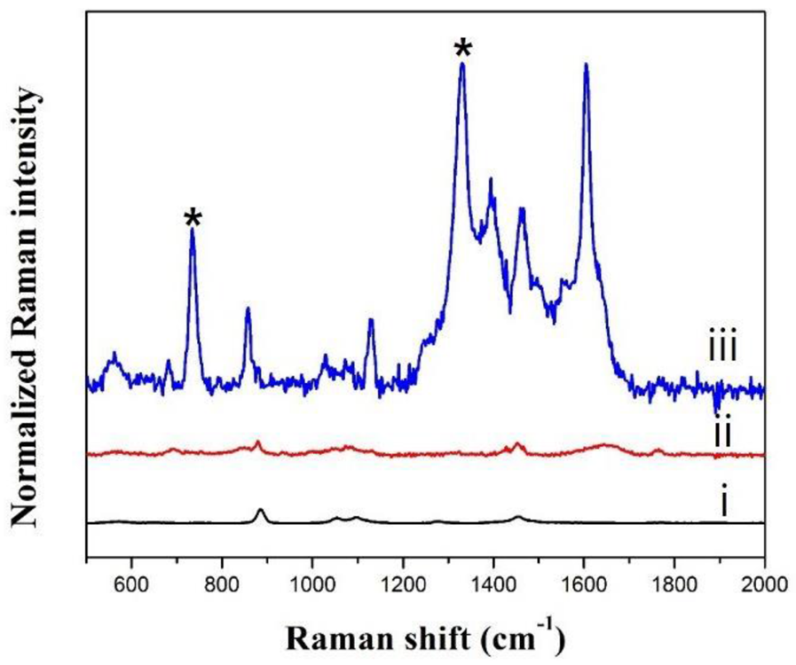
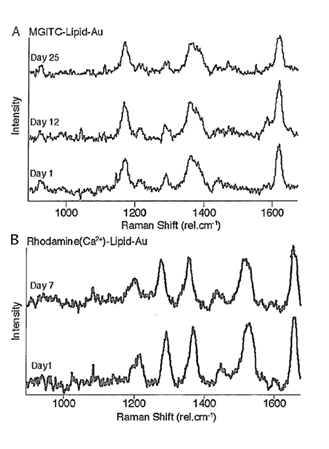
Figure 10: 18 shows the stability of MGITC-lipid-coated particles and Rho-lipid-coated-particles in which;
- shows the SERS spectrum of MGITC-lipid-coated particles collected on day of synthesis, 12 days, and since 25 days after synthesis; and
- shows the SERS spectrum of Rho-lipid-coated- particles collected on day of synthesis, and 7 days after synthesis, in which for both cases, (particles were stored in water at 4 deg C. between the measurements)
Nanomaterials (Basel). 2019 Mar
Raman (RS) Imaging of Nanocarriers for Drug Delivery Sally VH, et al [8] “A major advantage of the Raman (RS) is that it allows direct imaging of the nanocarriers, and not the payload en-capsulated within them” (8).
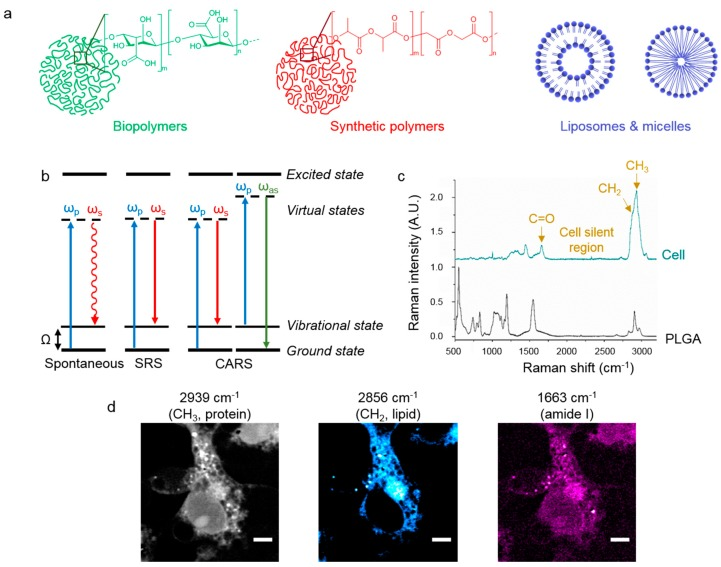
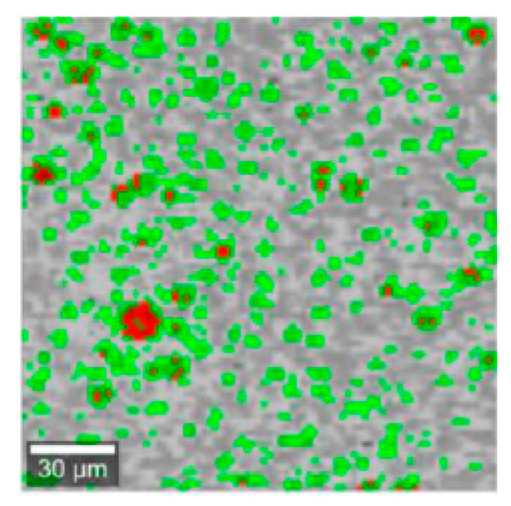
Figure 12: Ram an imaging of nano carriers. (a) Representation of different materials which can be fabricated into nano- carriers, such as biopolymers (alginate), synthetic polymers (PLGA), and lipids (liposomes and micelles). (b) Energy- level diagrams showing the processes of spontaneous Raman (RS), stimulated -Raman (RS) scattering (SRS), and coherent anti- Stokes Raman- (RS)- scattering (CARS). (c) Spontaneous Raman (RS) spectra showing the characteristic peaks in microglia (top, green spectrum) and PLGA, a common polymer for drug delivery (bottom, black spectrum). The Spectra are normalized and offset for clarity. (d) SRS -images of microglia when Ω = 2939 cm−1 (CH3, proteins, grey), 2856 cm−1 (CH2, lipids, cyan), and 1663 cm−1 (amide I, magenta). Scale bars = 5 µm. Nanomaterials (Basel). 2019 Mar 2019 Mar 3. doi: 10.3390/nano9030341 Raman (RS) Imaging of Nanocarriers for Drug Delivery Sally Vanden-Hehir, William J. Tipping, Martin Lee, Valerie G. Brunton, Anna Williams, and Alison N.
Hulme “There are various ways of fabricating materials into nano carriers, depending on the desired properties of the final formulation and the drug to be en-capsulated. The polymer is dissolved in an organic solvent prior to emulsification with an aqueous -phase to form nano-sized droplets, which become the nano carriers upon evaporation of the organic solvent . Hydrophobic drugs can be added into the organic phase with the polymer, whilst the process can be modified to a double water-in-oil-in-water emulsion to en-capsulate hydrophilic drugs. Liposomes are generally formed by a lipid -film hydration method , and micelles will self-assemble in an aqueous -solution above the critical micelle- concentration” (8)
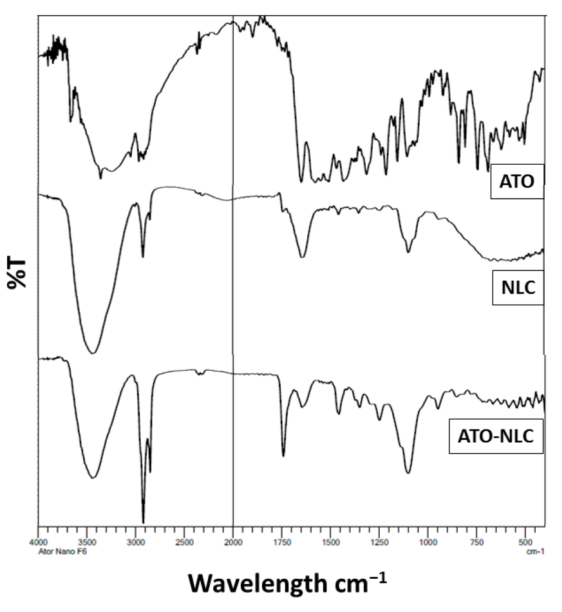
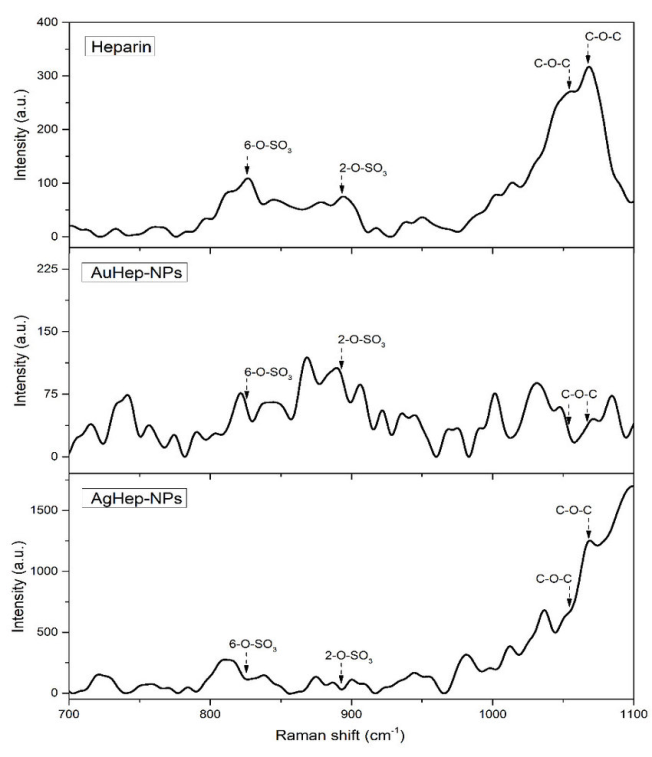
Figure 15: FTIR spectra of pure ATO (atorvastatin), free NLC (Nano structured lipid carrie)and optimized ATO-NLC formulation. From settings Hypolipidemic Activity of Olive Oil-Based Nano structured Lipid Carrier Containing Atorvastatin by Heba S, et al. Academic Editors: Rosalia Bertorelli, Gemma Gutierrez and Maria Matos Nanomaterials , https://doi.org/10.3390/nano12132160 23 June 2022
From Antifungal and Cyto-toxic Evaluation of Photo chemically Synthesized Heparin-Coated Gold and Silver
Nanoparticles June 2020 Molecules 25(12) DOI: 10.3390/ molecules25122849. Project: Micro and nano-structured novel biomaterials for the inhibition of micro organisms that cause oral infections.
Lab: Nano-estructuras y Biomateriales, Laboratorio de Investigación Interd. (LII) María Del Pilar Rodrígue, et al From https://www.pei.de/EN/newsroom/press-releases/ year/2018/20-raman-spectroscopy-allows-fast-analysis-of- vaccines.html 20/2018 “Vaccines are complex kin of bio medicines (drugs) composed of a number of different molecules. In the manufacturing- process and before marketing authorisation, extensive research is required to verify the identity, quality, efficacy and safety of the products. Fast, cost-effective yet reliable chemico analytical -methods are necessary and can contribute to fighting against counterfeit medicines. Researchers from Paul-Ehrlich-Institut have shown with scientists from Jena that the Raman spectroscopy (RS) is a suitable tool for this. The results are reported by NPJ Vaccines in its edition of 04.10.2018.
In Raman -spectroscopy (RS), molecules or solids are exposed with laser light. The inelastic scattering of the light and the associated differences in frequency with the incident light allow conclusions to be drawn about the examined substance. The so-called molecular finger-print allows the quick and easy identification of any molecule. The method is used, for example, to study the material properties of semi conductors or for infection diagnostics. The process is also used in the quality control of chemical- medicines (tablet form), in drug manufacturing (fermenter) and for the identification of counterfeit -medicines.
Researchers applied the Raman maps to analyze specific Raman signatures from air-dried samples of combination vaccines containing antigens (AG) from tetanus, diphtheria, and pertussis (DTaP vaccines). In fact, the vaccines could be identified and distinguished using these specific signatures”.
Silge A, et al. [5] “Vaccines are complex bio medicines. Manufacturing is time consuming and requires a high level of quality control (QC) to guarantee consistent safety - potency. An increasing global demand has led to the need to reduce time and cost of manufacturing. The evolving concepts for QC and the up coming threat of falsification of bio medicines define a new need for methods that allow the fast and reliable identification of vaccines. Raman spectroscopy- (RS) is a kind of non-destructive technology already established in QC of classical medicines. We hypothesized that Raman- spectro scopy RS could be used for identification and differentiation of vaccine products. Raman- maps obtained from air-dried samples of combination vaccines containing antigens from tetanus, diphtheria, pertussis (DTaP -vaccines) were summarized to compile product-specific Raman signatures. Sources of technical variance were emphasized to evaluate the robustness and sensitivity in down -stream data analysis. The data management approach corrects for spatial in- homogeneities in the dried sample while offering a proper representation of the original samples inherent chemical -signature. Reproducibility of the identification was validated by a leave-one-replicate-out cross-validation. The results high lighted the high specificity and sensitivity of Raman RS measurements in identifying DTaP vaccine -products. The results pave the way for further exploitation of the Raman technology for identification of vaccines in batch release and cases of the suspected falsification.
Preparation of the Sample
For Raman (RS) measurements vaccine suspensions were extracted from the containers into THE Eppendorf tubes, homogenized by vortexing and 1 μl was applied onto a CaF2 slide and dried at the room temperature Tta . The sample size was predicted using the learning -curve resulting in 5 replicates to be necessary. We planned with 10 in every group to ensure a valid statistical outcome. 20 minutes after the preparation- samples were visibly dry and the measures started with the first replicate. The last replicate was measured after ~2 hour later.
Technical Reasons for Variance of Raman Spectra RS
While examining air-dried vaccine samples by means of Raman micro-spectroscopy 2 sources of technical variance were identified. First, the drying -procedure of the colloidal vaccine droplets caused a spatial in-homogeneity of the vaccine material during evaporation, which is known as coffee-ring effect. Concentration gradients within the air- dried droplet resulted in spatial in-homogeneities and so therefore in variation of Raman signal intensity at different grid points. Second, vaccine products containing phenoxy- ethanol showed variations within their Raman- signature that roughly correlated with the drying time.
In Fig. reported the mean spectra of dTaP-IPV2, IPV, and dT2 are depicted. Each spectrum summarizes the Raman- RS signatures of one replicate mapped after the indicated drying interval. The mean spectra of the first replicates were measured after a drying interval of about 20 min.
These spectra were dominated by Raman RS signals that were previously assigned to phenoxy-ethanol by Badawi et al. These signals diminished in intensity the longer the vaccine suspensions were dried at room temperature, albeit to varying extents: For the vaccine products dTaP-IPV2 and IPV the signals disappear almost completely after a drying period of 2 h (Fig. reported) while in dT2 the phenoxy-ethanol signals remain prominent in related Raman -signature within the observed time span.
The dried spots of a vaccine suspension are not identical preparations, they rather represent technical replicates. Slight differences in the drying behaviour were obtained in the microscope images of distinct vaccine spots (as in Fig. reported). Also the evaporation behaviour of the phenoxy- ethanol is subjected to such fluctuations, Fig. reported. We suggest, each replicate has its individual drying -kinetic.The phenoxyethanol Raman signals can still be present after 100 min drying time in one spot while they were disappeared after 90 min drying in another spot (Fig reported). Aside from such fluctuations, the trend of the decreasing Raman -signal intensities of phenoxy-ethanol withongoing drying time due to evaporation is evident in the mean spectra of Fig. reported. For the statistical modelling, it is important to be aware of such variation.
The resulting spectrum is formed by the super-position and the reciprocal -influence of the underlying spectral values simultaneously recorded from all chemical constituents, like, vaccine antigens, adjuvants, buffer components and other kind of excipients. These signals are further influenced by the presence of solvents, the pH and the physical - properties, such as formation of crystals or amorphous particles within the vaccine suspension.
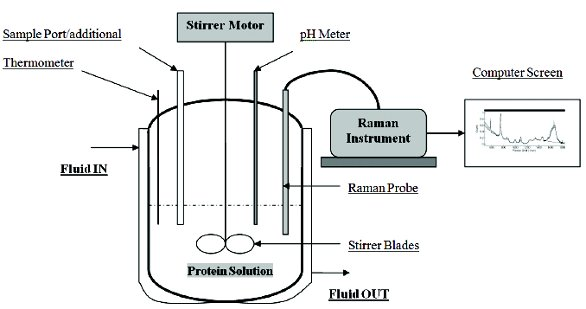
Thus, the mixture itself and other interfering effects complicate the analysis of the spectral- data. Well- established computational -methods were applied to correct for the influence of the instrumental setup or background noise. A common method for dimension reduction is the principal component analysis (PCA). PCA transforms a set of possibly correlated response variables into a new set of non- correlated variables, referred to as principal components (PC). The output of the PCA is the components in the order of significance. Components with less significance (assigned to noise) can be ignored. So the dimension of the data is reduced with-out loss of information.” (12) Analyst. 2006 Oct; doi: 10.1039/b605299a. Epub 2006 Aug 25. Raman spectroscopy as a process analytical technology tool for the understanding and the quantitative in-line monitoring of the homogenization process of a pharmaceutical suspension T R M De Beer 1, Baeyens WRG, et al. [11]. “The aim of this study work was to propose a Process Analytical Technology strategy for the quantitative in-line monitoring of an aqueous pharmaceutical suspension using RS Raman -spectroscopy. A screening design was used to study the significance of process variables (mixing speed and height of the stirrer in the reactor) and of formulation variables (concentration of the active pharmaceutical ingredient (API) ibuprofen and the viscosity enhancer (the xanthan- gum)on the time required to homogenize an aqueous pharmaceutical model suspension as response variable. Ibuprofen conc. (10% and 15% w/v) and the height of stirrer (position 1 and 2) were discrete variables, whereas the viscosity enhancer (conc. range: 1-2 g L-1) and the mixing -speed (700-1000 rpm) were continuous variables. Next, a multilevel full- factorial design was applied to study the effect of the remaining significant variables upon the homogenization- process and to establish the optimum conditions for the process. Interactions between these kind of variables were investigated as well. During each design experiment, the conformity index (CI) method was used to monitor homogeneity of the suspension mixing system in real-time using the Raman spectroscopy RS in combination with a fibre optical immersion probe. A principal component regression- (PCR) model was developed and evaluated to perform quantitative real-time and in-line measurements of the API during the mixing -process. The experimental design results showed that the suspension homogenization- process is an irregular- process, for which it is impossible to model the studied variables upon the measured response variable. Applying PCR model it is possible to predict in-line and real- time the concentration of the API in a suspension during a mixing process.
In this research work , it is shown that Raman spectroscopy RS is a suitable PAT tool for the control of the homogenization -process of an aqueous -suspension. Raman spectroscopy not only allowed real-time monitoring of the homogeneity of the suspension, but also helped (in combination with experimental design) to understand the global process. The technique allowed real-time and in-line quantification of the API during mixing -process” (13).
Pharmaceutics Article
Analytical Techniques for the Assessment of Drug-Lipid Interactions and the Active Substance. Distribution in Liquid Dispersions of Solid Lipid Microparticles (SLM) Produced de novo and Reconstituted from Spray-Dried Powders Eliza Wolska, et al. 15 July 2020.
“Raman spectroscopy (RS) detects the vibrations of molecules after excitation by an intensive laser beam . This technique has already been used as a tool to identify and localize specific components in various liquid - solid dosage forms. The use of Raman spectroscopy RS to characterize the colloidal and micro-particulate lipid systems is rare.
Raman spectro-scopy is a useful technique, as it involves no sample- preparation and, most importantly, allows measurements in the presence of water. At the current stage of our research, it has not brought the expected results, and the attempt to confirm with this technique the localization of the API on the surface of the SLM was un-successful.
Even if both CsA and SPIR were identified on the SLM surface, the dominant components on the Raman maps were lipids and polysorbate (or PVP). Discrimination on the spectra of the bands derived from the API and lipids (or other excipients) was impossible, mainly due to the spectral- properties of the tested API and their low concentrations in the formulations.
Experimental Project Hypotesys
In order to verify the absence/presence of graphe ederivates in vials of some bio- pharmaceutical compounds it is needed to test 100 sample of a new technological products (In example m RNA vaccine in nanolipids). This using analitycal procedure officially CGMP approved (RAMAN (RS) spettroscopy) and with the accettable sensibility. (one procedure with a classic destructive method and using also a non destructive method).
- Method as approved EUROPENA PHARACOPOEIA like direct non desctructive method
- Method as reported by some rearcher (with solvent extraction in a classic chemical methods befor test, destructive method) This sample must divided in group of 20 and sended blinded to various and different accreditated chemical laboratory and independent. It is needed a control group, all sample blinded, use standard solution. To be Performed qualitative and quantitative analisys. The sample must to be tretated for the pre-analitycal need (extraction) before to be analyzed. This in order to verify in the same condition the inside nanolipids included and outiside of this. Results: verify is there is or not significative presence of graphene or its derivated in the final approved vials. (p < 0,005) / The results must to be divided using a destructive method and a non destructive one. For a quantitative test it is necessary to use standard (due by charactheristics of the sample: lipids nanoparticles)
Discussion
It is interesting to observe the analitical behavior of nanoparticles- liposome with encapsulated molecule in a RAMAN (RS) spectra related the non encapsulated ones. Observing Figure 16 it is possible to say that encapsulated particle produce a reduced intensity in Raman (RS) Spettroscopy. The heparin molecule show greater intensity signal vs the heparin AU -hep - NPS (24) Also of interest to observe the kinetics during time of some nanoparticles as reported (18) and the fact that After 1 -12 -25 days the signal gradually increase.
Of great interest the fact that some researcher (as published by Young R.O) using other method Pre- treated the sample in order to have extraction before test.
And as reported Anja Silge “For Raman measurements vaccine suspensions were extracted from the containers into Eppendorf tubes, homogenized by vortexing and 1μl was applied onto a CaF2 slide and dried at room temperature” P. CAMPRA associate Professor ALMEIRA university Phd in Chemical sciences written: “Fundamentals of the micro -Raman (RS) technique Due to the characteristics of the sample and to the dispersion of objects with a graphene appearance of micro-metric size in a complex matrix of indeterminate composition, the direct application of spectroscopic methods does not allow characterization of the nano-particles studied here without a previous microscopic- localization or fractionation from the original sample.” According Sally Vanden-Hehir, et al. “A major advantage of Raman (RS) is that it allows direct imaging of the nanocarriers, and not the payload en-capsulated within them” EMA procedure (GMP) for quality control of final drugs and raw material write on its EUROPEN PHARMACOPEIA report that it can be used for classical drugs CQ -RAMAN (RS) SPETTROSCOPY aslo in non destructive direct method.
But because as reported in the “Assesment report “of a famous m RNA covid-19 VACCINE EMA [9] in febr. 2021
Provided specific obbligation to the producer in order to complete post- authorization measure for the conditionate marketing authorization: Additional information are needed for 1 eccipient ALC-0315 and the syntetic process .
Also as reported in the technical sheet of a m RNA covid-19 vaccine dec 2021 : “ 11.1. Information on hazard classes as defined in Regulation (EC) No 1272/2008” General Information: Toxicological properties have not been thoroughly investigated. The following information is available for the individual ingredients.
Information on hazard classes as defined in Regulation (EC) No 1272/2008
General Information: Toxicological properties have not been thoroughly investigated. The following information is available for the individual ingredients. Related the works of some independent reseacher Giovannini F,et al, [12] and the methods used before to test and their evidences it is of great interest to match with the EMA sententia that in a written responce confirm that graphene derivates was not present in the sample tested (obserbig the RAMAN (RS) spectra in the laboratory of proof related).
So because Graphene derivates are used in many bio technological process due to their properties in absorbtion, extracion , purification , carrier, adiuvant and many other : it is needed to verify the productive process in manifacturing new biopharmaceuticals to verify if impurity are present , waht kind and in what concentration. (and also in m RNA covid-19 vaccine) All this for toxicological and safety need obviously.
Of interest it is the fact that Scientific literature show various entity in RAMAN (RS) -INTENSITY for encapusalted and non encapulates molecule (nanoparticles- liposome). Direct RAMAN (RS) - technique is more efficacy in testing the nanoparticles (and not their payload) (8) The charcteristic kinetic destiny of this nanoparticle during the times it is also of interest : after Various days the signal increase (disruption of the nanoparticle contribute to make nacked the encapsuled molecule ?) in a reported literature.
So considering all this facts: it is recomended to whom it concern to test as reported in experimental project hypotesys the presence / absence of graphene GO in: 100 vials of the m RNA covid-19 vaccine - nanolipids using the method of classic analytical chemistry Like RAMAN (RS) destructive method with pre- treatment – extraction of the sample by solvent and 100 vials sample with the method as reported In EP like RAMAN (RS) spettroscopy non destructive direct method.
It is needed to send the sample to various certified labs using also control (blinded). The results must to be collected and the analized in statistical way in order to verify if there is similar results between the two groups or there are significative deviation [14].
Conclusion
After this review part , but, related the recent new evidences about graphene derivates finded in some vials of covid-19 vaccine by independed researcher , that seem not coerent whit the Regulatory agency analitic report and statement. The fact that the status of encapsulated molecule show different profile of intensity signal in RAMAN (RS) spettroscopy it is stretcly recomend to Perform the experimental hypotesys project submitted using this two methods (classic chemical pre-treatement of the sample before Raman (RS) and compared with a NON destructive direct Method as permitted by EP- EMA GMP).
It is crucial to verify the entity of the nanolipids particles EFFECT in the RAMAN (RS) SIGNAL of an encapsuled molecule to be searched: it can be relevant for the CQ?
What happen to the signal when dissolved nanolpidis? And nanolipids can influence/reduce intensity of RAMAN (RS) spectra of an analite to be detected ? According the authors only after see this results it will be possible to solve this apparent contraddiction. Between what showed by some independent researcher and the regulatory agency related a same analita. The only way it is to pre-treat the sample in the same way before register Raman (RS) for the two groups even if not request by the direct non-destructive methods .
Finally the entity of this phenomena : reduction of intensity of the signal of the payolad in a nanoparticle What kind of implication can have on GMP - CQ, PAT, regulatory process and for the toxicological Profile of a new innovative biopharmaceutical product? Impurity in classic drugs was observed in some cases even in registered and authorized drugs so why non deeply investigate the impurity profile also of m RNA covid-19 vaccine?
Expecially when some manifacturing procedure are not fully knowed also by regulatory agency and when for some eccipent used the control authority ask to the producer to provide complete information related quality test.
It is opinion of the authors that the responce provided by EMA related written question on graphene derivate presence or not in viasl of covid-19 vaccine must to be integrated with written information about the Intere analitical process used in the control lab (also related pre-treatement).
Conflict of Interest: no
References
-
Campra P (2021) Graphene oxide detection in aqueous suspension: Observational study in optical and electron microscopy.
-
Young RO (2021) Scanning & Transmission Electron Microscopy Reveals Graphene Oxide in CoV-19 Vaccines. Dr. Robert Young.
-
Karen AEW, Maryann C, Carsten U, Bruno L, Ian RL (2017) Raman spectroscopy as a process analytical technology for pharmaceutical manufacturing and bioprocessing. Analytical and Bioanalytical Chemistry 409(3): 637-649.
-
Pamela A, Luke JB, Alison N, David LJ, John A, Paul D (2013) In situ monitoring of powder blending by non-invasive Raman spectrometry with wide area illumination. Journal of Pharmaceutical and Biomedical Analysis 76: 28-35.
-
Silge A, Bocklitz T, Becker B, Walter M, Juergen P, et al. (2018) Raman (RS) spectroscopy-based identification of toxoid vaccine products. Respiratory Research 50.
-
Karen AEW, Maryann C, d Ian RL (2022) The role of Raman (RS) spectroscopy in biopharmaceuticals from development to manufacturing. Analytical and Bioanalytical Chemistry Anal Bioanal Chem 41(2): 969- 991.
-
Xuan HP, Eunil H, Tae HK, Hyung MK, Sang HL, et al. (2017) Adenosine Triphosphate-Encapsulated Liposomes with Plasmonic Nanoparticles for Surface Enhanced Raman (RS) Scattering-Based Immunoassays. Sensors 17(7): 1480.
-
Sally VH, William JT, Martin L, Valerie GB, Anna W, et al. (2019) Raman (RS) Imaging of Nanocarriers for Drug Delivery. Nanomaterials 9(3): 341.
-
EMA (2021) Committee for Medicinal Products for Human Use (CHMP) Assessment report Comirnaty -Common name: COVID-19 mRNA vaccine.
-
De Beer TRM, Baeyens WRG, Ouyang J, Vervaet C, Remon JP (2006) Raman spectroscopy as a process analytical technology tool for the understanding and the quantitative in-line monitoring of the homogenization process of a pharmaceutical suspension. Analyst 131(10): 1137-1144.
-
Giovannini F, Capelli RB, Pisano G (2021) Dark field microscope analysis of the blood of 1006 symptomatic subjects after vaccination whit two types of mRNA vaccine.
-
Eliza W, Małgorzata S, Katarzyna K, Maria FM (2020) Analytical Techniques for the Assessment of Drug-Lipid Interactions and the Active Substance Distribution in Liquid Dispersions of Solid Lipid Microparticles (SLM) Produced de novo and Reconstituted from Spray-Dried Powders. Pharmaceutics 12(7): 664.
-
Ki Yeob J (2022) Moving and Living Micro-Organisms in the COVID-19 Vaccines - Prevention, Early Treatment Cocktails for COVID-19 and Detoxifi cation Methods to Reduce sequels of COVID-19 Vaccines. American J Epidemiol Public Health 12: 6(1): 001-006.
- Spectrophotometric Determination of Lanthanum (III) and Some Rare Earths with Xylenol Orange
- Introduction and Sources of Molluscicides
- Trimetazidine: An Antianginal Drug and Not Only!
- Nature Inspired Discovery and Development of Antibacterials: An Update
- Fungal Biodegradation of Polycyclic Aromatic Hydrocarbons (PAHs)
- Recent Approaches of Impurity Profiling in Pharmaceutical Analysis: A Concise Review