Structural, Morphological Studies and Photocatalytic Activity of CdZns Nanoparticles Fused with Ocimum Tenuiflorum Leaf Extract
A group 2-6 ternary semiconductor nanoparticle, CdZnS mixed with Ocimum Tenuiflorum leaf extract was prepared using chemical precipitation method at two different concentration of extract (10 ml and 20 ml). Structural, elemental, morphological, optical analyses were done. Particle size of the prepared sample was calculated using XRD pattern, also structure of the sample was confirmed. Elemental analysis was done using EDAX, confirms the elemental composition in the corresponding ratio. SEM study was employed to analyse the morphology of the sample. UV –Visible spectroscopy was done to analyse the absorption of the sample as well as Tauc plot was used to find the band gap energy. Photocatalytic activity of the sample was studied and investigated that the photocatalytic degradation was enhanced by adding the leaf extract to the CdZnS nanoparticle. The present study concentrates on the structural, morphological and optical changes occurred by adding the leaf extract. Also the effect on photocatalytic activity of CdZnS nanoparticles by adding the leaf extract.
Introduction
Nanomaterials can find solutions for many technological and environmental challenges in the field of solar energy conversion, medicine, and wastewater treatment. For a considerable period of time, emphasis on the synthesis of metal nanoparticles and quantum dots has been increased because of their unique optical and electrical properties. The surface plasmon resonance (SPR) displayed by the metal nanoparticles is one of their most important characteristics making them unique with these optical properties. Metal nanoparticles proved to be very active and useful in the field of electronics, photonics, and medicine. The properties of metal nanoparticles change according to their size, shape, and morphology. Nanoparticles and nanocomposites have been synthesized by chemical precipitation, solid-state and ligand-supported approaches. The resultant nanostructure shows unique properties and is employed in various applications [1]. The introduction of nanoparticles found solutions for many challenges in the field of solar energy conversion, medicine and wastewater treatment. The importance of synthesizing nanoparticles has been increased because of their unique optical and electrical properties.
Cadmium Sulphide and Zinc Sulphide are semiconductors that belong to group II-VI semiconductors, which have direct band gaps of 2.4 eV and 3.7 eV respectively. They are found to be an effective catalyst, resulting from the production of fast electron-hole pairs and the highly negative redox potentials of excited electrons [2, 3]. Cadmium zinc sulfide (CdZnS) SCs
has been widely used as efficient wide-bandgap materials for photocatalytic degradation, because of their fine and tunable absorption in the visible region of solar energy and excellent electrical conductibility.
Plant extracts have excellent properties for the synthesis of new nanoparticles, including gold. Still, which constituents are the major players in plant leaf extracts that lead to the formation of nanoparticles is yet to be established. Biosynthesis of nanoparticles by plant extract has several advantages and is cost-effective with high potential [4].
Following are the objectives of the present study:
- Structural changes by X-Ray diffraction analysis
- Morphological changes using SEM analysis
- Optical Changes by UV- Visble spectrum
- Variation in Energy Band gap using Tauc’s plot
- Elemental analysis using EDAX
- Photocatalytic activity Of CdZnS nanoparticles by adding leaf extract of Ocimum Tenuiflorum
Experimental Details
Synthesis of Nanoparticles
CdZnS nanoparticles mixed with Ocimum Tenuiflorum were synthesized by the chemical precipitation method. Following chemicals were used for the synthesis. Cadmium acetate (Cd(CH3COO)2.H2O), Zinc acetate (Zn(CH3COO)2.H2O), thiourea (NH2)2.CN), ammonia (NH3OH), triethanolamine, TEA (N(CH2CH2OH3 A specific amount of zinc acetate and cadmium acetate was added to water and mixed for 10 minutes using a magnetic stirrer. After stirring some triethanolamine was added to the solution and stirred for 10 minutes. Then ammonia was added to the solution and stirred well for 20 minutes, thiourea was added to the solution and it was colourless. The desired amount of Ocimum Tenuiflorum extract was added and stirred well. The solution was then placed in a constant temperature bath of 80oC for 1 hour to avoid any temperature gradient. And obtain a greenish- yellow coloured precipitated solution. The precipitate obtained is CdZnS nanoparticles mixed with Ocimum Tenuiflorum extract. The obtained precipitated solution was then centrifuged and washed with deionised water and dried in hot air at 70oC for 1.5 hours, a greenish-yellow powder was obtained. This powder was finely powdered with the help of Agate mortar for ½ an hour.
Preparation of Extract
Ocimum Tenuiflorum extract was prepared as follows, Ocimum Tenuiflorum leaves were collected, washed thoroughly with water and then with deionised water. The water content was dried and then crushed using a mortar. The crushed leaves were then squeezed to get the extract.
Characterization
The prepared sample was subjected to XRD characterization using a Bruker d2 Phaser X-ray diffractometer. The data were recorded over a range (2q) from 0o to 80o with a step size of 0.02o and of wavelength 1.50460 Å. The surface morphology of the nanoparticles was determined using Carel Zeiss, EV018 scanning electron microscope. Optical absorption spectra of the synthesized CdZnS nanoparticles were recorded on the Perkin Elmer UV- visible spectrometer, model- Lambda35 in the wavelength range 190nm to 1100nm. Elemental analysis of the prepared sample was done using TESCAN VEGA3 SBH, a versatile tungsten thermionic emission SEM system intended for both high- and low-vacuum operations.
Its resolution is 2 nm and the magnification ranges up to 1,50,000. Particle size analysis is used to interpret the size distribution of particles in a given sample. The analysis was done using the Micromeritics Model: Nano Plus The instrument can measure (Dilution Method) the particle size of samples suspended in liquids in the range of 0.1 nm to 12.3 µm with sample suspension concentrations from 0.00001% to 40%, and sensitivity for molecular weight to as low as 250 Da.
Results and Discussion
Structural Studies
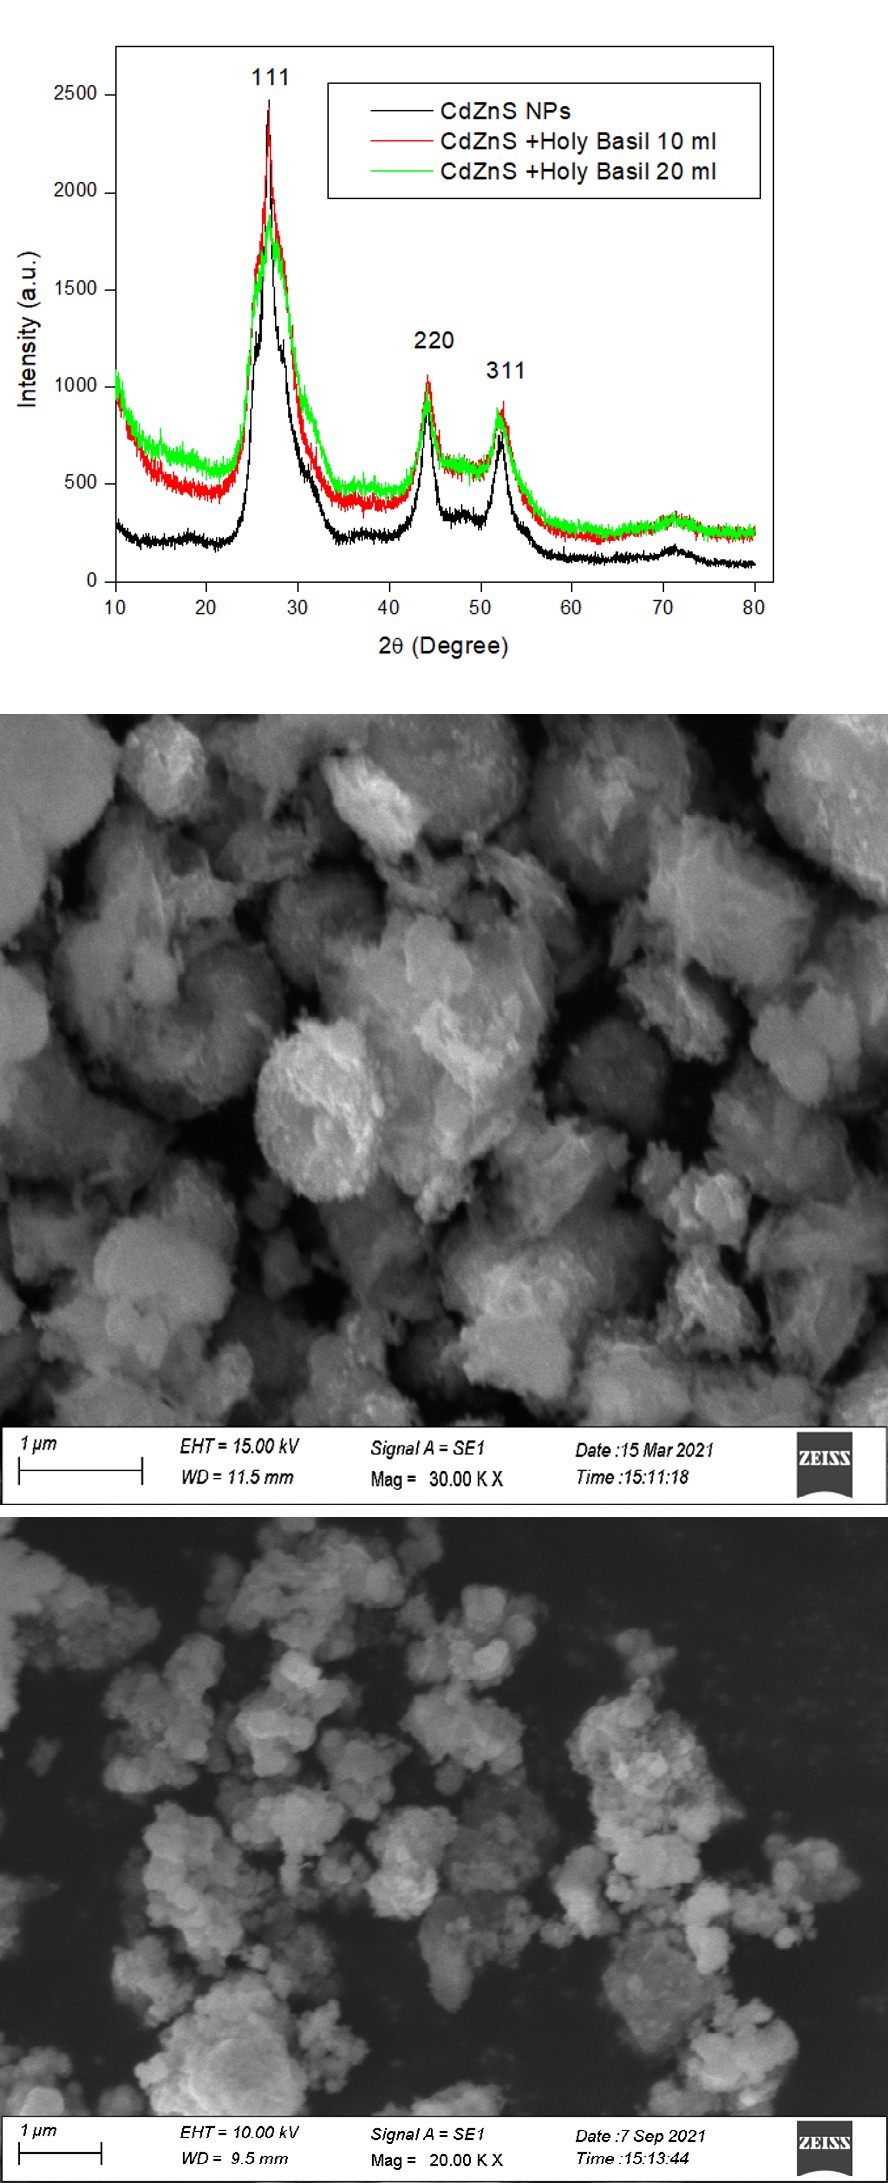
The XRD patterns of pure CdZnS NPs and CdZnS with Ocimum Tenuiflorum extract are indicated in (Figure 1). All the peaks in the X-Ray diffraction patterns of NPs show a cubic- zinc blende phase structure of CdS. It was observed that the three diffraction peaks correspond to the lattice planes of (111), (220) and (311), respectively, suggesting that the contents of Ocimum Tenuiflorum have been incorporated into the CdZnS lattice. The XRD patterns demonstrate that the full width at half height maximum (FWHM) of the diffraction peaks increases with the concentration of extract added which results in the degradation and change in the crystalline size. Based on the FWHM, the average particle sizes of pure CdZnS nanoparticles and Ocimum Tenuiflorum added CdZnS NPs, were calculated using the Debye-Scherrer equation, D=0.9λ/(βcosθ); where λ=0.15418 nm, is the x-ray wavelength provided from a Cu (α) radiation, β is the FWHM in radians and θ is the Bragg’s angle, are 1.3 nm and 1.46 nm respectively.
Particle Size Distribution-Dynamic Light Scattering Method
Dynamic light scattering is a well established technique for calibrating the average size and size distribution of particles in a suspension. The technique has the advantage of being fast and non-invasive, but it does require low particle con- centrations. As well, dynamic light scattering results are often lead to misjudgement if one is uninformed of the state of the sample and the method of data analysis. It measures time- dependent fluctuations in the scattering intensity arising from particles executing random Brownian motion. By analysing these fluctuations pieces of information regarding diffusion coefficient and particle size can be obtained. The fluctuation depends on the diffusion rate, smaller the particle rapid fluctuations take place. The time-dependent fluctuations in the intensity of scattered light were analysed using an autocorrelator that determines the autocorrelation function of the signal. This method has its application in the field of life and material sciences, industrial control processes
etc. The speed of Brownian motion is measured and gives the translational diffusion coefficient D, which can be converted to hydrodynamic diameter (DH) using the Stokes-Einstein equation. DH = kT/3πηD Where k is the Boltzmann constant, T is the temperature and η the dispersant viscosity. The hydrodynamic diameter was calculated for the prepared CdZnS nanoparticle as 24.42 nm and Ocimum Tenuiflorum ( 10 ml and 20 ml ) added CdZnS nanoparticles as 13.78 nm and 14.834 nm respectively.
Morphological Studies
The Scanning Electron Micrograph of CdZnS, Ocimum Tenuiflorum added CdZnS nanoparticles are shown in Figures 2a-2c. From the image obtained, it is found that the prepared nanoparticles have tightly packed surface morphology. The particle size of the prepared nanoparticles was also confirmed using IMAGE J software.
(a) (b)
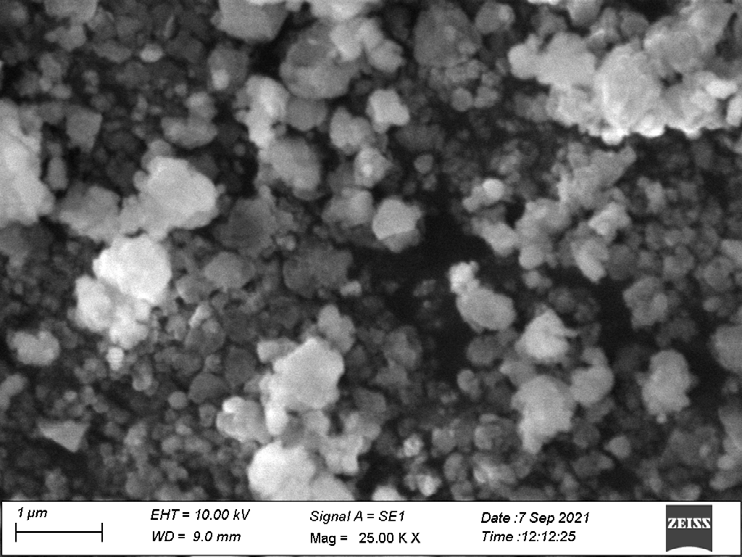
(c) Figure 2: (A) SEM Images for Cdzns, (B) Cdzns Nanoparticles with 10 Ml Of Ocimum Tenuiflorum and (C) Cdzns Nanoparticles with 20 Ml Ocimum Tenuiflorum.
Elemental Studies
The EDAX spectrum was used to confirm the elemental compositions of CdZnS and Ocimum Tenuiflorum added CdZnS nanoparticles. The peaks obtained from the spectrums for CdZnS and Ocimum Tenuiflorum(10 ml,20 ml) added CdZnS nanoparticles are shown in Figures 3a-3c respectively, shows
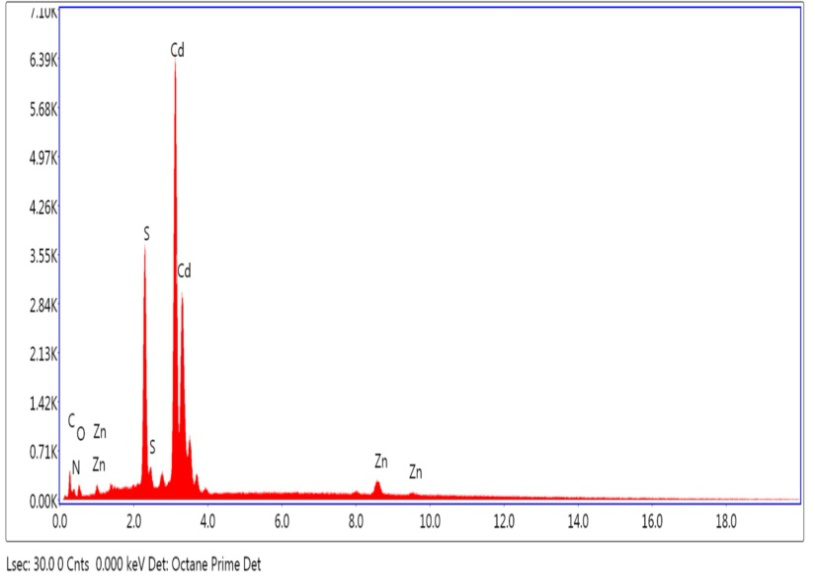
(a) (b) the presence of major elements Cadmium, Zinc and Sulphur in the figure and the presence of carbon, nitrogen and oxygen in figures confirms the presence of Ocimum Tenuiflorum with CdZnS nanoparticles. The elemental composition analysis for CdZnS and Ocimum Tenuiflorum 10ml, 20ml added to CdZnS nanoparticles are shown in Tables 1a-1c respectively.
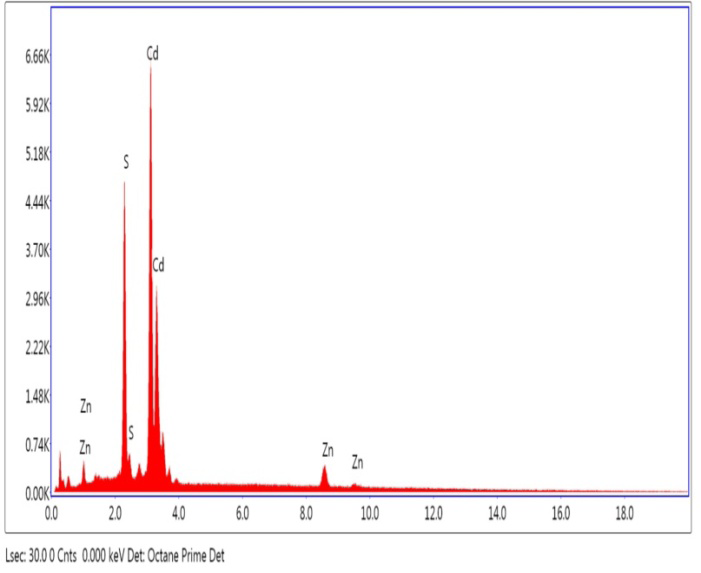
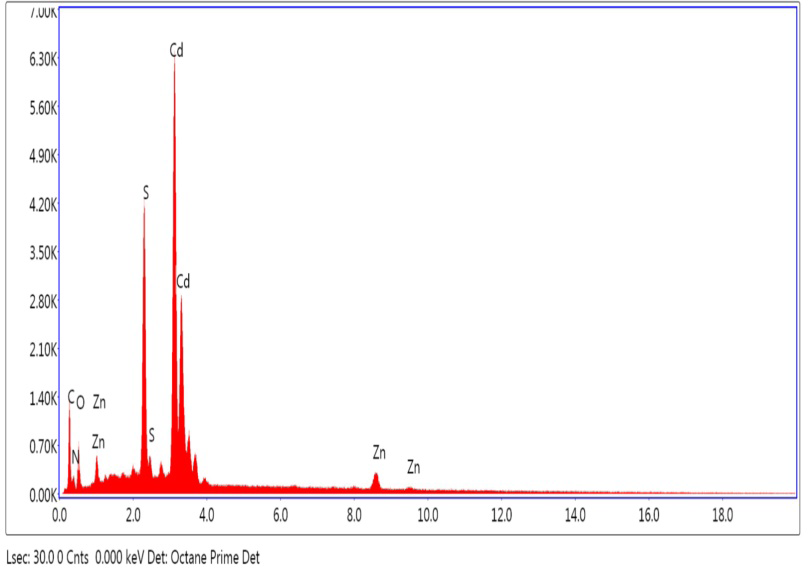
(c) Figure 3: EDAX Spectrum of (A) CdZns Nanoparticles, (B) Ocimum Tenuiflorum (10 Ml) Added CdZns Nanoparticles; (C) Ocimum Tenuiflorum (20 Ml) Added CdZns Nanoparticles.
| Element | Weight % | Atomic% |
|---|---|---|
| Cd | 70.6 | 46.12 |
| Zn | 11.53 | 12.95 |
| S | 17.88 | 40.94 |
Table 1: EDAX Elemental Analysis for (A) CdZns, EDAX Elemental Analysis for (B) CdZns: _Ocimum Tenuiflorum_ 10 Ml and (C) CdZn
| Elements | Weight% of CdZnS: Ocimum Tenuiflorum 10 ml | Atomic % |
|---|---|---|
| Cd | 67.63 | 30.15 |
| Zn | 7.75 | 5.95 |
| S | 13.65 | 21.34 |
| C | 7.32 | 30.56 |
| O | 2.31 | 7.23 |
| N | 1.33 | 4.77 |
Table 2: EDAX Elemental Analysis for (A) CdZns, EDAX Elemental Analysis for (B) CdZns: _Ocimum Tenuiflorum_ 10 Ml and (C) CdZn
(b)
| Elements | Weight% of CdZnS: Ocimum Tenuiflorum 20 ml | Atomic % |
|---|---|---|
| Cd | 51.92 | 14.42 |
| Zn | 5.98 | 2.85 |
| S | 11.99 | 11.68 |
| C | 18.5 | 48.07 |
| O | 10.47 | 20.43 |
| N | 1.15 | 2.55 |
Table 3: EDAX Elemental Analysis for (A) CdZns, EDAX Elemental Analysis for (B) CdZns: _Ocimum Tenuiflorum_ 10 Ml and (C) CdZn
(c) Table 1: EDAX Elemental Analysis for (A) CdZns, EDAX Elemental Analysis for (B) CdZns: Ocimum Tenuiflorum 10 Ml and (C) CdZns: Ocimum Tenuiflorum 20 Ml.
Optical Studies
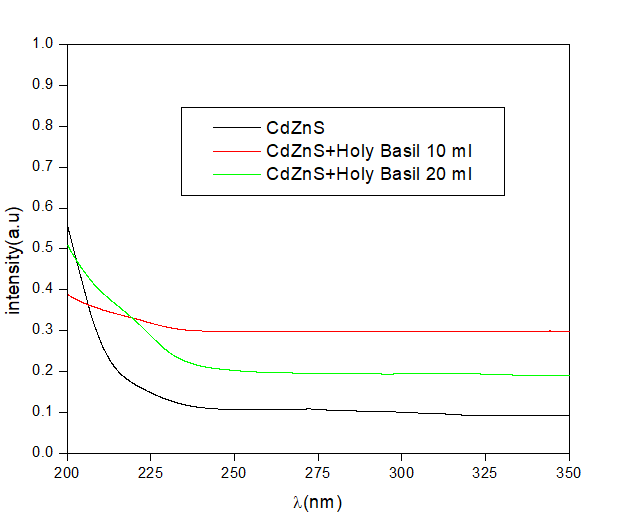
The absorption spectra of CdZnS and Ocimum Tenuiflorum Added CdZnS nanoparticles were measured in the range of 200-800 nm, based on the spectra the optical band gap was obtained by plotting a graph (αhν)2 versus hν using the equation given below.
α = A(hν – Eg)n ,
Where hν is the photon energy, Eg the optical band gap, A the edge parameter and n = ½ for direct gap material.
The absorption spectra for CdZnS and CdZnS added with the extract of Ocimum Tenuiflorum in different concentration is shown in figure 4. The UV- visible absorption spectra shows that the ultraviolet cut-off absorption of Ocimum Tenuiflorum added CdZnS nanoparticles shifts to lower energy ie longer wavelength when compared to pure CdZnS nanoparticles. The absorption edge is found to shift towards longer wavelength ie red shift which means that the band gap decreases.
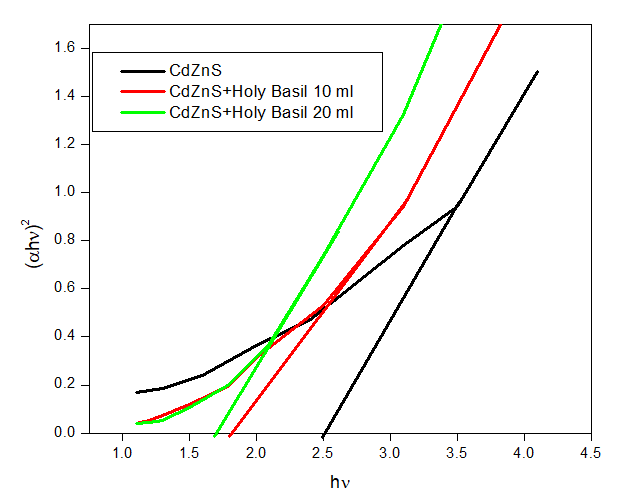
Plot for (αhν) 2 versus hν for CdZnS nanoparticles are shown in Figure 5. The band gap of CdZnS nanoparticles has a band gap of 2.5 eV. The band gap for Ocimum Tenuiflorum added CdZnS nanoparticles found to be decreased by varying concentration. The band gap is found to be 1.5 eV for 10 ml of Ocimum Tenuiflorum and 2 eV for 20 ml of Ocimum Tenuiflorum.
Photocatalytic Activity
When a semiconductor material absorbs light with an energy band gap greater than its own, electrons from the valence band are excited into the conduction band. This phenomenon is called photocatalysis, which was defined by Etacheri V, et al. [5]. Thus, the electron–hole pairs formed as a result of a charge separation can cause free radicals to form in the system. Hydroxyl, a powerful organic material oxidizer, reveals the effects of free radicals. Semiconductor (SC) photocatalysts propose a potential for complete removal of toxic chemicals through their effectiveness and potentially wide applicability, as explained by Khatamian M, et al.; Soltani N, et al. [6, 7] described Photocatalysis is a procedure employed by a SC material to absorb energy equal to or greater than the band gap. It leads to the induction of valence band electrons in the conduction band.
To understand the influence of adding leaf extract over photocatalytic ability, the pure CdZnS and Ocimum Tenuiflorum added CdZnS nanoparticles were tested for photo degradation of methylene blue dye in the presence of UV radiation. At first, the pure CdZnS nanoparticles and extract added CdZnS nanoparticles were distributed separately in
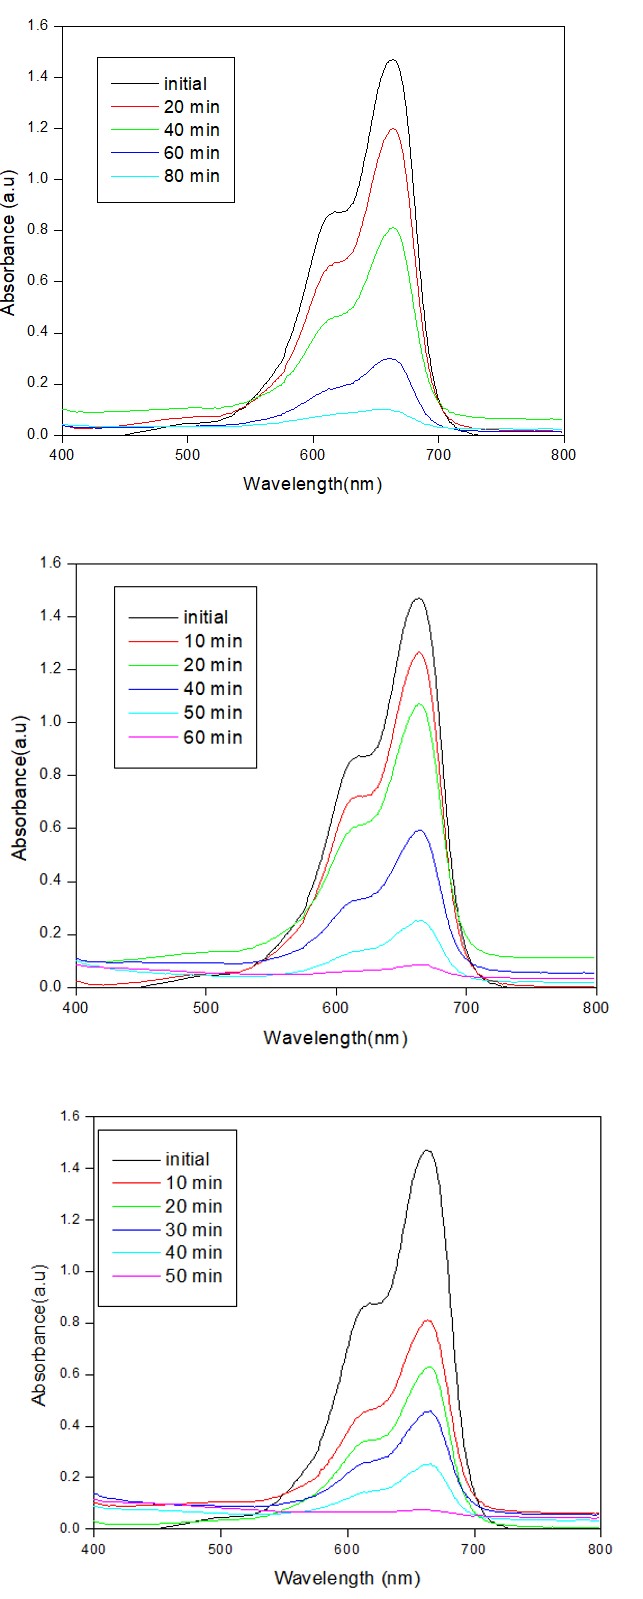
the dye solution and constantly agitated for 1 h in the dark in order to attain the adsorption/desorption equilibrium of dye with the surface of the catalyst. Figure shown below depicts the absorption spectra of methylene blue taken at regular intervals during photocatalysis experiments. Figure 6 is the absorption spectral data presenting photocatalytic degradation of methylene blue by catalysis of a) pure CdZnS, b) 10 ml Ocimum Tenuiflorum added CdZnS nanoparticles and c) 20 ml Ocimum Tenuiflorum added CdZnS nanoparticles.
The complete degradation of methylene blue takes place within 80 minutes for pure CdZnS nanoparticles. Figure 5b shows the photocatalytic degradation of 10 ml Ocimum Tenuiflorum Extract added CdZnS nanoparticles. The photocatalytic activity of 20 ml Ocimum Tenuiflorum added CdZnS nanoparticle is shown in Figure 6c. From the plot it is clear that by adding Ocimum Tenuiflorum the photocatalytic activity of the nanoparticles increased. Also the activity is increased by increasing concentration of extract.
(a) (b)
(c) Figure 6: Absorption Spectral Data Presenting Photocatalytic Degradation of Methylene Blue by Catalysis of (A) Pure CdZns, (B) 10 Ml of Ocimum Tenuiflorum Extract Added CdZns Nanoparticles and (C) 20 Ml of Ocimum Tenuiflorum Extract Added CdZns Nanoparticles.
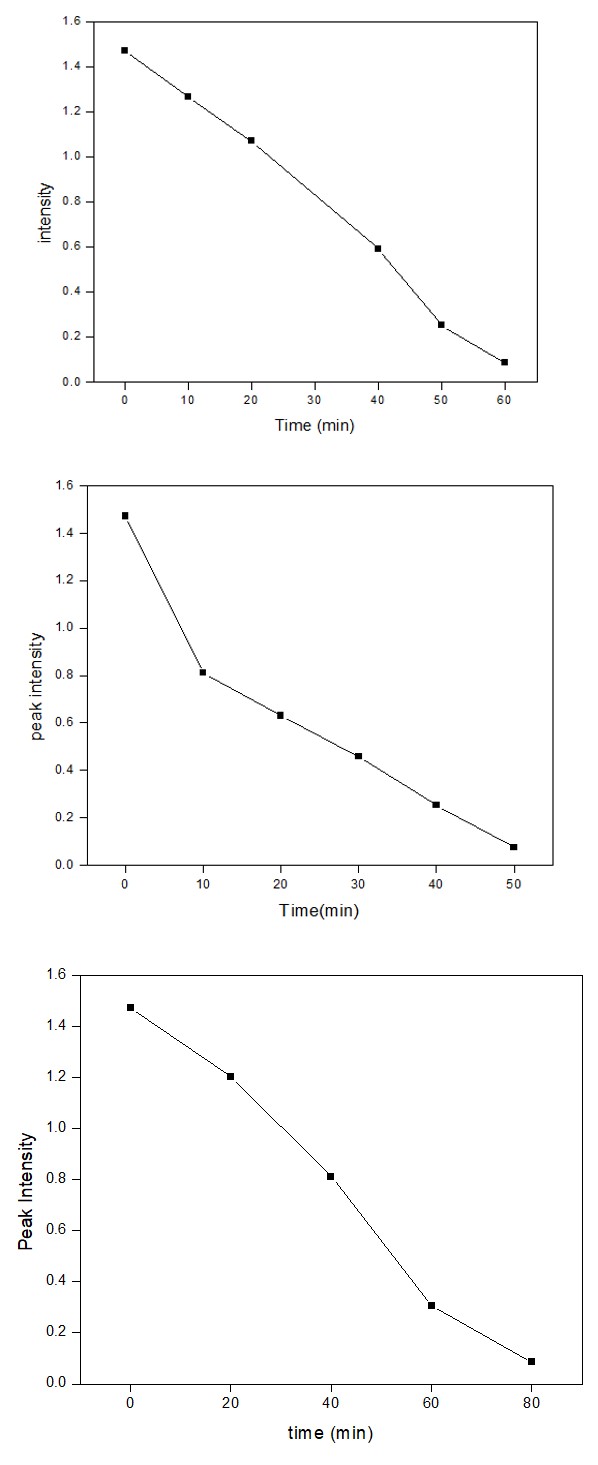
| Time | Peak intensity |
|---|---|
| 0 | 1.472 |
| 20 | 1.2007 |
| 40 | 0.812 |
| 60 | 0.307 |
| 80 | 0.085 |
Table 4: Shows the Variation of Peak Intensity with Time for (A) Pure CdZns, (B) 10 Ml Of _Ocimum Tenuiflorum_ Extract Added CdZn
| Time | Peak intensity |
|---|---|
| 0 | 1.4722 |
| 10 | 1.26567 |
| 20 | 1.0707 |
| 40 | 0.5933 |
| 50 | 0.2527 |
| 60 | 0.08509 |
Table 5: Shows the Variation of Peak Intensity with Time for (A) Pure CdZns, (B) 10 Ml Of _Ocimum Tenuiflorum_ Extract Added CdZn
| Time | Peak intensity |
|---|---|
| 0 | 1.4722 |
| 10 | 0.812 |
| 20 | 0.6297 |
| 30 | 0.4584 |
| 40 | 0.2526 |
| 50 | 0.0754 |
Table 6: Shows the Variation of Peak Intensity with Time for (A) Pure CdZns, (B) 10 Ml Of _Ocimum Tenuiflorum_ Extract Added CdZn
(a)
(b)
(c) Figure 7: The Plot for Time Versus Peak Intensity for (A) Pure CdZns, (B) 10 Ml of Ocimum Tenuiflorum Extract Added CdZns Nanoparticles and (C) 20 Ml of Ocimum Tenuiflorum Extract Added CdZns Nanoparticles.
From the graph it is clear that peak intensity decreases with time ie degradation takes place. The degradation time is varient for the three nanoparticles.
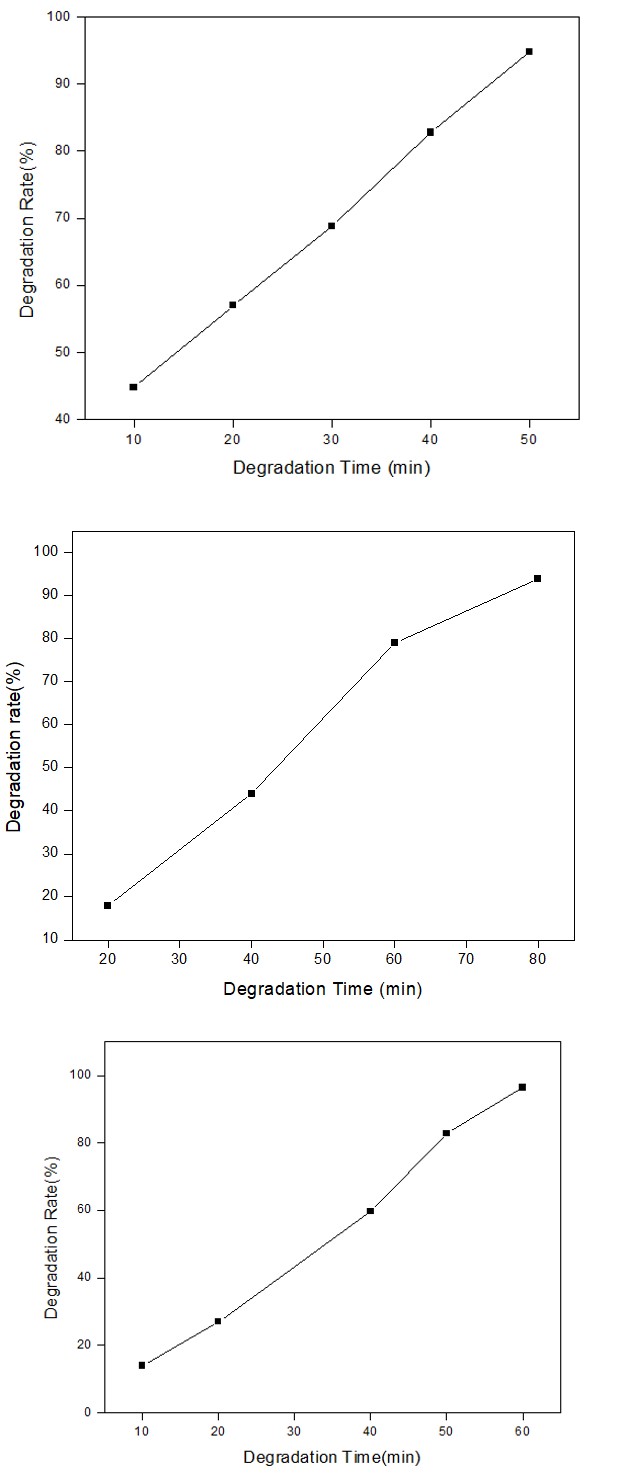
| Time | Percentage of degradation |
|---|---|
| 20 | 18 |
| 40 | 14 |
| 60 | 79 |
| 80 | 94 |
| Time | Percentage of degradation |
|---|---|
| 10 | 14 |
| 20 | 27 |
| 40 | 59.6 |
| 50 | 82.8 |
| 60 | 96.4 |
| 10 | 44.8 |
| 20 | 57 |
| 30 | 68.8 |
| 40 | 82.83 |
| 50 | 94.8 |
(a)
(b)
(c) Figure 8: Plot for Percentage of Degradation for (A) Pure CdZns, (B) 10 Ml of Ocimum Tenuiflorum Extract Added CdZns Nanoparticles and (C) 20 Ml of Ocimum Tenuiflorum Extract Added CdZns Nanoparticles.
A graph is drawn between time and rate of degradation shown in Figures 8a-8c for pure CdZnS nanoparticles, 10 ml of Ocimum Tenuiflorum extract added CdZnS nanoparticles and 20 ml of Ocimum Tenuiflorum extract added CdZnS nanoparticles respectively. From the graphs it is clear that the pure CdZnS nanoparticles undergo 94% of degradation in 80 minutes whereas 10 ml thulsi exract added CdZnS nanoparticles undergo 96.4% of degradation in 60 mins and for 20 ml thulsi extract added CdZnS nanoparticles, with in the time of 50 minutes 94.9% of degradation takes place. Thus by adding extract the degradation rate is increased also as the concetration of extract increased the degradation rate is also increased [8, 9, 10, 11, 12, 13, 14].
Conclusion
CdZnS: Ocimum Tenuiflorum with two different concentrations were prepared using chemical precipitation method. The structural and morphological properties of CdZnS and CdZnS with Ocimum Tenuiflorum NPs, were investigated. Study (XRD) on the structural properties showed that CdZnS and Ocimum Tenuiflorum: CdZnS NPs have cubic (zinc blende) structure and the particle size of CdZnS NPs added with Ocimum Tenuiflorum becomes greater than CdZnS NPs. EDAX spectra reveals the existence of major chemical element. SEM study confirms the particle size and the morphology of the prepared nanoparticles. The UV- visible absorption spectra shows that the ultraviolet cut-off absorption of Ocimum Tenuiflorum added CdZnS nanoparticles shifts to lower energy. The band gap for Ocimum Tenuiflorum added CdZnS nanoparticles found to be decreased by varying concentration. The hydrodynamic diameter was calculated for the prepared CdZnS nanoparticle as 24.42 nm and Ocimum Tenuiflorum ( 10 ml and 20 ml ) added CdZnS nanoparticles as 13.78 nm and 14.834 nm respectively. Photocatalytic activity of methylene blue dye is increased by adding extract of Ocimum Tenuiflorum and rate of degradation is increased by increasing the concentration of extract.
References
-
Jain S, Mehata MS (2017) Medicinal Plant Leaf Extract and Pure Flavonoid Mediated Green Synthesis of Silver Nanoparticles and their Enhanced Antibacterial Property. Scientific Reports 7(1): 15867.
-
Usha S, Ramappa KT, Hiregoudar S, Vasanthkumar GD, Aswathanarayana DS (2017) Biosynthesis and Characterization of Copper Nanoparticles from Tulasi (_Ocimum sanctum_ L.) Leaves. International Journal of Current Microbiology and Applied Sciences 6(11): 2219- 2228.
-
Dang R, Ma X (2017) CdS nanoparticles decorated anatase TiO2 nanofibers with enhanced visible light photocatalytic activity for dye degradation. Journal of Materials Science: Materials in Electronics. 28: 8818- 8823.
-
Gautam PK, Kumar S, Tomar MS, Singh RK, Acharya A, et al. (2017) Biologically Synthesized Gold Nanoparticles using Ocimum sanctum (Tulsi Leaf Extract) Induced Anti-Tumor Response in a T Cell Daltons Lymphoma. Journal of Cell Science & Therapy 8(6): 1-12.
-
Etacheri V, Valentin CD, Schneider J, Bahnemann DW, Pillai SC (2015) Visible-light activation of TiO2 photocatalysts: Advances in theory and experiments. Journal of Photochemistry and Photobiology C: Photochemistry Reviews 25: 1-29.
-
Khatamian M, Fazayeli M, Divband B (2014) Preparation, characterization and photocatalytic properties of polythiophene-sensitized zinc oxide hybrid nanocomposites. Materials Science in Semiconductor Processing, 26: 540-547.
-
Soltani N, Saion E, Hussein MZ, Erfani M, Abedini A, et al. (2012) Visible Light-Induced Degradation of Methylene Blue in the Presence of Photocatalytic ZnS and CdS Nanoparticles. Int J Mol Sci 13(10): 12242-12258.
-
Doli J, Rajurkar SK (2019) Chemical Composition of Methanolic Extract of Tulsi Leaves Ocimumsantum L. International Journal of Research and Scientific Innovation 6(1): 113-114.
-
IL Ikhioya, NJ Jonah, OR Okanigbuan (2017) Niger Ann Nat Sci.
-
Salem JK, Hammad TM, Kuhn S, Draaz MA, Hejazy NK, et al. (2014) Structural and optical properties of Co-doped ZnS nanoparticles synthesized by a capping agent. Journal of Materials Science: Materials in Electronics 25: 2177-2182.
-
Subba Rao Y, Kotakadi VS, Prasad TNVKV, Reddy AV, Sai Gopal DVR (2013) Green synthesis and spectral characterization of silver nanoparticles from Lakshmi tulasi (Ocimum sanctum) leaf extract. Spectrochimica Acta Part A: Molecular and Biomolecular Spectroscopy 103: 156-159.
-
Xing C, Zhang Y, Yan W, Guo L (2006) Band structure- controlled solid solution of CD1-X Znx S photocatalyst for hydrogen production by water splitting. International Journal of Hydrogen energy 31(14): 2018-2024.
-
Acar C, Dincer I, Zaimfirescu C (2014) A review on selected heterogeneous photocatalysts for hydrogen production. International Journal of Energy Research 38(15): 1903-1920.
-
Upadhyaya H, Shome S, Sarma R, Tewari S, Bhattacharya MK, et al. (2018) Green Synthesis, Characterization and Antibacterial Activity of ZnO Nanoparticles. American Journal of Plant Sciences 9(6): 1279-1291.
- Solution-Processed Chiral Perovskites for Biomedical Applications
- Nanotechnology in Health Chemistry and Medicine: Current Challenges and Future Directions
- Human Exposure to Micro- and Nanoplastics: Pathways, Toxicity, and Intervention Strategies
- Exosome Nanomedicine for Cancer Therapy
- Micro and Nanoplastics–Plastisphere, Biotoxicity, Impact on Human Health, and Mitigation Strategies
- Process Validation of Cefixime Powder for Suspension Dosage Form, 50 mL