Formulation and Evaluation of Polymeric Nanoparticles of Itraconazole for Antifungal Therapy
The primary objective of this work was to create and evaluate Itraconazole-loaded nanoparticles using the ionic gelation process to improve their solubility and bioavailability. Ionic gelation was used to prepare Itraconazole nanoparticles, which are classified as a BCS class II drug. These particles were then characterized using techniques such as Fourier transform infrared spectroscopy, differential scanning Calorimetry, powder X-ray diffraction, scanning electron microscopy, zeta potential, and in-vitro drug release studies. There was no evidence of contact between the drug and the polymers based on the differential scanning Calorimetry results, powder X-ray diffractometry, and Fourier transforms infrared spectroscopy. Nano particulate formulation prepared with Chitosan in 1:6 ratio showed satisfactory results i.e. average particle size 201.67 nm, polydispersity index 0.111, zeta potential -46.2 mV, and entrapment efficiency 89.04%. FTIR study concluded that no major interaction occurred between the drug and polymers used in the present study. This technology on a laboratory scale and this strategy could be used to improve the solubility and bioavailability of BCS class II medications.
Introduction
Nanotechnology is the field of investigation since last century, Nanotechnology was first introduced by Nobel laureate Richarard P.Feynmen in his lecture of “There’s plenty of room at the bottom”. Then, there have been different advancements within the field of nanotechnology is made. The development of Nanotechnologies is important in terms of diagnosis, treatment, and prevention of disease [1]. The word nanoparticles come from the Greek word nanus which means dwarf or very small. Nanoparticles (NPs) are the novel invention of modern science in which drug is surrounded by a polymeric membrane where the drugs are dissolved, entrapped, adsorbed, attached and/or encapsulated into or onto a Nano-particulate matrix. The drug delivery vehicles are generally < 100 nm in size with at least one dimension and consist of different biodegradable materials such as natural or synthetic polymers, lipids, or metals. It is composed of three layers i.e. (a) the surface layer, which can be functionalized with a variety of little molecules, metal ions, surfactants, and polymers. (b) The shell layer, which is with chemicals completely different material from the core in all aspects, and (c) The core, that is the central portion of the NPs1.
Several polymers are being utilized for the fabrication of nanoparticles. Macromolecules include peptides and protein can be easily and effectively deliver through the Nano delivery system. Nanoparticles deliver the drug at a controlled and sustained rate to the site of action [2].
Mechanisms of Drug Release
The drug from the polymeric drug carriers deliver at the site of the tissue by anyone of the three general physico- chemical mechanisms which are explained below:
- By hydration which causes the swelling of the polymer nanoparticles followed by release through diffusion.
- By an enzymatic reaction that leads to rupture or degradation or cleavage of the polymer at the site of delivery and results in the release of the drug from the entrapped inner core.
- Dissociation of the drug from the polymer and it does de- adsorption/release from the swelled nanoparticles
Methodology
Analytical Method Development
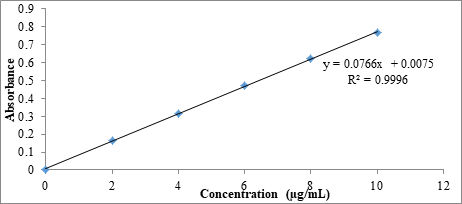
Determination of Absorption Maxima: Absorption maxima are the wavelength at which maximum absorption takes place. For accurate analytical work, it is important to determine the absorption maxima of the substance under study [3]. Procedure: For the preparation of calibration curve stock solution was prepared by dissolving 100 mg of accurately weighed drug in 100ml of methanol (1mg/ml). Further 1ml of the stock solution was pipette out into a 100 ml volumetric flask and volume was made up with phosphate buffer (5.5pH). From this stock solution pipette out 1ml and dilute to 10 ml with phosphate buffer and subject for UV scanning in the range of 200-400 nm using double beam UV spectrophotometer. The absorption maxima were obtained at 260 nm with a characteristic peak. Preparation of Calibration Curve: It is soluble in Methanol; hence Methanol was used for solubilizing the drug. Stock solution (1 mg/mL) of Itraconazole was prepared in Dichloromethane and subsequent working standards (2, 4, 6, 8 and 10 mg/mL) were prepared by dilution with phosphate buffer of pH-5.5. These solutions were used for the estimation Itraconazole by UV method. The whole procedure was repeated three times and average peak area was calculated. Calibration plot was drawn between concentrations and peak area. Calibration equation and R2 value are reported.
Preparation of nanoparticles
Preparation of Itraconazole loaded nanoparticles: Chitosan was dissolved in aqueous solution of acetic acid (2%) in 50 ml of distilled water. Under magnetic stirring at room temperature, tween 80 was add above solution and 10 ml of (w/v) solution was added drop wise using syringe needle into 100 ml Chitosan solution containing respective mg of Itraconazole. The stirring was continued for about 2.30 hrs [4]. The resultant nanoparticles suspensions were centrifuged at 12000 × g for 15 minutes using C24 centrifuge. Samples were washed with water and dried. The formation of the particles was a result of the interaction between the negative groups of the TPP and the positively charged amino groups of chitosan (ionic gelation) (Table 1).
| Formulation | Itraconazole (mg) | Chitosan (mg) | Tween 80 | Acetic | Methanol | Water |
|---|---|---|---|---|---|---|
| (mL) | Acid (%) | (mL) | ||||
| F1 | 200 | 100 | 0.2 | 2 | 25 | 50 |
| F2 | 200 | 150 | 0.3 | 2 | 25 | 50 |
| F3 | 200 | 200 | 0.4 | 2 | 25 | 50 |
| F4 | 200 | 250 | 0.5 | 2 | 25 | 50 |
| F5 | 200 | 300 | 0.6 | 2 | 25 | 50 |
| F6 | 200 | 350 | 0.7 | 2 | 25 | 50 |
| F7 | 200 | 400 | 0.8 | 2 | 25 | 50 |
| F8 | 200 | 450 | 0.9 | 2 | 25 | 50 |
| F9 | 200 | 500 | 1 | 2 | 25 | 50 |
| F10 | 200 | 550 | 2 | 2 | 25 | 50 |
| F11 | 200 | 600 | 3 | 2 | 25 | 50 |
| F12 | 200 | 650 | 4 | 2 | 25 | 50 |
Table 1: Calibration curve of Itraconazole in phosphate buffer pH 5.5.
Table1: Composition of nanoparticles formulations (F1 to F12).
In Vitro Release Studies
Drug release was determined by dialysis method; two ml of each formulation (test and control) were poured into dialysis bags and put into 25 ml phosphate buffer (pH 6.8) and stirred (100 rpm, room temperature). At predetermined time intervals, 2 ml of phosphate buffer was taken and then substituted by fresh phosphate buffer. Finally, the amounts of released Simvastatin in phosphate buffer were measured by spectrophotometer at 235 nm. Aliquots withdrawn were assayed at each time interval for the drug released at λ max of 235 nm using UV‐Visible [5].
Spectrophotometer by keeping phosphate buffer pH 6.8 as blank and the amount of released drug was estimated by the standard curve.
Results and Discussion
Calibration Plot of Itraconazole Phosphate Buffer of Ph -5.5
A standard graph of Itraconazole in phosphate buffer of pH-5.5 was plotted using Absorbance and concentration as shown in Tables 2-5 and Figures 1 & 2. Equation for linearity curve and R2 were calculated as Y=0.076X+0.007 and R2 =0.999. Itraconazole showed maximum absorbance in phosphate buffer (pH 5.5) at 260 nm. The solution obeyed Beer-Lambert’s law for concentration range of 2 to 10μg/ mL with regression coefficient of 0.999. Standard curve of prepared Itraconazole in phosphate buffer pH 5.5 is shown below [6].
| Concentration(µg/mL) | Absorbance |
|---|---|
| 0 | 0 |
| 2 | 0.167 |
| 4 | 0.314 |
| 6 | 0.472 |
| 8 | 0.621 |
| 10 | 0.768 |
Table 2: Calibration curve of Itraconazole in phosphate buffer pH 5.5.
Characterization of Nanoparticles
| Formulation | Percentage yield | Drug Content | Entrapment Efficiency |
|---|---|---|---|
| F1 | 87.03 | 97.11 | 78.92 |
| F2 | 92.78 | 98.31 | 83.6 |
| F3 | 93.14 | 97.92 | 89.03 |
| F4 | 96.21 | 98.34 | 82.14 |
| F5 | 96.8 | 97.08 | 73.98 |
| F6 | 97.14 | 98.14 | 89.04 |
| F7 | 95.89 | 96.32 | 76.92 |
| F8 | 93.67 | 95.14 | 81.02 |
| F9 | 81.28 | 97.36 | 83.01 |
| F10 | 76.79 | 94.01 | 75 |
| F11 | 73.1 | 97.55 | 76.31 |
| F12 | 70.05 | 97.9 | 72.95 |
Table 3: Percentage yield, Drug Content, Entrapment Efficiency of all nanoparticles formulations.
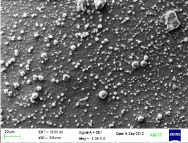
SEM studies showed that the Itraconazole - loaded nanoparticles had a spherical shape with a smooth surface as shown in Figure 3 & 4.
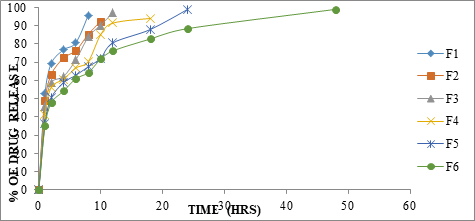
| Time (hour) | F1 | F2 | F3 | F4 | F5 | F6 |
|---|---|---|---|---|---|---|
| 0 | 0 | 0 | 0 | 0 | 0 | 0 |
| 1 | 52.62 | 48.87 | 45.62 | 41.38 | 36.23 | 34.97 |
| 2 | 69.25 | 63.17 | 58.81 | 56.14 | 50.38 | 47.65 |
| 4 | 76.82 | 72.35 | 62.2 | 60.63 | 58.79 | 54.16 |
| 6 | 80.71 | 76.38 | 71.39 | 66.82 | 62.88 | 60.98 |
| 8 | 95.82 | 85.38 | 83.85 | 70.4 | 67.54 | 64.29 |
| 10 | 92.39 | 90.34 | 85.09 | 72.17 | 71.73 | |
| 12 | 97.13 | 91.46 | 80.62 | 76.22 | ||
| 18 | 94.02 | 87.93 | 82.73 | |||
| 24 | 98.87 | 88.4 | ||||
| 48 | 99.01 |
Table 4: In vitro dissolution studies of F1-F6 nanoparticles formulations in percentage.
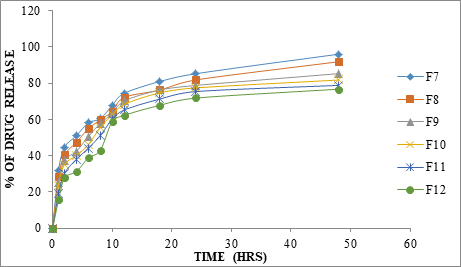
| Time (hour) | F7 | F8 | F9 | F10 | F11 | F12 |
|---|---|---|---|---|---|---|
| 0 | 0 | 0 | 0 | 0 | 0 | 0 |
| 1 | 31.97 | 28.31 | 25.22 | 23.49 | 19.07 | 15.59 |
| 2 | 44.65 | 40.38 | 37.38 | 35.21 | 30.31 | 27.75 |
| 4 | 51.08 | 47.43 | 42.45 | 40.07 | 38.03 | 31.22 |
| 6 | 58.12 | 54.86 | 50.59 | 46.17 | 44.12 | 38.76 |
| 8 | 60.39 | 59.75 | 57.83 | 55.56 | 51.13 | 42.91 |
| 10 | 67.81 | 64.46 | 63.26 | 62.58 | 60.09 | 58.85 |
| 12 | 74.37 | 72.13 | 70.15 | 68.27 | 65.17 | 62.24 |
| 18 | 80.95 | 76.16 | 76.29 | 74.68 | 71.24 | 67.83 |
| 24 | 85.2 | 81.77 | 78.76 | 77.37 | 75.36 | 71.76 |
| 48 | 96.01 | 91.85 | 85.27 | 81.77 | 78.81 | 76.7 |
Table 5: In vitro dissolution studies of F7-F12 nanoparticles formulations in percentage.
Release Kinetics
To analyze the drug release mechanism the in vitro release was fitted into various release equations and kinetic models first order, zero order, Higuchi and Korsmeyer- peppas. The release kinetics of optimized formulation F6 (Chitosan) is shown in Table 6 and in following Figures 5-8.
| CUMULATIVE (%) RELEASE Q | TIME ( T ) | ROOT (T) | LOG( %) RELEASE | LOG ( T ) | LOG (%) REMAIN | RELEASE RATE (CUMULATIVE % RELEASE / t) | 1/CUM% RELEASE | PEPPAS log Q/100 | % Drug Remaining | Q01/3 | Qt1/3 | Q01/3- Qt1/3 |
|---|---|---|---|---|---|---|---|---|---|---|---|---|
| 0 | 0 | 0 | 2 | 100 | 4.642 | 4.642 | 0 | |||||
| 34.97 | 1 | 1 | 1.544 | 0 | 1.813 | 34.97 | 0.0286 | -0.456 | 65.03 | 4.642 | 4.021 | 0.62 |
| 47.65 | 2 | 1.414 | 1.678 | 0.301 | 1.719 | 23.825 | 0.021 | -0.322 | 52.35 | 4.642 | 3.741 | 0.901 |
| 54.16 | 4 | 2 | 1.734 | 0.602 | 1.661 | 13.54 | 0.0185 | -0.266 | 45.84 | 4.642 | 3.579 | 1.063 |
| 60.98 | 6 | 2.449 | 1.785 | 0.778 | 1.591 | 10.163 | 0.0164 | -0.215 | 39.02 | 4.642 | 3.392 | 1.25 |
| 64.29 | 8 | 2.828 | 1.808 | 0.903 | 1.553 | 8.036 | 0.0156 | -0.192 | 35.71 | 4.642 | 3.293 | 1.349 |
| 71.73 | 10 | 3.162 | 1.856 | 1 | 1.451 | 7.173 | 0.0139 | -0.144 | 28.27 | 4.642 | 3.046 | 1.595 |
| 76.22 | 12 | 3.464 | 1.882 | 1.079 | 1.376 | 6.352 | 0.0131 | -0.118 | 23.78 | 4.642 | 2.876 | 1.766 |
| 82.73 | 18 | 4.243 | 1.918 | 1.255 | 1.237 | 4.596 | 0.0121 | -0.082 | 17.27 | 4.642 | 2.585 | 2.057 |
| 88.4 | 24 | 4.899 | 1.946 | 1.38 | 1.064 | 3.683 | 0.0113 | -0.054 | 11.6 | 4.642 | 2.264 | 2.378 |
| 99.01 | 48 | 6.928 | 1.996 | 1.681 | -0.004 | 2.063 | 0.0101 | -0.004 | 0.99 | 4.642 | 0.997 | 3.645 |
Table 6: Release kinetics of optimised formulation.
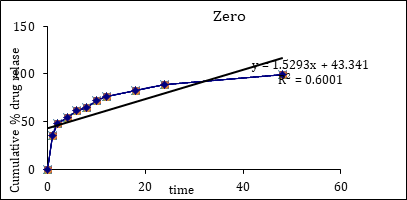
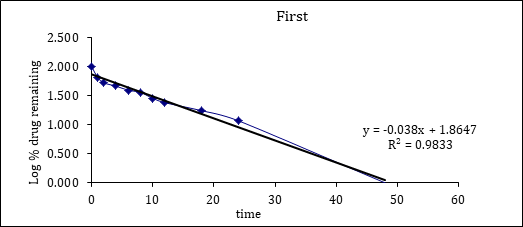
The prepared F6 optimised Chitosan nanoparticles were subjected to the drug release kinetics and release mechanism [7, 8, 9]. The formulations were studied by fitting the drug release time profile with the various equations such as Zero order, First order, Higuchi and Korsmeyer pappas. The optimised formulation F6 optimised Chitosan a Nanoparticle was analyzed for the drug release mechanism. The best correlation coefficient value (0.983) indicates the best release mechanism (First order).
FTIR
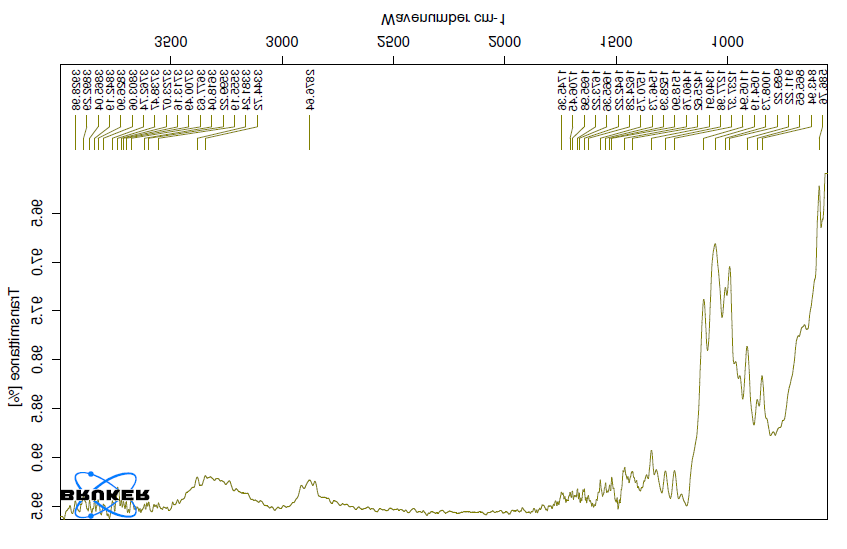
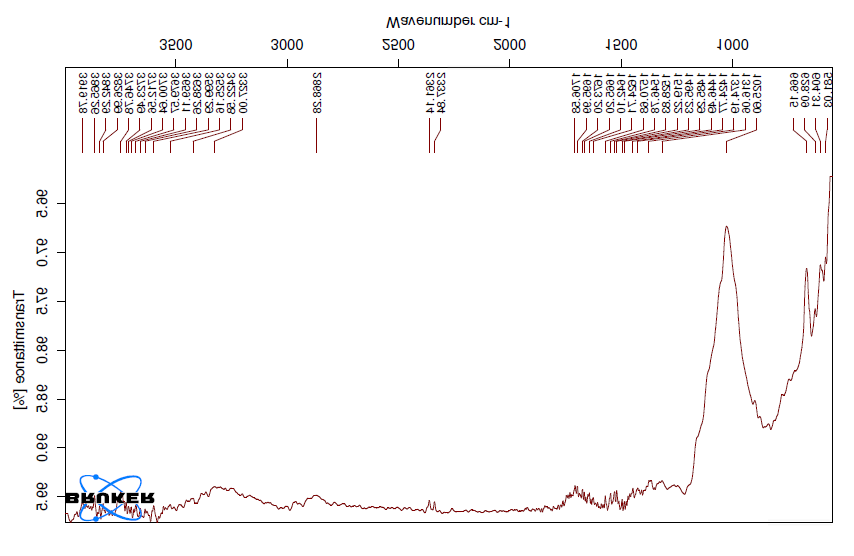
Infrared studies were carried out to confirm the compatibility between the polymer, drug, and selected excipients. From the spectra it was observed that there was no major shifting, as well as, no loss of functional peaks between the spectra of the drug and drug-loaded nanoparticles. This indicated no interaction between the drug and other excipients [10].
Conclusion
The nanoparticles were prepared by ionic gelation method by varying concentration of polymer such as Chitosan and surfactant (Tween 80). The nanoparticles were characterized by particle size, entrapment efficiency, drug loading and in-vitro drug release studies [11, 12]. The effect of variables like polymer concentration (Chitosan) and surfactant concentration (Tween 80) on particle size, entrapment efficiency and drug loading were investigated. The particle size was found to be in the range of 201.97 to 298.34 nm. The entrapment efficiency and drug loading were found to be in the range of 72.95- 89.04 % and 94.01- 98.34 % respectively. Formulation F6, which contained Chitosan in a ratio of 1:6 drug to polymer, demonstrated good results among the several nan particulate formulations that were created using the ionic gelation process. The FT- IR investigation concluded that there was no significant interaction between the medication and the polymers that were used in this study. Therefore, the approach used to address the poor solubility and bioavailability of the medicine Itraconazole nanoparticles was successful.
Acknowledgement
We express our deepest gratitude to the Management of Vision College of Pharmaceutical Sciences and Research for timely help and co-operation to the pillars of the research work.
References
-
Khan I, Saeed K, Khan I (2019) Nanoparticles: Properties, applications and toxicities. Arabian Journal of Chemistry 12(7): 908-931.
-
Mahmoodi NO, Ghavidast A, Amirmahani N (2016) A comparative study on the nanoparticles for improved drug delivery systems. Journal of Photochemistry and Photobiology B: Biology 162: 681-693.
-
De Jong WH, Borm PJ (2008) Drug delivery and nanoparticles: applications and hazards. International journal of nanomedicine 3(2): 133-149.
-
Biswas E, Banerjee KK, Karmakar S, Karmakar S, Pal TK (2022) Preparation and Evaluation of Eprosartan Mesylate loaded PLGA Nanostructures. Research J Pharm and Tech 15(1): 103-112.
-
Priya CM, Venkata Ramana M, Rama Rao M (2021) Formulation and Evaluation of Valsartan Solid Lipid Nanoparticles. Journal of Drug Delivery & Therapeutics 11(2): 103-108.
-
Zolfagharnia B, Mortazavian E, Kaviani D, Rafiee Tehrani M (2017) Preparation and evaluation of nanoparticles composed of thiolated methylated pyridinyl chitosan as a new strategy for bucal drug delivery of insulin. Nanomed J 4(2): 83-88.
-
Kesharwani R, Sachan A, Singh S, Patel D (2016) Formulation and Evaluation of Solid Lipid Nanoparticle (SLN) Based Topical Gel of Etoricoxib. Journal of Applied Pharmaceutical Science 6 (10): 124-131.
-
Salve P, Pise S, Bali N (2016) Formulation and Evaluation of Solid Lipid Nanoparticle Based Transdermal Drug Delivery System for Alzheimer’s disease. Research Journal of Pharmaceutical Dosage Forms and Technology 8(2).
-
Nagarajana E, Shanmugasundarama P, Ravichandirana V, Vijayalakshmia A, Senthilnathanb B, et al. (2015) Development and Evaluation of Chitosan Based Polymeric Nanoparticles of an Antiulcer Drug Lansoprazole. Journal of Applied Pharmaceutical Science 5(04): 20-25.
-
Lombardo D, Kiselev MA, Caccamo MT (019) Smart nanoparticles for drug delivery application: development of versatile nanocarrier platforms in biotechnology and nanomedicine. Journal of Nanomaterials 2019.
-
Tiruwa R (2016) A review on nanoparticles–preparation and evaluation parameters. Indian Journal of Pharmaceutical and Biological Research 4(2): 27-31.
-
Mohanraj VJ, Chen Y (2006) Nanoparticles-a review. Tropical journal of pharmaceutical research 5(1): 561- 573.
- Solution-Processed Chiral Perovskites for Biomedical Applications
- Nanotechnology in Health Chemistry and Medicine: Current Challenges and Future Directions
- Human Exposure to Micro- and Nanoplastics: Pathways, Toxicity, and Intervention Strategies
- Exosome Nanomedicine for Cancer Therapy
- Micro and Nanoplastics–Plastisphere, Biotoxicity, Impact on Human Health, and Mitigation Strategies
- Process Validation of Cefixime Powder for Suspension Dosage Form, 50 mL