Design and Evaluation of Solid Lipid Nanoparticle Loaded Transdermal Patch of Nisoldipine: In Vitro, Ex Vivo and In Vivo Evaluation
The objective of the research work is to develop and evaluate the solid lipid nanoparticles (SLNs) loaded matrix type transdermal patch of Nisoldipine (NSD). SLN formulations were developed and evaluated for particle size, zeta potential, polydispersibility index, drug content, entrapment efficiency then optimized formulation was freeze dried and incorporated into a transdermal patch. The physicochemical interaction between Nisoldipine and polymer was examined by DSC (differential scanning calorimetry) and FTIR (Fourier Transform Infrared Spectroscopy). Prepared patches were measured for thickness, uniformity of weight, folding endurance, moisture content, moisture absorption. The in-vitro and ex-vivo permeation of the Nisoldipine of the patches was studied by Franz diffusion cells. In vivo bioavailability study was performed using male wistar rats for optimized formulation N6 and compared with reference tablet (Sular). Dynasan 114 lipid (N-D4, formulation) is found to produce SLNs with low size and high entrapment efficiency. SEM analysis showed non aggregated spherical particles. N6(Formulation) patch containing 8% citral showed 96.5% of drug release and higher flux with 2.17 enhancement ratio (ER). Relative bioavailability of the test formulation with respect to market formulation was considered to be 2.52. The SLN loaded transdermal patches of Nisoldipine were developed successfully. There was considerable increase in bioavailability of the test formulation (N6) when compared to the marketed formulation. The increase may be attributed to avoidance of first pass metabolism of Nisoldipine which occurs through oral administration.
Introduction
Transdermal therapeutic system are defined as ‘self- contained’ discrete dosage forms which, when applied to the intact skin, deliver the drug(s), through the skin, at a controlled rate to the systemic circulation [1]. Transdermal drug delivery systems, also knew as “patches” offers a full range of benefits such as a painless and simple application, ability to avoid problems of gastric irritation, avoid hepatic first-pass metabolism thereby increasing the bioavailability of drug, pH and emptying rate effects, reduce the risk of systemic side effects by minimizing plasma concentrations compared to oral therapy, rapid termination of therapy by removal of the device or formulation, provide a sustained release of drug at the site of application; the reduction of fluctuations in plasma levels of drugs, and avoid pain associated with injections [2]. Human skin mainly the stratum corneum acts as a barrier to avoid the entry of foreign substances which is the major difficulty in achieving transport of therapeutic agents across. Different approaches of penetration enhancement have been applied so far to improve permeation of drugs through the skin. The widely used approach for improving transdermal drug delivery uses penetration enhancers (also called sorption promoters) but has a lot of problem of skin irritation and toxicity. Newer approaches include the use of carriers/vesicles such as liposomes, niosomes, ethosomes, microemulsions and complexes, which provide a good alternative technique to enhance permeation of drugs
Materials
across stratum corneum. Enhancement of transdermal drug permeation of theophylline using microemulsion, Ketorolac using proniosomes and Ketotifen using ethosomes have been reported. Solid lipid nanoparticles (SLNs) have also been investigated as carriers for enhanced skin delivery of Vitamins A and E. Permeation enhancement is primarily due to small size and swelling of stratum corneum by increase in skin hydration caused by the occlusive film of SLN [3].
Nisoldipine, an antihypertensive agent, because of its low bioavailability (5%) due to first pass metabolism and shorter biological t½ (7-12 h) with log P (Partition coefficient) of 3.2 and low dose (8.5-40 mg) is a suitable drug to formulate into transdermal formulation [4].
| Materials | Source |
|---|---|
| Nisoldipine | Yarrow Chem. Ltd. Mumbai |
| Felodipine | Yarrow Chem. Ltd. Mumbai |
| Dynasan 114, 116, 118 | Himedia, Mumbai, India |
| Soya lecithin | Himedia, Mumbai, India |
| Trehalose | Himedia, Mumbai, India |
| Cholesterol | S.D. Fine Chem. Ltd, India |
| Glyceryl monostearate | S.D. Fine Chem. Ltd, India |
| HPMC E15 (Hydroxy propyl methyl cellulose E15) | Merck specialties Pvt Ltd., Mumbai, India |
| Methanol | Merck specialties Pvt Ltd., Mumbai, India |
| Chloroform | Merck specialties Pvt Ltd., Mumbai, India |
| Dichloromethane | Merck specialties Pvt Ltd., Mumbai, India |
| Dibutyl phthalate | Finar Limited, India |
| Citral | Avra Synthesis Pvt Ltd., India. |
Methodology
Drug-Excipient Compatibility Studies
Differential Scanning Calorimetry (DSC): Differential scanning calorimetric experiment was conducted to find out the presence of any interaction among drug and the excipients used. 5-10 mg sample of pure drug, physical mixture of drug: polymers (1:1) was taken in the pierced DSC aluminium pan and scanned in the temperature range of 20–200°C. 10°C/ min was set as heating rate; nitrogen served as purged gas and the system was cooled down by using liquid nitrogen [5]. The differential scanning calorimeter (DSC 4000, Perkin -Elmer, New York, NY) was utilized for this purpose. Fourier Transform Infrared Spectroscopy (FTIR): FTIR study was conducted by KBR pellet method to know interactions between drug and excipients used in the formulation. IR spectra of pure drug, physical mixture of drug: polymer was found in between 4000-400 cm-1 range. Determination of λmax (Maximum Wavelength): 10 µg/ml of drug solution was prepared in distilled water, phosphate buffers pH 5.8 and 7.4. Samples were analyzed using UV/VIS spectrophotometer at wavelength range of 200-400 nm.
Preparation of SLNs
Solid lipid nanoparticles of Nisoldipine were prepared by hot homogenization followed by ultrasonication method. Nisoldipine (8.5 mg) and lipids (100 mg) were dissolved in 10ml mixture of chloroform and methanol (1:1) and to this soya lecithin (100 mg) was added and vortexes (Table 1). The organic solvent mixture was completely evaporated by heating to 5°C above the melting point of lipid using Rota evaporator. Poloxamer 188 (150 mg) was dissolved in double distilled water sufficient to produce 10 ml of aqueous phase and heated to the same temperature as that of melting lipid phase. Hot aqueous phase was added to molten lipid phase and homogenized (DIAX 900, Heidolph, Germany) at 12,000 rpm (revolution per minute) for 5 min. The temperature was maintained at 5°C above the melting point of lipid throughout the homogenization process. The coarse hot o/w emulsion thus obtained was sonicated using a probe sonicator-12T (Vibracell, USA) for 20 min. The obtained nanoemulsion was cooled to room temperature to obtain SLNs [5].
| Formulation Code | Lipids used | Lipids (mg) | Drug (mg) | Soya lecithin (mg) | Poloxamer (mg) |
|---|---|---|---|---|---|
| N-D4 | Dynasan114 | 100 | 8.5 | 100 | 150 |
| N-D6 | Dynasn116 | 100 | 8.5 | 100 | 150 |
| N-D8 | Dynasan 118 | 100 | 8.5 | 100 | 150 |
| N-C | Cholesterol | 100 | 8.5 | 100 | 150 |
| N-GMS | Glyceryl monostearate | 100 | 8.5 | 100 | 150 |
Evaluation of Prepared SLNs
Measurement of Size, Zeta Potential and Polydispersibility Index: Size and Zeta potential of all drug loaded SLN samples were measured by using Zetasizer (Nano ZS 90, Malvern Instruments, UK). SLN dispersion (100 µl) was diluted (5 ml) with double distilled water to get optimum Kilo Counts Per Second (KCPS) of 50-200 for measurements. Average particle size in nanometers, polydispersibility Index (PDI) and the zeta potential was measured. PDI was taken for dispersion homogeneity at a range of 0-1. The value <0.3 indicates a homogenous dispersion and PDI value >0.3 indicates high heterogeneity [5]. Drug Content: 100 µl of Nisoldipine loaded SLN was diluted to 1ml using chloroform: methanol mixture (1:1) and the final dilution was made by using mobile phase and total content was determined by using HPLC (LC-20 AD, Shimadzu, Japan) [5]. Entrapment Efficiency: By measuring the concentration of free drug (unentrapped) in aqueous medium as reported previously [6] entrapment efficiency (EE) was determined. Using centrifuge tubes (Sartorius, USA), which consisted of a filter membrane (M.Wt. Cut of 20,000 Da) at the base of the sample recovery chamber, the aqueous medium was separated by ultra-filtration. SLN dispersion (2.5 ml) was positioned in the outer chamber and sample recovery chamber was placed over the sample and centrifugation was performed at 4000 rpm for 15 min. The SLN all along with encapsulated drug remained in the outer chamber and aqueous phase moved into the sample recovery chamber through the filter membrane. The amount of Nisoldipine in the aqueous phase was estimated by HPLC method and the EE was calculated by the following equation:
total free total EE W W W ×100 = − (1)
Where, Wtotal is the weight of drug added in the system and Wfree is the weight of the unbound drug in aqueous system [5].
Freeze Drying: Lyophilization was required to be done to increase the stability of SLN formulations. 10% Trehalose (of total solid content) were used as Cryoprotectant. Trehalose has low hygroscopicity and do not have internal hydrogen bonding but increase hydrogen bond formation with nanoparticles and also low chemical reactivity contributes to an effective cryoprotection. After addition of trehalose, SLN formulation was stored in a deep freeze for a suitable time. Freeze drying was performed at -56°C for about 24 h. After 15 min of the onset of power when sufficient ice was formed, frozen samples were immediately placed in lyophilization flask to avoid melting of the frozen sample and then attached to the lyophilized vacuum tube. The vacuum was applied and in between degassing needed to be done to prevent explosion [7]. Morphology Study by SEM (Scanning Electron Microscopy): The surface morphology of the prepared SLN was studied using SEM (Scanning electron microscopy- Hitachi 200 in central instrumentation centre, Osmania University, Hyderabad) under freeze dried form. Freeze Dried SLNs of Nisoldipine was diluted in double distilled water (1 in 100). A drop of the SLN dispersion was mounted on aluminum stubs covered with a glass lamella and dried in vacuum oven [7]. Dry film then observed under SEM at different magnifications and micrographs were recorded.
Preparation of SLN Loaded Nisoldipine Transdermal Patches
Transdermal patches were prepared by dissolving varying concentrations of HPMC E15 (polymers) and dibutyl phthalate (plasticizer) in 20 ml of dichloromethane and methanol (1:1) (Table 2). The mixture was let for 6 h for swelling of the polymer. 1 g of freeze dried SLNs (equivalent to 8.5 mg of Nisoldipine) was dissolved in above mentioned solvent mixture and incorporated into the polymeric solution along with citral and vortexed (Cyclomixer, CM101, Remi Equipments, Mumbai). The prepared solution was poured into Anumbra petri plates of 38.46 cm2 areas and dried at room temperature by placing inverted funnel over it. After 12 h, patches were cut in 4.9 cm2 areas and packed in aluminum foil until used [8].
| HPMC E15 (mg) | Citral (%) | |
|---|---|---|
| N1 | 200 | - |
| N2 | 400 | - |
| N3 | 600 | - |
| N4 | 800 | - |
| N5 | 600 | 6 |
| N6 | 600 | 8 |
| N7 | 600 | 10 |
| N8* | 600 | 8 |
Table 3: Composition of SLN loaded Nisoldipine transdermal patches. Note: 17% v/w Dibutyl phthalate to the total polymer weight.
Evaluation Parameters
Thickness: The thickness of the patch was checked using screw gauge. Three selected patches from each formulation were used and the average thickness was recorded [9].
Weight Uniformity: For each formulation three selected patches (4.9 cm2) were weighed individually and the average weight was calculated [9].
Folding Endurance: This was obtained by folding the patch at the same place till it breaks. The folding endurance number is the number of times the patch was folded without breaking [9].
Drug Content: Patches from each formulation were collected and cut into tiny pieces (4.9 cm2) and allowed to dissolve in a 100 ml phosphate buffer and placed on magnetic stirrer. After 24 h the solution was filtered using whattman filter paper & diluted suitably [9]. The absorbance was measured at 238 nm (λmax) against blank using UV-visible spectrophotometer 117 (Systronics, India).
Moisture Absorption Study: Percentage moisture uptake was studied by first checking the initial weight of patches and then patches were stored in a desiccator (saturated solution of aluminum chloride (100 ml) maintained at 79.50% RH (Relative Humidity)) for 3 days. After time period, the patches were taken out and final weight was checked [9].
Finalweight initialweight %Moistureuptake Initialweight − = (2)
Moisture Content: Initial weight of patches was noted using a digital balance and then patches were stored in a desiccator for 24 h (calcium chloride at 40oC). When no further change in the weight of the patch was observed, this weight was taken as final weight [9].
Initailweight Finalweight %Moisturecontent Initialweight − = (3)
In Vitro Release Studies: Drug release studies from SLN loaded Nisoldipine transdermal patches were performed using Franz diffusion cell which contains donor and receptor compartment. Transdermal patch was placed over a dialysis membrane (Himedia Mol Wt 5000) which is soaked in dissolution media for overnight and sandwiched between the two compartments and fixed tightly with the help of clamps. Phosphate buffer pH 5.8 (15 ml) was used as dissolution media which was taken in the receptor compartment. The entire set up of Franz diffusion cell was placed on magnetic stirrer. The study was conducted at a speed of 25 rpm at 37±0.5°C. Samples (2 ml) were taken at pre-determined time intervals up to 24 h and analyzed using UV-Vis spectrophotometer at 238 nm against phosphate buffer pH 5.8 as blank [10]. Preparation of Rat Abdominal Skin: Male wistar rats (230- 250 g) were sacrificed using ether. The hair of the animals at the abdominal region was carefully trimmed short (<2 mm) with scissors and the full thickness skin was removed. The epidermis was prepared surgically by heat separation technique by soaking the entire abdominal skin in water at 60°C for 45 s. Epidermis was removed carefully and cleaned with water and this was used to perform ex vivo permeability studies [10]. Ex Vivo Permeation Studies: Patch was applied over the stratum corneum side of the rat skin and sandwiched between the two compartments of the diffusion cell. The receiver phase (15 ml) contains phosphate buffer pH 7.4 as release media. The whole assembly was kept on a magnetic stirrer and stirred at 25 rpm by maintaining the temperature at 37±0.5°C. Sample (2 ml) was withdrawn at pre- determined time intervals up to 24 h and replenished with an equal volume of phosphate buffer pH 7.4 and analyzed using UV-VIS spectrophotometer at 238 nm. Cumulative amount of Nisoldipine permeated (μg) was calculated. Graph was plotted by taking the cumulative amount permeated on y-axis and time on x-axis. Slope of the curve (m) obtained was divided by the area of the exposed skin surface (A, 4.9 cm2) to give flux (J, μg/cm2/h) at steady state [11]. Permeability
coefficient (Kp) and enhancement ratio was computed using following equation [10].
$$ \mathrm {F l u x}, \mathrm {J} = \frac {\mathrm {m}}{\mathrm {A}} \tag {4} $$
J Permeabilitycoefficient, Êp= C
d Cd = initial dug load Jof formulation Enhancement ratioER= Jof drugsolution (5) $$ \mathrm {J} = \frac {\mathrm {C} _ {\mathrm {S S}} \mathrm {C l} _ {\mathrm {T}} \mathrm {B W}}{\mathrm {A}} $$ (6) Css = NSD concentration at the therapeutic level (0.001 µg/l) ClT = total clearance (0.606 l/h/kg) BW= standard human body weight of 60 kg A = surface area of the transdermal patch (i.e. 4.9 cm2) Calculated theoretical flux value for NSD was 12.36 µg/ cm2/h.
Stability Studies
The stability studies were conducted by following ICH Q1C for zones III and IV (International conference on harmonization) guidelines for the optimized formulation (N6). The patch was wrapped in aluminum foil and stored in a desiccator containing saturated sodium chloride (NaCl) solution at a temperature of 40±2°C, 75±5% RH for 3 months [12]. The samples were withdrawn at regular intervals of 1st, 2nd and 3rd month and analyzed for drug content and percentage cumulative drug release up to 24 h.
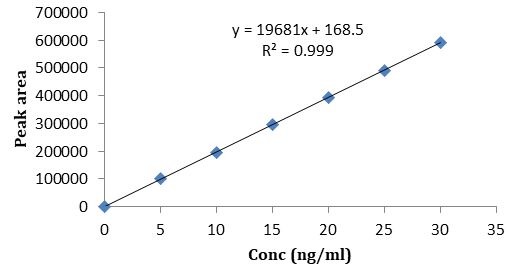
In Vivo Standard Graph of Nisoldipine by HPLC Method in Rat Plasma
The primary stock solution was prepared in the mobile phase by dissolving an accurately weighed quantity of Nisoldipine to make 1 mg/ml. The standard samples for calibration curve in plasma were prepared by spiking primary stock solution in 1ml of blank plasma for preparation of secondary stock solution of 100 ng/ml by serial dilution. A series of plasma samples containing 0, 20, 30, 40, 50, 60 ng/ ml of NSD was prepared.
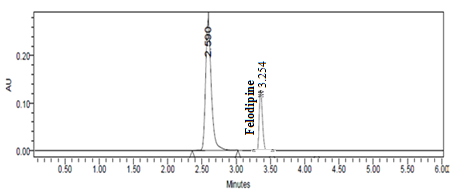
Chromatographic Conditions [13]
System: Shimadzu LC-20AD (UV-Visible detector) Analytical column: Kromasil 100-5C18 (4.6×25 cm) column at 25°C Wavelength: 238 nm Mobile phase: A mixture methanol, 0.01M potassium dihydrogen phosphate aqueous solution and 0.1M hexane sulphonic acid sodium salt (25: 65: 10 v/v) at pH 4.0 using orthophosphoric acid Flow rate: 1 ml/min Internal standard: Felodipine (RT-3.2 min) Injection volume : 20 µl Retention time of drug: 2.5 min
In Vivo Pharmacokinetics Evaluation of Optimized SLN Loaded Transdermal Patches of Nisoldipine
Adult male Wistar albino rats (230-250 g) were used for in vivo studies. These rats are not difficult to keep, breeds freely, responsive to changes in its environment as well as being easily trained. The animals were kept in polypropylene cages with a standard laboratory diet and water. The experimental protocol to carry out in vivo studies was reviewed and approved by an institutional animal ethical committee, University College of Pharmaceutical Sciences (1820/GO/Re/S/15/CPCSEA), Kakatiya University, Warangal, India (Registration No: IAEC/23/UCPSC/ KU/2018, dated; 31-08-2018). Marketed formulation Sular (ER) tablet was used as reference product as there was no transdermal patch of Nisoldipine available.
12 rats were divided into two groups (n =6). Group I was medicated with Sular suspension orally using oral guaze needle while optimized transdermal patch of Nisoldipine (N6) was applied to group II animals. About 4.9 cm2 of skin on the dorsal side of the rat was shaved and were subjected to observation for 24 h for any unwanted effects of shaving. Before administration of drugs, rats were fasted overnight. About 0.3 ml of blood samples were withdrawn at predetermined time intervals 0, 0.5, 1, 1.5, 2, 2.5, 3, 4, 6, 8, 12, 24 h from the retro-orbital venous plexus punctured using heparinized capillaries and analyzed using HPLC.
Pharmacokinetic parameters were estimated using non compartmental methods. Basic pharmacokinetic parameters required for comparison of bioavailability include, time to reach peak plasma concentration, peak plasma concentration and area under the plasma concentration time curve for the drug under observation were obtained from plasma concentration versus time profiles using KINETICA (version 5.0) software. Percent relative bioavailability of the optimized formulation with reference was calculated.
Statistical Analysis
Using personal computer with Graphpad prism all the data was statistically analysed. Student’s t-test was used to evaluate the statistical difference between test and reference product. A p< 0.05 was termed significant.
Results and Discussion
Drug-Excipient Compatibility Studies
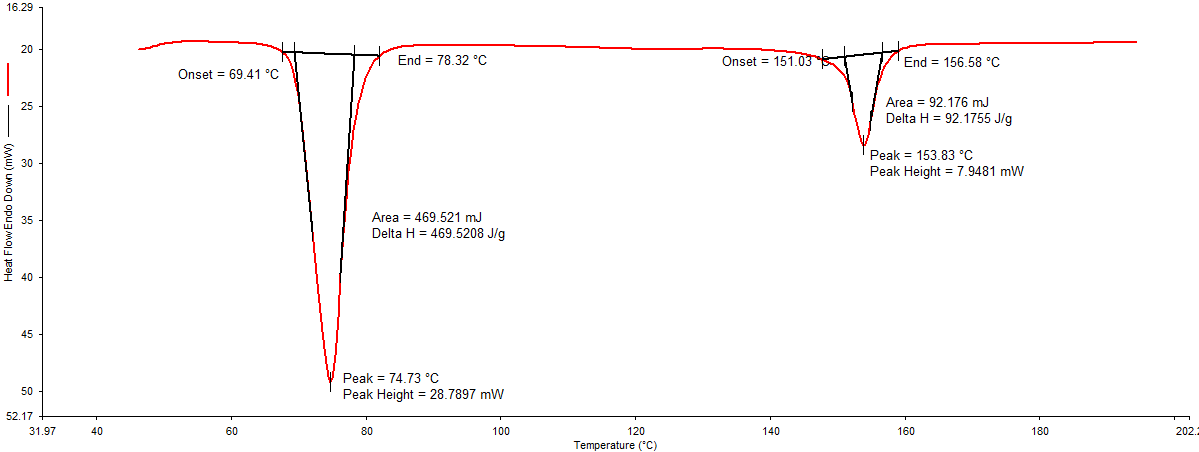
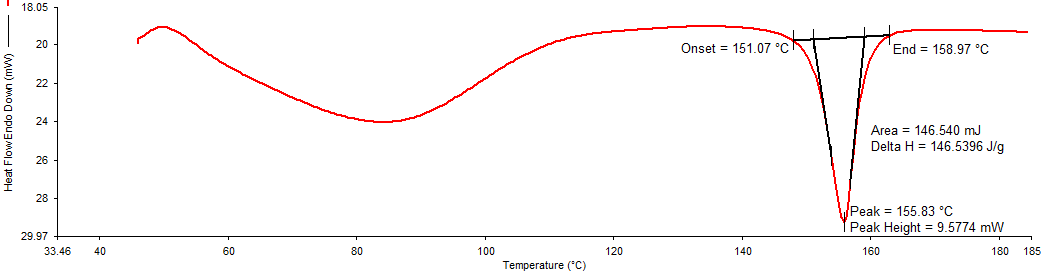
Differential Scanning Calorimetry (DSC): In DSC thermogram of pure drug (Figure 1), endothermic peak was noted at 161.07°C. DSC thermogram of physical mixture of drug: lipid (Figure 2) and drug: polymer Figure 3 showed an endothermic peak at 153.83 °C and 155.83°C respectively. Shift in the peak was very less which indicates the polymer (HPMC E15) and lipid (Dynasan114) used was compatible with the drug.
In this mixture, the melting endotherm of the drug was well preserved with slight changes in terms of broadening or shifting in the temperature of the melt. It is known that the quantity of material used, especially in drug-excipient mixtures, could influence the peak shape [14]. Thus, these minor changes in the melting endotherm of a drug could be due to the mixing of drug and excipient, which lowered the purity of components in the mixture and this might not necessarily indicate potential incompatibility.
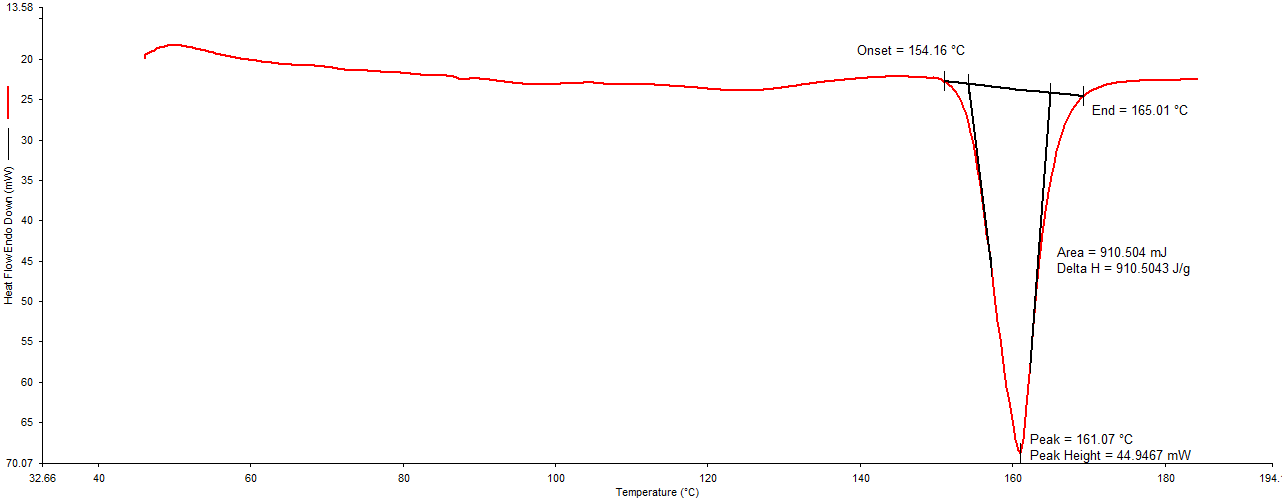
Figure1: DSC thermogram of pure drug (Nisoldipine).
Fourier Transform Infrared Spectroscopy (FTIR)
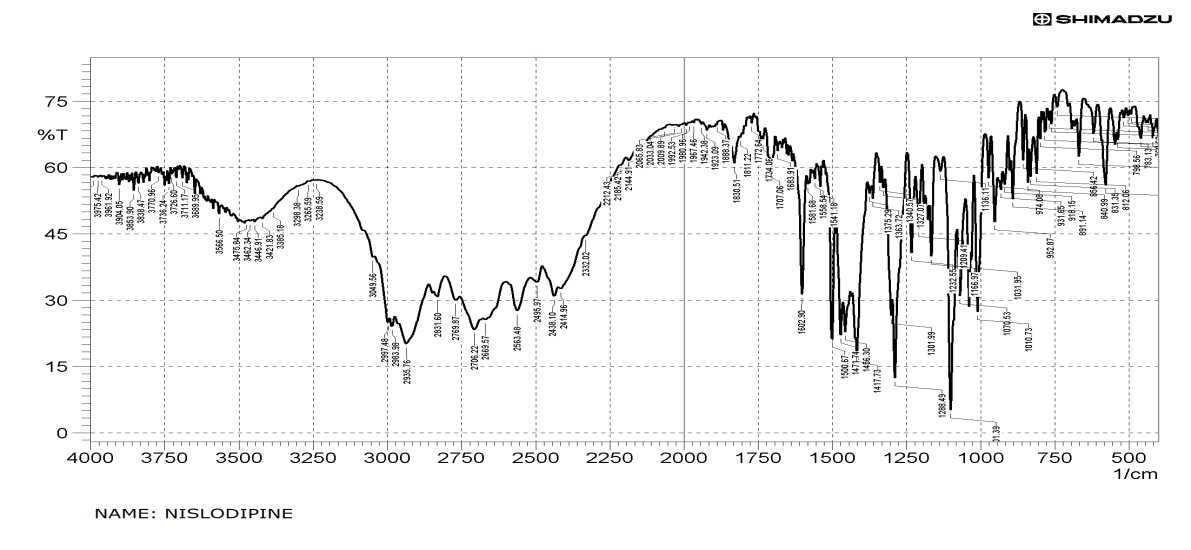
The prominent peaks observed with NSD was also observed in the IR spectra of sample containing physical mixture of NSD, Dynasan 114 & HPMC E15 and compared with literature values (Table 3) which indicates that drug did not show any interaction with excipients used and confirms the stability of the drug (Figures 4 & 5).
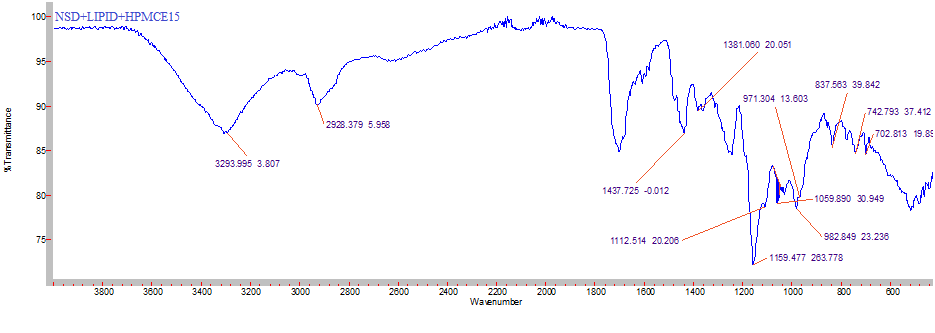
| Functional group | Frequency (cm-1) | ||
|---|---|---|---|
| Literature value | Nisoldipine | Physical mixture of NSD, Dynasan 114 & HPMC E15 | |
| C-NH (Stretching) | 3300-3500 | 3475.84 | 3293.995 |
| C-H (aliphatic) | 2850-2960 | 2997.48 | 2928.379 |
| O-C=O (ester) | 1690-1760 | 1602.9 | 1650.17 |
| NO (Stretching) 2 | 1515-1560 | 1500.67 | 1437.725 |
Table 4: FTIR data of pure drug (Nisoldipine) and physical mixture of drug, lipid and polymer.
Determination of λmax
The UV absorption maximum of Nisoldipine in phosphate buffer pH 5.8 and 7.4 was found at 238 nm, when scanned between 200-400 nm by UV-visible double beam spectrophotometer.
Evaluation of Prepared Nisoldipine SLNs
To optimize the lipid: drug ratio, different amounts of all five lipids (100, 200 and 300 mg) were tried with a constant dose of the drug (8.5 mg). Lipid content of 100 mg helped in the excellent encapsulation efficiency of 98.2±1.26% and low lipid content was reported to have a very small particle size [15]. 1.5% of poloxamer concentration was effective in producing SLN with small size (202.4±4.26 nm) and stable SLN’s with zeta potential value of -23.1±7.01 mv and prevented agglomeration during the homogenization process. The surface charge is a critical factor for the stability of colloidal preparations. From the results, the ZP values of formulations were found to be within the range of –19.2±6.45 to –23.3±7.2 mV. It is an indirect measure of physical stability of SLNs and even influences the release kinetic and the biological fate of nanoparticles. To achieve a nanoformulation with good stability for an electrostatically stabilized, a minimum ZP of ±30 mV is required, whereas in the case of a combined electrostatic and steric stabilization, a minimum ZP of ±20 mV is desirable [14].
In this study, poloxamer-188 was used as a surfactant. It is a non-ionic surfactant and decreases the electrostatic repulsion between the particles following sterical stabilization of the nanoparticles by forming a coat around their surface to maintain the stability of nanoparticles. High concentration of surfactant above 1.5% was avoided to prevent toxic effects associated with surfactants and also a decrease in the entrapment efficiency [16]. The higher drug content and EE with Dynasan114 (Table 4) were attributed to the extreme hydrophobicity due to the long chain fatty acids attached to the triglyceride resulting in increased accommodation of lipophilic drugs. Based on the above results N-D4 formulation was optimized, freeze dried and incorporated in a transdermal patch. Zeta potential (-23.1 mv) and EE (98.2%) of our optimized SLN formulation were higher when compared to previously reported nisoldipine SLNs (-25.3 mv & 90.53%) [14]. These parameters depend on the SLNs ingredients, which influence factors such as the solubility of the drug in the lipid phases, nanoparticle crystallinity index and thereby diffusion coefficient of the drug, production method and conditions used.
| Formulation Code | Particle Size (nm) | PDI | Zeta Potential (mv) | EE (%) | Drug Content (mg) |
|---|---|---|---|---|---|
| N-D4 | 202.4±4.26 | 0.268±0.05 | -23.1±7.01 | 98.2±1.26 | 8.42 |
| N-D6 | 470.4±9.76 | 0.382±0.01 | -22.4±3.42 | 96.2±0.96 | 8.39 |
| N-D8 | 510.1±7.63 | 0.350±0.06 | -23.3±7.2 | 96.5±0.36 | 8.4 |
| N-C | 273.7±4.12 | 0.296±0.02 | -19.2±6.45 | 97.1±1.34 | 8.4 |
| N-GMS | 565.8±3.23 | 0.360±0.05 | -20.1±4.32 | 94.8±0.84 | 8.36 |
Table 5: Evaluation parameters of prepared NSD SLNs.
Values represent mean ± SD (n=3). Table 4: Evaluation parameters of prepared NSD SLNs.
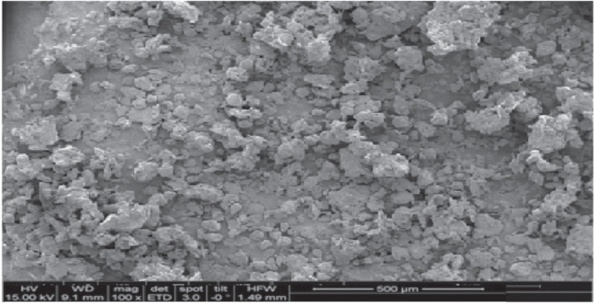
SEM Analysis (ND4)
Nanoparticles with almost spherical shape were obtained (Figure 6). The particles possess a smooth surface with nearly spherical in shape with increase in particle size and polydispersity [14]. Due to the lyophilization method, the agglomeration phenomenon was increased.
Evaluation Parameters of Patches
Physico Chemical Characteristics of Patches: Weight and thickness (Table 5) of patches increased with an increase in polymer concentration which was evidenced from the results shown below. Folding endurance of patches was considered to be below 100 for all the formulations. Percentage moisture content and moisture uptake Table 5 was found to increase with increase in concentration of polymer (HPMC E15). Microbial contamination in patches is prevented owing to low moisture absorption. Patches were stable, completely dry and brittle due to low moisture content.
| Weight Uniformity (mg) | Thickness (mm) | Drug Content (mg) | Moisture Content (%) | Moisture Absorption (%) | |
|---|---|---|---|---|---|
| N1 | 31.3±2.32 | 0.32±0.27 | 8.23±0.31 | 1.23±0.1 | 4.73±1.1 |
| N2 | 32.1±0.11 | 0.33±0.11 | 8.22±0.23 | 3.32±0.33 | 4.81±2.33 |
| N3 | 35±1.21 | 0.36±0.12 | 8.3±0.14 | 4.45±0.23 | 5.39±2.74 |
| N4 | 36.1±1.29 | 0.38±0.20 | 8.31±1.25 | 4.69±0.35 | 7.12±2.11 |
| N5 | 35.5±3.14 | 0.34±2.11 | 8.34±0.26 | 4.40±0.32 | 6.12±1.98 |
| N6 | 34.4±1.21 | 0.33±1.3 | 8.40±1.3 | 4.22±0.41 | 5.45±0.89 |
| N7 | 35.1±2.14 | 0.32±1.24 | 8.3±2.34 | 4.35±0.13 | 6.3±2.63 |
| N8 | 35.0±2.11 | 0.31±1.22 | 8.3±1.24 | 4.32±0.23 | 6.21±2.23 |
Table 6: Physico chemical evaluation of different formulations. Values represent mean ± SD (n=3)
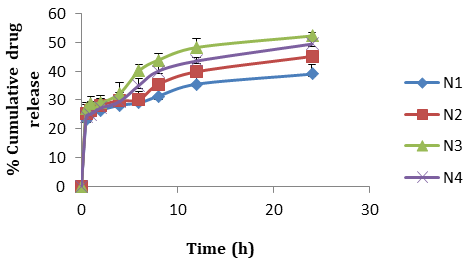
In Vitro Release Studies
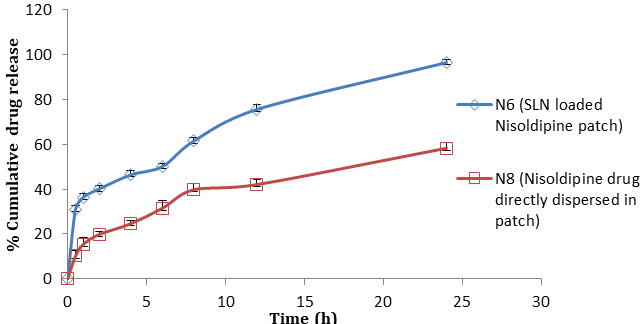
Formulation N3 patches exhibited greatest (52.21±1.04) percentage of drug release without citral (Figure 7). As the concentration of polymer (HPMC E15) increased in the formulation, the drug release rate increased, however with a very small decrease in formulation N4 patches which may be due to increase in the diffusional path length. Citral in different concentrations (6% to 10%) was added in N3 formulation and tends to enhance the release rates. Good permeation enhancement was observed with 8% of citral (N6, 96.5%) (Figure 8) and beyond this the drug release was found to decrease which might be due to reach of saturation point. For optimized formulation, the best fit with the highest correlation value was demonstrated by the first order (R2=0.9660). On the other hand n values (n<0.5) obtained from peppas equation indicated fickian diffusion controlled drug release.
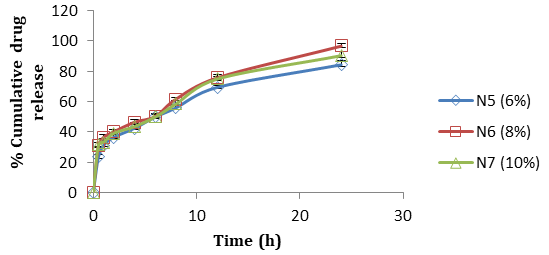
Drug release from SLN loaded patch was higher (N6, 96.5%) compared to plain Nisoldipine patch (N8, 58.3%) which may be attributable to an increase in solubility of drug (Figure 9).
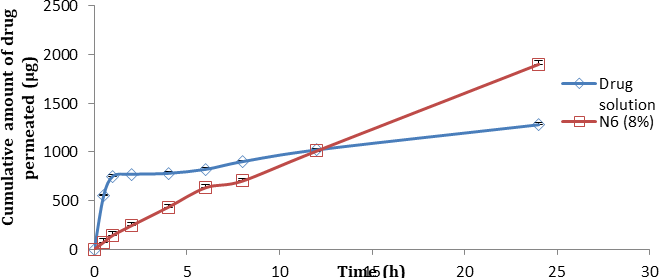
Ex Vivo Permeation Study of Optimized Formulation through Rat Skin
The result of ex vivo skin permeation of NSD from optimized patch was illustrated in (Figure 10). Citral acts by modifying the solvent nature of stratum corneum and increases drug partition coefficient into tissue. The calculated flux was higher for formulation N6 (8% citral 15.8 µg/cm2/h) when compared to theoretical flux (12.36 µg/cm2/h) and drug solution (7.26 µg/cm2/h) with enhancement ratio of
2.17. The ER was observed to be above 1, thus indicating an increased permeation of Nisoldipine through rat abdominal skin from transdermal patches. The ex vivo permeation profiles of drugs from N6 seem to follow first order kinetics as it is evidenced by correlation coefficient (0.9933) and n value (0.8340) indicating that the mechanism of drug release was by a non Fickian diffusion transport mechanism supporting diffusion and relaxation mechanism of controlled drug release.
3 months studies were performed (Table 6). Significant changes in drug content and in vitro drug release were not observed. Some changes were noticed but statistically insignificant, which indicated the susceptibility to stability problems during storage.
| Parameters | 1st month | 2nd month | 3rd month |
|---|---|---|---|
| Drug content (mg) | 8.37±1.32 | 8.32±0.57 | 8.3±0.88 |
| % cumulative drug release | 96.2±3.17 | 96.1±1.98 | 96.2±2.3 |
Table 7: Stability study for optimized formulation (N6).
Values represent mean ± SD (n=3). Table 6: Stability study for optimized formulation (N6).
In Vivo Results and Discussion
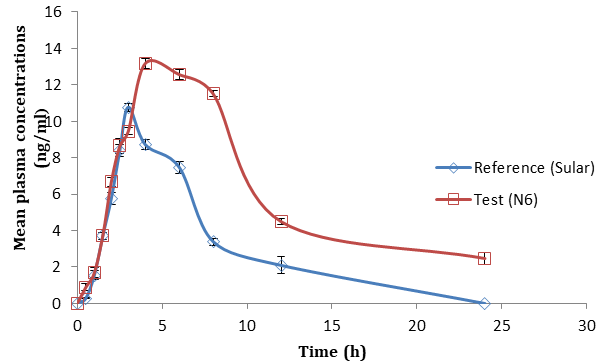
The in vivo study conducted in healthy male wistar rats. Pharmacokinetic parameters of NSD transdermal patch were estimated and compared with the reference product (Sular). Mean plasma concentration - time profile obtained was shown in Figures 11-13. Mean pharmacokinetic parameters of Nisoldipine administered as test and reference products in rats were shown in Table 7. Test formulation (N6) showed prolonged release of NSD from transdermal patch by delaying peak plasma concentration. The t1/2 difference was due to the prolonged absorption of the test formulation and prolonged continuous release of the drug into the blood stream. The lower t1/2 of reference product indicates rapid removal of the drug from plasma. Mean AUC0-t and AUC0-∞ were higher for the test formulation than reference which indicates that the overall absorption of Nisoldipine was more in test formulation than reference formulation having the same dose. Due to the nano size of the formulation, the effective surface increased consequently, increasing the solubility of the drug and increasing bioavailability. The MRT and half-life were 3 times higher in comparison with the oral formulation. This indicates prolonged release as well as avoidance of the first-pass metabolism of the drug through a transdermal route [14]. Reference formulation maintained Css (5.78 ng/ ml) level up to 6h while test formulation was capable to maintain up to 12h, which indicates dynamic equilibrium where our optimized formulation (test) can maintain consistent drug concentration within therapeutic limits for a long period. Pharmacokinetic parameters, Cmax, Tmax, AUC of test and marketed product when studied with student’s t-test showed a significant difference (p<0.05) between two formulations.
The above results reveals that there is significant increase in bioavailability of the test formulation when compared to the reference formulation which may be due to avoidance of first pass metabolism, increased skin permeation and decrease in particle size of Nisoldipine improved solubility. Relative bioavailability of the test formulation with respect to market preparation was found to be 2.52.
| Pharmacokinetic Parameters | Unit | Reference (Sular) | Test (N6)* |
|---|---|---|---|
| C max | ng/ml | 10.77 | 13.17 |
| T max | h | 3 | 4 |
| AUC 0-24 | ng×h /ml | 60.02 | 129.1 |
| AUC 0-∞ | ng×h /ml | 100.11 | 252.68 |
| t ½ | h | 13.33 | 34.65 |
| AUMC 0-∞ | ng×h2/ml | 141.23 | 175.8 |
| MRT 0-∞ | h | 19.23 | 50.01 |
| K E | 1/h | 0.05 | 0.02 |
Table 8: Mean pharmacokinetic parameters of Nisoldipine administered as test and reference products in rats (n=6).
*Statistically significant from the reference product, p<0.05. Table 7: Mean pharmacokinetic parameters of Nisoldipine administered as test and reference products in rats (n=6).
Conclusion
The SLN loaded transdermal patches of Nisoldipine were developed and evaluated successfully. Dynasan114, HPMC E15 was used as lipid & polymer respectively. Nisoldipine was considered to be compatible with HPMC E15 & Dynasan114 from the results obtained from DSC and FTIR study. In vitro studies illustrate that NSD being hydrophobic in nature cannot be easily permeated through stratum corneum as optimum HLB value needs to be maintained to cross corneum and hence permeation enhancer was required. Citral was used as an enhancer which reacts with amides of ceramide located in corneum and disrupts the barrier so that drug diffusion occurs. Maximum drug release was seen with 8% of citral. In vivo bioavailability study was done in male wistar rats and pharmacokinetic parameters were calculated. There was significant increase in bioavailability of the test formulation (N6) when compared to the marketed formulation. Relative bioavailability of the test formulation with respect to market formulation (Sular) was found to be 2.52. Drug is already solubilised in lipid so solubility and bioavailability of poorly water soluble drug is increased [17]. The increase may also be able to avoidance of first pass metabolism of Nisoldipine which occurs through oral administration. SLN loaded transdermal patches show higher pharmacokinetic parameters (Cmax -13.17 ng/ml, AUC0-∞ -252.68 ng×h /ml, t½ -34.65 h) when compared to Nisoldipine SLN oral suspension (Cmax -11.94 ng/ml, AUC0-∞ -89.02 ng×h /ml, t½ -15.26 h) which was previously reported which may be due to direct availability of drug to systemic circulation which avoids enzymatic metabolism, uptake by efflux transporters and first pass metabolism which occurs through oral route. The results obtained from the study are encouraging and confirm the suitable delivery system for poorly soluble and low bioavailability drugs.
Acknowledgement
The authors are thankful to Maulana Azad National Fellowship (F1-17.1/2015-16/MANF-2015-17-TEL-71946) for providing fellowship for conducting the study.
References
-
Pnanner Selvam R, Kumar Singh A, Sivakumar T (2010) Transdermal drug delivery systems for antihypertensive drugs - A review. Int J Pharm Biomed Res 1(1): 1-8.
-
Shaileh. TP, Charmi GP, Chhagan NP (2011) Formulation and evaluation of transdermal patch of Repaglinide. ISRN Pharmaceutics 2011.
-
Garcia RL, Rondero AG (2015) Solid lipid nanoparticles (SLN) and nanostructured lipid carriers (NLC): occlusive effect and penetration enhancement ability. J Cosmet Dermatol Sci Appl 5: 62-72.
-
Gayatri P, Ajitha M, Kumar PP, Rao YM (2016) Development and characterization of nisoldipine matrix type transdermal films: in vitro and ex-vivo evaluation. American Scientific Research Journal for Engineering Technology and Sciences 23(1): 1-14.
-
Kiranmai GU, Narender D, Kishan V (2015) Preparation, characterization and in vivo evaluation of felodipine solid lipid nanoparticles for improved oral bioavailability. Int J Pharm Sci Nanotechnol 8(4): 2995-3002.
-
Venkateshwarlu V, Manjunath K (2004) Preparation, characterization and in vitro release kinetics of clozapine solid lipid nanoparticles. J Contr Rel 95(3):627-33.
-
Narender D, Kishan V (2015) Pharmacokinetic and pharmacodynamic studies of nisoldipine-loaded solid lipid nanoparticles developed by central composite design. Drug Dev Ind Pharm 41(12): 1968-1977.
-
Ravi G, Gupta NV (2017) Development and evaluation of transdermal film containing solid lipid nanoparticles of rivastigmine tartrate. Int J App Pharm 9(6): 85-90.
-
Pavani S, Kumar YS, Rao YM (2015) Comparison of enhancement of transdermal permeability of carvedilol through physical and chemical methods. Egypt Pharm J 14: 103-108.
-
Ramesh G, Vishnu YV, Kishan V, Rao YM (2007) Development of nitrendipine transdermal patches: in vitro and ex vivo characterization. Curr Drug Delivery 4(1): 69-76.
-
Peltola S, Savolainen PS, Kiesvaara J, Suhonen TM, Urtti A (2003) Microemulsions for topical delivery of estradiol. Int J Pharm 254(2): 99-107.
-
Afreen S, Vishnu YV, Saleh SA, Wajid S, Kumar RS, et al. (2015) Design and in-vitro evaluation of controlled release tri-layer venlafaxine hydrochloride transdermal patch. Asian J pharm Clin Res 8(3): 271-277.
-
Abdulla SA, El-Shal MA, Attia AK (2013) Validated HPLC method for the determination of nisoldipine. Pharm Anal Acta pp: 1-4.
-
Narender D, Janga KY, Thirupathi G (2018) Comparative study of nisoldipine-loaded nanostructured lipid carriers and solid lipid nanoparticles for oral delivery: preparation, characterization, permeation and pharmacokinetic evaluation. Artif Cells Nanomed Biotechnol 46(S2): 616-625.
-
Qushawy M, Nasr A (2020) Solid lipid nanoparticles (SLNs) as nano drug delivery carriers: preparation, characterization and application. Int J App Pharm 12(1): 1-9.
-
Muller RH, Karsten M, Sven G (2000) Solid lipid nanoparticles (SLN) for controlled drug delivery-a review. Eur J Pharm Biopharm 50: 161-177.
-
Pandya BJ, Parmer DR, Soniwala M, Chavda JR (2013) Solid lipid nanoparticles: overview on excipients. Asian J Pharm Technol Innovation 01(03): 1-9.
-
Bhaskar NV, Prakash PR, Devanna N (2016) Development, characterization and evaluation of simvastatin solid lipid nanoparticles loaded transdermal patch. J Chem Pharm Sci 9(2): 702-708.
-
Anubruj J, Kumar JJ, Jayachandran E, Rao DS, Vijayan V (2011) Transdermal delivery of repaglinide from solid lipid nanoparticles in diabetic rats, in vitro and in vivo studies. J Pharm Sci Res 3(3): 1077-1081.
-
Mangesh BR, Prashanth U, Ashwini M (2016) Solid lipid nanoparticles incorporated transdermal patch for improving the permeation of piroxicam. Asian J Pharm 10(1): 45-50.
-
Liu D, Ge Y, Tang Y, Yuan Y, Zhang Q, et al. (2010) Solid lipid nanoparticles for transdermal delivery of diclofenac sodium: preparation, characterization and in vitro studies. J Microencapsulation 27(8): 726-734.
-
Ekambaram P, Hasan A, Sathali A, Priyanka K (2012) Solid lipid nanoparticles: a review. Sci Revs Chem Commun 2(1): 80-102.
-
Gupta R, Mukherjee B (2003) Development and in vitro evaluation of diltiazem hydrochloride transdermal films based on povidone-ethylcellulose matrices. Drug Dev Ind Pharm 29: 1-7.
-
Jain N (2001) Advances in controlled and novel drug delivery. In: 1st (Edn.), CBS publishers and distributors, New Delhi, India, pp: 408.
-
Chen J, Jiang QD, Chai YP, Zhang H, Peng P, et al. (2016) Natural terpenes as penetration enhancers for transdermal drug delivery. Molecules 21(12): 1-22.
-
Zhang Z, Li YT N, Li J (2004) High-Performance liquid chromatography–electro spray ionization mass spectrometric determination of nisoldipine in human plasma. J Chromatogr Sci 42(9): 501-505.
- Solution-Processed Chiral Perovskites for Biomedical Applications
- Nanotechnology in Health Chemistry and Medicine: Current Challenges and Future Directions
- Human Exposure to Micro- and Nanoplastics: Pathways, Toxicity, and Intervention Strategies
- Exosome Nanomedicine for Cancer Therapy
- Micro and Nanoplastics–Plastisphere, Biotoxicity, Impact on Human Health, and Mitigation Strategies
- Process Validation of Cefixime Powder for Suspension Dosage Form, 50 mL