Tupichinol-E Reverse Epithelial to Mesenchymal Transition against ER Positive and Triple Negative Breast Cancer
Aim: To investigate the effects of Tupichinol E, an alkaloid present in Tupistra chinensis BAKER (Liliaceae) on the metastasis of Triple negative mammary carcinoma in-vitro, and elucidate the underlying mechanisms and Tupichinol E binding to EGFR stabilises the protein structure and is a pharmacologically active substance that can be used against cancer due to its potent activity. Methods: Growth of MCF-7 and MDA-MB-231 cells was assessed using MTT assay. Apoptosis and cell cycle of MCF-7 cells were evaluated with flow cytometry, and the related proteins were examined using Western blotting. Structurally similar EGFR inhibitors, their modes of binding and mechanism of actions are a new way to select lead compounds for better alternatives. Therefore molecular docking is done to find a potential anti-EGFR flavonoid. Results: Tupichinol E (35–280 μmol/L) inhibited the growth of MCF-7 cells in time- and dose-dependent manners (the IC50 values were 105±1.08 and 78.52±1.06 μmol/L, respectively, at 48 and 72 h). Treatment of MCF-7 cells with Tupichinol E (70–280 μmol/L) dose-dependently induced apoptosis of MCF-7 cells, accompanying activation of caspase 3. The cells treated with Tupichinol E (140 and 280 μmol/L) significantly increased the percentage of cells in G2/M phase with a reduction in the expression of cyclin B1. Osmertinib shows binding energy -107.23 kcal/mol with EGFR, while Tupichinol E shows binding energy -98.89 kcal/mol. Tupichinol E shows 1.5 times more binding affinity than Osmertinib. Conclusion: These results demonstrated that Tupichinol E is an effective antitumor compound in vitro and in-silico, and has the potential to be developed as a new anticancer drug.
Introduction
Medicinal plants provides essential bio resources of drugs for conventional system of medicine [1]. They are utilised for treating a wide range of irrational illnesses since they comprise of various natural dynamic fixings [2]. FTIR, HPTLC, and GC-MS analysis are only a few of the methods used to identify phytoconstituents in medicinal plants [3]. In numerous nations, Fourier Transform Infrared Spectroscopy has been utilized as a crucial way of identifying drugs for pharmacopeia, as it is one of the widely used methods to classify chemical constituents [4]. It is a nondestructive analytical approach that offers structural information on molecular characteristics of a wide variety of compounds [5]. Tupistra chinensis BAKER (Liliaceae) is endemic to southwestern regions of the People’s Republic of China [6]. The roots of T. chinensis can be used as medicines, which are widely distributed in the central and southwest of China. The Three Gorges Reservoir area and Shennongjia forests in Hubei are the main places producing T. chinensis, and the production capacity is large and the resources are very abundant in these areas. As our Chinese ancient medicine books described, T. chinensis has been used to treat heat cough, traumatic injury, rheumatic pain, snake bites and abnormal menstruation disorder. As a folk medicine, this species has usually been used to reduce carbuncles and ameliorate pharyngitis [7]. As a Chinese folk medicine, this species has usually been used for treatment of rheumatic diseases and snake-bite [6]. The gargle containing T. chinensis has been used in the treatment of pharyngitis and tonsillitis in folk, which is effective and convenient [8]. In recent years, researches on the chemical components of T. chinensis have shown that it mainly contains steroidal saponins, flavonoids, lignans and volatile oil, and its pharmacological activities are anti-tumor, anti-inflammatory and antibacterial. In order to better research and utilize T. chinensis, to provide a reference for the clinical application of T. chinensis and the separation of its active components. This paper summarized the latest research progress of chemical compositions and pharmacological effects of this plant. Our current Phytochemical study for new efficient agents has led to the isolation of flavonoids, Tupichinol D, Tupichinol E, and Tupichinol F.
Materials And Methods
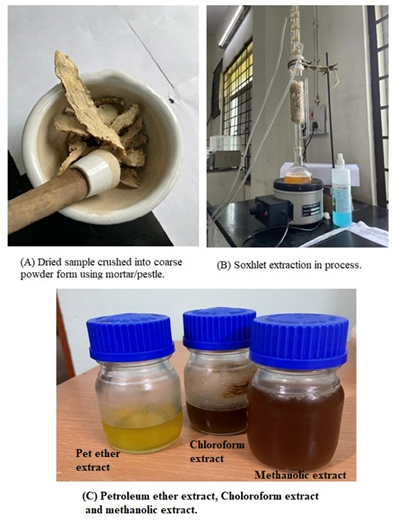
Preparation of Plant Extract
Dried Tupistra chinensis (Kai Kou Jian) rhizome was purchased from Hongkong, China in April 2023. The dried samples were crushed ground into coarse powder using a mortar/pestle and stored in airtight bottles. Thereafter, 150 g of coarse powdered rhizome was extracted with 500ml of methanol by Soxhlet apparatus for 24 hrs. This mixture was heated using Soxhlet at 45-60°C, after which the methanol undergoes evaporation. The TCRE (Tupistra chinensis rhizome methanolic extract) was concentrated on rotary vacuum evaporator (ROTEVA EQUITRON, Mumbai) and further dried in vacuum dryer. The Tupistra chinensis rhizome methanol extract shows presence of flavonoids in preliminary phytochemical study [9, 10, 11].
Preparation of Preliminary Phytochemical Analysis
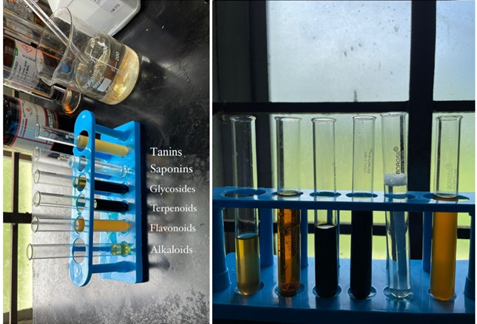
Test for screening and identification of chemical bioactive chemical constitutent in Tupistra chinensis were carried out with the extract using standard procedure as: Test for Alkaloids: (Mayer’s Test/Dragendroff test): 3ml of sample was taken and 1% HCL was added to it and then 6 drops of Mayer’s reagent or Dragendroff’s reagent was added to it. An organic precipitate indicated the presence of alkaloid in the sample solution. Test for Flavonoids: (Ammonia Test): 5ml of dilute ammonia solution was added to a portion of extract followed by addition of concentrated H2SO4. A yellow coloration was observed which confirmed the presence of flavonoids and it disappeared on standing. Test for Terpenoids: 5ml of each extract was added to 2ml of chloroform and 3ml of concentrated H2SO4 to form a monolayer of reddish brown coloration of the interface was showed to form positive result for the terpenoids. Test for Cardiac Glycosides: (Keller Kiliani test): 5ml of each extract was treated with 2ml of Glacial Acetic Acid (GAA) containing 1 drop of ferric chloride solution. This was underplayed with 1ml of concentrated H2SO4. A brown ring of the interface indicated a deoxy sugar characteristics. A violet ring might appear below the brown ring whereas the acetic acid layer, a greenish ring might form just gradually throughout thin layer. Test for Saponins: (Foam test): The extract with 10ml of distilled water was agitated in a graduated cylinder for 15mins. The formation of 1cm layer foam indicated the presence of saponins. Test for Tannins: (Lead acetate solution): A few drops of 1% lead acetate were added to 5ml of extract. A yellow precipitate indicated the presence of tannins.
Purification and Characterization of Extract
Column Chromatography: For isolation, the flavonoids are soluble in methanol solvent [12, 13, 14]. The methanolic extract was dissolved in a small amount of water, extracted with ethyl acetate, and the resultant solution was then concentrated to provide the ethyl acetate soluble components. To isolate specific phytoconstituents, silica gel column chromatography (60–120 mesh) was used. Ethyl acetate soluble part was eluted gradiently using chloroform, chloroform: ethyl acetate, ethyl acetate, ethyl acetate: methanol and methanol resulting in a compound which indicated a single spot on TLC plate developed in Tolune: ethyl acetate: formic acid (6:2:0.8) and sprayed with 1% Aluminium chloride reagent. FTIR Analysis: One of the most effective methods for determining the kinds of chemical bonds (functional groups) that are present in compounds is the Fourier transform infrared spectrophotometer (FTIR) [15]. For the FTIR study, samples of various solvent extracts of each plant material were employed. To create a translucent sample disc, 10ml of the extract sample was encapsulated in 100 mg of KBr pellet. The sticky extract methanolic extract sample was placed into an FTIR Spectroscope (Shimadzu, IR Affinity1, Japan), which has a 400–4000 cm–1 scan range and a 4 cm–1 resolution.
Gc-Ms Analysis: The sample was examined using the GC-MS/ EI technique of gas chromatography mass spectrometry and mass spectrometry electron ionization [13]. Scion 436-GC Bruker model with triple quadruple mass spectrophotometer and BR-5MS fused silica capillary column (5% diphenyl/95% dimethyl polysiloxane) with length of 30m, internal diameter of 0.25 mm, and thickness of 0.25 m makes up the GC-MS/ MS. Helium gas (99.999%), was used with an injection volume of 2 l and a continuous flow rate of 1 ml/min (split ratio of 10:1). Ion source temperature is 280°C, and the injector temperature is 250°C. The oven temperature was programmed to start at 110°C (isothermal for 2 min), rise at a rate of 10°C/min to 200°C, then decrease at a rate of 5°C/ min to 280°C, finish with an isothermal at 280°C for 9 min, and run the GC for a total of 41 min.9 This final increment was performed to remove any residue from the column. With an ionisation energy of 70eV, the mass spectrometer was operated in the positive electron ionisation (EI) mode. The solvent delay ranged from 0 to 3.0 min. Fragments with a m/z range of 50 to 500 Da and a scan interval of 0.5 seconds were designed. The source temperature was 250 °C, while the input temperature was set at 280 °C. Comparing each component’s average peak area to the total areas allowed us to determine the proportional percentage amount of each component. MS Work station 8 was the programme chosen to manage mass spectra and chromatograms. The Odisha University of Agriculture and Technology, Bhubaneswar, Odisha, conducted the GC-MS/MS.
In-vitro Analysis
Cell Lines: MCF-7 and MDA-MB-231 cells were obtained
from National Centre for Cell Science (NCCS, Pune, India).
10% foetal bovine serum (FBS) supplemented RPMI-1640
was used to culture the cells. Cultures were kept at 37 °C in a
humidified environment with 5% CO2.
MTT Assay: Using an MTT test, the impact of Tupichinol E
on the development of MCF-7 and MDA-MB-231 cells was
investigated. With or without Tupichinol E (25, 50, 100, 150,
and 200 μmol/L), cells were subcultured in 96-well plates
at a density of 103 cells per well for 24 h, 48 h, or 72 h in a
final volume of 200 μL. Then, the media was taken out and
20 μL of MTT (5 mg/mL in PBS) were added to the fresh
medium. 100 μL DMSO was added to each well after 2 h
incubation at 37 °C, and the plates were agitated for 1 min.
At 570 nm, spectrophotometric absorbance was measured.
The percentage of viability was calculated as the following
formula: (viable cells) %=(OD of drug-treated sample/OD of
$$ \text{Apoptosis Detection Assay: Harvested cells were} $$
suspended in 100 μL of binding buffer (1×) including 1 μL
Annexin V-FITC and 10 μL PI for 15 min in dark at room
temperature and then 400 μL binding buffer (1×) was added
to each sample, after the treatment with Tupichinol E 0, 50,
100, and 200 μmol/L for 24 hr.
A total of 10,000 events were recorded while analyzing the FITC and PI fluorescence through FL-1 (530 nm) and FL-2 (585 nm) filters, respectively.
Cell Cycle Analysis: MCF-7 cells were collected, washed with cold PBS, fixed in cold 70% ethanol and stored at -20 °C overnight following a 24hr treatment with Tupichinol E 0, 50, 100, and 200 μmol/L. After another round of PBS washing, cells were stained with 100 μg/mL of RNase A, 25 μg/mL of propidium iodide and 0.1% of Triton X-100 in PBS, and incubated at 37 °C for 30 min. On a flow cytometer, cell cycle analysis was performed. Western Blot Analysis: After the treatment with Tupichinol E (0, 50, 100, and 200 μmol/L) for 24 hr, MCF-7 cells were lysed in lysis buffer (Cell Signaling Technology, Danvers, MA, USA) for 30 min on ice. Lysates were then centrifuged at 14 000×g for 10 min to remove insoluble material, and the concentration of lysates was determined using a BCA kit (Pierce Biotechnology, Rockford, IL, USA). Gel electrophoresis using 10% sodium dodecylsulfate–polyacrylamide gel was used to separate the cell extracts before they were transferred to a polyvinylidene difluoride membrane and blocked with 5% nonfat milk. Each antibody against Bcl-2, Bax, cyclin D1, cyclin B1, caspase 3, and β-actin was used to probe the blot. Following the blot was washed, exposed to horseradish peroxidase conjugated secondary antibodies for 1 h at room temperature. Then the signals were detected [16].
Statistical Analysis
All experiments were run twice and thrice times. Student’s t-test or the log-rank test (for survival analysis) were used for statistical analysis, and data was described as the mean±SD. When the P-value of less than 0.05 was used to determine whether the difference was statistically significant.
Molecular Docking Analysis
Receptor Preparation: On the basis of review of literature, the EGFR and HER2 proteins were selected as molecular targets. The structures of L858R (identified by accession codes 4I20, X-ray crystal structure, resolution 3.34 A) and erbB2 (identified by accession codes 3PP0, X-ray crystal structure, resolution 2.25 A) receptors were acquired from the PDB database. Following that, the receptors were downloaded in PDB file. Previously, native receptors were created by altering the relevant residues with the USFC Chimera bioinformatics tool. PDB format proteins were also generated using Contreras-Puentes et al.’s method [17, 18]. Search and Selection of Ligands: Two drug osmertinib (first-line treatment drug) and Tupichinol E against cancer were selected for virtual screening. Ligand library was prepared by downloading in MDL Molfile (mol). from Drug Bank database manually. The drug-likeness of all the ligands was determined by using Lipinski’s rule of five via. molecular weight < 500 Da, having up to 5 H-bond donors and less than 10 H-bond acceptors and logP not exceeding 5 [19, 20]. Molecular Docking: Molecular docking was carried out using iGEMDock, and 3D protein structures of all the proteins based on the study were put onto the iGEMDock interface for docking. Virtual Docker’s built-in cavity detection method was used to discover potential binding sites. Before performing
Results and Discussion
the analysis, each Protein Data Bank file was arranged using the default parameters in Virtual Docker. The docking process was then carried out between different ligands and active sites of various protein structures using the MolDock score as the MVD scoring function with a grid resolution of 0.30. Each procedure was run ten times. Furthermore, the highest number of iterations was 2000, with a 100 Kcal/mol energy threshold. The conformations with the lowest docked binding energies were selected for each docking process, as best conformation (Figures 1&2, Tables 1&2) [21, 22, 23].
| Extractives | Tupistra chinensis rhizome | |
|---|---|---|
| % w/w | Consistency | |
| Petroleum Ether (40-60o) | 0.3 | Sticky |
| Chloroform | 2.7 | Sticky |
| Methanol | 16.9 | Very Sticky |
| Distilled Water | 3.21 | Solid |
Table 1: Phytochemical analysis showing successive Extractive Values of Tupistra Chinensis Rhizome.
| Solvent Extract | Alkaloids | Flavonoids | Terpenoids | Glycosides | Saponins | Tanins |
|---|---|---|---|---|---|---|
| Petroleum ether [40-60o] | - | - | - | - | + | - |
| Chloroform | + | - | - | + | + | - |
| Methanol | - | + | + | + | + | + |
| Distilled Water | - | + | - | + | + | - |
Table 2: Preliminary Phytochemical Investigation of Tupistra Chinensis Rhizome. + (presence), - (Absence).
Column Chromatography Analysis
The column chromatographic investigations were planned with an emphasis on the TLC results. The fraction containing quercetin was made up of flavonoids. Using the identical Rf value fractions that were collected and concentrated during column chromatography, each individual fraction underwent TLC (Table 3) [10, 12].
| TLC pattern | Quantity | |
|---|---|---|
| 5-Jan | Not any spot | - |
| 20-Jun | Single Spot | 30mg |
| 21-27 | Trace amount mixture | - |
| 28-35 | Not any spot | - |
| 35-40 | Mixture of 2 compound | - |
Table 3: TLC pattern of Tupistra chinensis rhizome methanolic extract.
About 20g of silica gel (100-200 mesh) was packed. The selection of solvents in systematic order proves the effect of polarity on the extraction and the extracted phytochemicals. About 40 fractions with different Rf values were separated during column chromatography procedure. The column fractions of Tupistra chinensis rhizome methanolic extract was subjected to various qualitative Phytochemical test like tannin, alkaloids, flavonoids, glycosides, etc. it was evident that fraction 6-20 showed positive result for flavonoids.
In fraction 6-20 shows compounds with equivalent Rf value for solvent system Tolune:Ethyl acetate:Formic acid (6:2:0.8) and 1% Aluminium chloride reagent sprayed on the surface. After the solvents have evaporated, the fraction 6–20 is mixed to produce a solid product that is yellowish brown in colour. From this one pure component (10 mg) of Tupistra chinensis rhizome methanol fraction was isolated from this sample (Figure 3).
FTIR Analysis
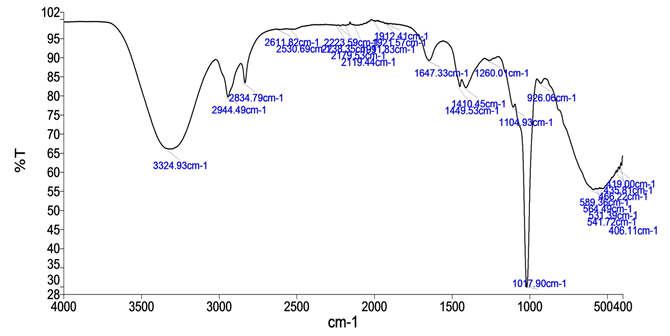
Fourier transform infrared (FTIR) spectroscopy is a vibration spectroscopic technique that utilizes the infrared radiation to vibrate molecular bonds within the sample that absorbs it. Since most of the examples have different sub-atomic bonds or unique arrangements of sub-atomic bonds, FTIR enables to obtain compound data on particles included within the specimen. Based on the peak values in the region of IR radiation, the FT-IR spectrum is used to identify the functional groups of the active components present in the extract. When the concentrate is subjected to the FTIR, the practical groups of the components are separated, providing a clear glimpse of its peak percentage. The methanolic extract contains a number of chemical components, including alcohol, alkanes, aromatic carboxylic acids, halogen compounds, and alkyl halides, according to the results of FT-IR spectroscopy.
The Tables 4&5, Figure 4 show that the methanolic extract of Tupistra chinensis rhizome contains 23 functional groups that have been identified. The H-bonded, O-H stretching vibration, and PO3 stretching are attributed to the strong instance peaks at 3324.93 and 1017.90 cm-1, respectively. By using FTIR analysis, the active components are determined based on the peak value in the infrared radiation region and the functional group identification. The functional groups of the components are separated based on the peak ratio after the Tupistra chinensis methanolic rhizome extract is subjected to FTIR spectroscopy. The results of FTIR analysis confirm the presence of functional groups such as non bonded, O-H stretch, carboxylic group, acidic, H bonded, C-H stretch, asymmetric stretching of – CH (CH2) vibration, C=N (stretch), carbon-carbon triple bond, multiple bonding, carbonyl compound frequency, C=O stretch, C=C stretch, O-H bend, alcoholic group, C-N stretch, C-O stretch, PO3 stretch, =C-H bending and C-Cl. Which shows the major peak values of 3324.93, 2944.49, 2834.79, 2611.82, 2530.69, 2238.35, 2223.59, 2179.53, 2119.44, 1991.83, 1921.57, 1912.41, 1647.33, 1449.53, 1410.45, 1260.01, 1104.93, 1017.9, 926.06, 589.36, 564.49, 541.72, 531.39 cm-1 respectively in the Tables 4&5, Figure 5. The presence of phosphate ion in the Tupistra chinensis rhizome extract is confirmed by an intense band at 1017.9 cm-1 that corresponds to the PO3 stretch vibration. The wax comprised of numerous different species contains alkane molecules. They guard the plant against water loss, defend it from bacteria, prevent the rain from leaching valuable minerals, and keep out dangerous insects and fungi [13]. Carboxylic acids are crucial in the body’s overall ability to produce fat.
| Wave Number cm-1 (Test Sample) | Wave Number cm-1 (Reference article) | Functional Group Assignment | Expected Phytocomponents Identified | |
|---|---|---|---|---|
| 1 | 3324.93 | 3570-3200 | H-bonded, O-H stretch | Hydroxy compound, alcohols, phenols |
| 2 | 2944.49 | 3500-2400 | O-H stretch, Carboxylic group, Acidic | Carboxylic acids |
| 3 | 2834.79 | 3500-2400 | O-H stretch, Carboxylic group, Acidic | Carboxylic acids |
| 4 | 2611.82 | 3500-2400 | O-H stretch, Carboxylic group, Acidic | Carboxylic acids |
| 5 | 2530.69 | 3500-2400 | O-H stretch, Carboxylic group, Acidic | Carboxylic acids |
| 6 | 2238.35 | 2248-2376 | C=N (stretch) | Nitriles |
| 7 | 2223.59 | 2260-2100 | Carbon-Carbon triple bond | Terminal alkynes |
| 8 | 2179.53 | 2260-2100 | Carbon-Carbon triple bond | Terminal alkynes |
| 9 | 2119.44 | 2260-2100 | Carbon-Carbon triple bond | Terminal alkynes |
| 10 | 1991.83 | 2100-1800 | Carbonyl compound frequency | Transition metal carbonyls |
| 11 | 1921.57 | 2100-1800 | Carbonyl compound frequency | Transition metal carbonyls |
| 12 | 1912.41 | 2100-1800 | Carbonyl compound frequency | Transition metal carbonyls |
| 13 | 1647.33 | 1650-1600 | C=O stretching | Ketone compound |
| 15 | 1410.45 | 1410-1310 | O-H bend, Alcoholic group | Phenol or tertiary alcohol |
| 16 | 1260.01 | 1210-1320 | C-O stretch | Acid |
| 17 | 1104.93 | 1360-1210 | C-N stretch | Amine |
| 18 | 1017.9 | 1100-1000 | PO3 stretching | Phosphate ion |
| 19 | 926.06 | 1000-675 | =C-H bending | Alkene |
| 20 | 589.36 | 620-490, 730-500 | C-I, C-Cl | Halogen compound (Chloro compound, Iodo compound), alkyl halides |
| 21 | 564.49 | 620-490, 730-500 | C-I, C-Cl | Halogen compound (Chloro compound, Iodo compound), alkyl halides |
| 22 | 541.72 | 620-490, 730-500 | C-I, C-Cl | Halogen compound (Chloro compound, Iodo compound), alkyl halides |
| 23 | 531.39 | 620-490, 730-500 | C-I, C-Cl | Halogen compound (Chloro compound, Iodo compound), alkyl halides |
Table 4: FTIR interpretation of compounds of methanolic extract of Tupistra chinesis rhizome.
GC-MS Analysis
| Peak | RT | Compound Name | M.W. | Formula | CAS |
|---|---|---|---|---|---|
| 1 | 8.298 | Hexyl butane-1-sulfonate | 222.35 | C10H22O3S | 900309-15-3 |
| 2 | 11.905 | 1-cyclohexylpropan-2-one | 140.22 | C9H16O | 3664-75-3 |
| 3 | 12.754 | 3,5-dihydroxy-2-(4-hydroxyphenyl)-7-methoxy-8- methylchromen-4-one | 314.29 | C17H14O6 | 281676-71-9 |
| 4 | 16.835 | 3-hydroxytetradecanoic acid | 244.37 | C14H28O3 | 900357-85-7 |
| 5 | 19.964 | (2E)-3,7-dimethylocta-2,6-dien-1-ol | 154.25 | C10H18O | 38468-47-2 |
| 6 | 20.383 | 1-(2,6-dihydroxy-4-methoxy-3-methylphenyl) butan-1-one | 224.25 | C12H16O4 | 900330-55-8 |
| 7 | 23.002 | heptadec-16-ene-1,2,4-triol | 286.4 | C17H34O3 | 900383-13-5 |
| 8 | 25.285 | 2-hydroxyoctadecanoic acid | 300.5 | C18H36O3 | 900383-13-6 |
| 9 | 27.96 | ethyl 2-acetylheptanoate | 200.27 | C11H20O3 | 900383-25-5 |
| 10 | 28.417 | (Z)-hexadec-9-enoic acid | 254.41 | C16H30O2 | 900293-47-0 |
Table 5: Composition of phytocomponents in the methanolic extract of rhizome of Tupistra chinensis.
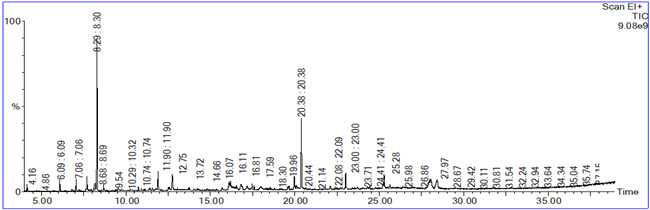
The results pertaining to GC-MS analysis of the methanolic extract of Tupistra chinensis rhizome lead to the identification of a number of compounds. These compounds were identified through mass spectrometry attached with GC. The various components present in the rhizome of Tupistra chhinenis that were detected by the GC-MS. Hexyl butane-1-sulfonate, 1-cyclohexylpropan- 2-one, 3,5-dihydroxy-2-(4-hydroxyphenyl)-7-methoxy- 8-methylchromen-4-one, 3-hydroxytetradecanoic acid, (2E)-3,7-dimethylocta-2,6-dien-1-ol, 1-(2,6-dihydroxy- 4-methoxy-3-methylphenyl)butan-1-one, heptadec- 16-ene-1,2,4-triol, 2-hydroxyoctadecanoic acid, ethyl 2-acetylheptanoate, (Z)-hexadec-9-enoic acid were present in the methanolic extracts of Tupistra chinensis. The compound 3,5-dihydroxy-2-(4-hydroxyphenyl)-7- methoxy-8-methylchromen-4-one indicates the presence of Tupichinol E in the methanolic extract of Tupistra chinensis rhizome.
The GC-MS spectrum confirmed the presence of various components with different retention times as illustrated in Figure 5. The mass spectrometer analyzes the compounds eluted at different times to identify the nature and structure of the compounds. The large compound fragments into small compounds giving rise to appearance of peaks at different m/z ratios. These mass spectra are fingerprint of that compound which can be identified from the data library.
The present study helps to predict the formula and structure of 10 biomolecules. Further investigation may lead to isolation of bio-active compounds and their structural elucidation and screening of pharmacological activity will be helpful for further drug development.
Invitro Analysis
Tupichinol E Inhibited The Growth of MCF-7 Cells in Vitro: Using the MTT assay, Tupichinol E’s inhibitory effects on MCF-7 cell growth were investigated. We analysed how Tupichinol E affects the growth and development of MDA-MD-231 cells. Different Tupichinol E concentrations displayed a time- and dose-dependent reduction of MCF- 7 cell proliferation when compared to untreated cells (considered to be 100% alive) in the concentration range of 35–280 mol/L (Figure 5A). Tupichinol E exposure to MCF-7 cells at concentrations of 100 mol/L and 200 mol/L for 24 hours resulted in a significant decline in viability from 100% to 78% and 48% of untreated control levels, respectively. Additionally, viability dropped from 100% to 33% and 18%, respectively, after 48 hours of treatment with Tupichinol E at 100 mol/L and 200 mol/L. The IC50 values for Tupichinol E were 85.05±1.08 μmol/L for 48 h, and 50.52±1.06 μmol/L for 72 h treatment (Figure 5B), suggesting a dose-dependent inhibition of growth, while Tupichinol E was not so toxic to MDA-MB-231 cells (Figure 5B), for the IC50 values was 202±1.15 μmol/L for 48 h treatment (Figure 5C).
![Figure 5: The presence of phosphate ion in the Tupistra chinensis rhizome extract is confirmed by an intense band at 1017.9 cm-1 that corresponds to the PO3 stretch vibration. The wax comprised of numerous different species contains alkane molecules. They guard the plant against water loss, defend it from bacteria, prevent the rain from leaching valuable minerals, and keep out dangerous insects and fungi [13]. Carboxylic acids are crucial in the body’s overall ability to produce fat.](/fulltextimages/11545/fig_5.png)
Figure 5: Tupichinol E inhibits the growth of MCF-7 and MDA-MB-231 cells. Tupichinol E at concentrations of 0, 25, 50, 100, 150, and 200 μmol/L was applied to MCF-7 (A) and MDA-MB-231 (B) cells for 24 hours, 48 hours, and 72 hours. The MTT assay was used to track cell viability. The following formula was used to determine the viability percentage: (viable cells) %=(OD of drug-treated sample/OD of untreated sample)×100. Mean±SD. n=3. (C) Tupichinol E’s IC50 values in MCF-7 and MDA-MB-231 cells.
Tupichinol E Induced Apoptosis of MCF-7 Cells and Increased the Caspase 3 Activity: The apoptosis of MCF- 7 cells treated with different concentrations of Tupichinol E (50, 100, and 200 μmol/L) for 24 hours was examined using Annexin V-FITC/PI double-labeled flow cytometry in order to analyse the mechanism of growth inhibition of MCF-7 cells by Tupichinol E. The overall amount of early and late apoptosis was the apoptosis rate. Figure 6A shows that MCF- 7 cells treated with 50 μmol/L of Tupichinol E and untreated cells showed minimal Annexin-V binding. However, following a 24-hour treatment with 100 and 200 μmol/L of Tupichinol E, the apoptosis rate was approximately 25.2% and 24.6%, respectively Figure 6B. Changes in the expression and activity of many apoptotic markers are indicative of apoptosis. Proapoptotic proteins (Bcl-10, Bax, etc.) and anti-apoptotic proteins (Bcl-2, Bcl-xL, etc.) are members of the Bcl-2 family of proteins that regulate and govern apoptotic mitochondrial events. Using Western blot, the expression levels of Bcl-2 and Bax are found. Following Tupichinol E treatment, the results revealed no change in the expression of Bcl-2 and Bax in MCF-7 cells (Figure 6C). Cell death is brought on by caspases. Consequently, we used Western blot analysis to ascertain Tupichinol E’s impact on caspase expression. The findings showed that following Tupichinol E therapy, caspase 3 activity was up-regulated (Figure 6C).
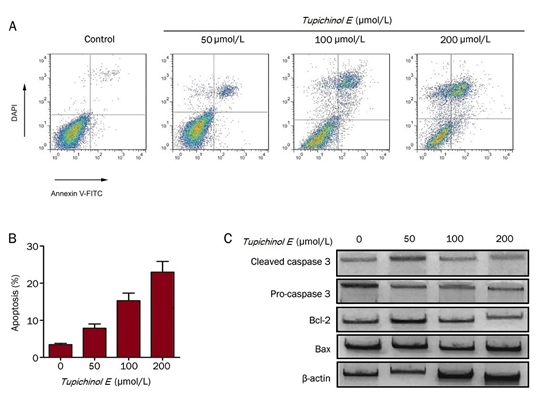
Figure 6: Tupichinol E caused MCF-7 cells to undergo apoptosis by upregulating caspase 3. (A) For a duration of 24 hours, Tupichinol E (0, 50, 100, and 200 μmol/L) was applied to MCF-7 cells. An assay for double staining with Annexin V-FITC/PI was used to detect the induction of apoptosis. (B) Annexin V+ (PI-positive and PI-negative) cells were used to quantify apoptotic cell death. n = 3. Mean±SD. bP<0.05, cP<0.01. (C) Western blot analysis of MCF-7 cells treated with or without Tupichinol E, showing the presence of caspase 3, Bcl-2, and Bax.
Tupichinol E Caused the Accumulation of the Cells in G2/M Phase: Following a 24-hour incubation period with varying concentrations of Tupichinol E (0, 50, 100, and 200 μmol/L), FCM was used to analyse the cell cycle distributions. We discovered that there were minor alterations in the G0/ G1 phase cell population and an increase in the proportion of cells in the G2/M phase with an increase in the dose of Tupichinol E (Figure 87A). The percentage of cells in the G2/M phase increased to 7.3% and 15.5%, respectively, after being incubated with 100 and 200μmol/L Tupichinol E for 24 hours (Figure 7B).
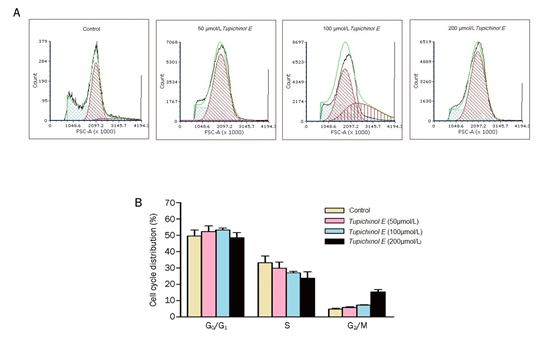
Figure 7: Tupichinol E may have reduced cyclin B1 expression, which led to the cells’ accumulation in the G2/M phase. (A) MCF-7 cells were subjected to a 24-hour treatment of Tupichinol E at 0, 50, 100, and 200 μmol/L. Following a wash, fixation, staining with propidium iodide, and flow cytometry analysis, the cells were examined for DNA content. There was only one example result displayed. (B) The percentage of cells in each cell cycle phase following treatment with Tupichinol E. n = 4. Mean±SD. bP<0.05, cP<0.01.
Molecular Docking
The docked model with the lowest binding energy and greatest binding affinity denotes the most stable binding between the ligand and the target protein. Ligands with significant binding affinities were chosen. The interactions of Osimertinib and Tupichinol E with EGFR are noticed in Figures 8&9, which displayed binding energies of -107.23 and -98.89, respectively. Similarly, the molecular interactions between Tupichinol E and Osimertinib compound HER2 are noticed in Figures 10&11. So the molecules EGFR-Tupichinol E and HER2-Tupichinol E displays higher affinity -21.85 kcal/ mol and -11.02 kcal/mol in [24].
H-bond (conventional and carbon), π-sigma, alkyl and π-alkyl and predominately Van der Waals forces were the interactions evident in compounds and the EGFR active site.
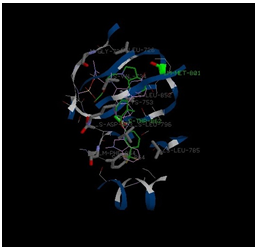
Osmertinib-EGFR Complex: Docking of Osmertinib with EGFR Complex displayed an affinity for binding of -107.23 kcal/mol. The ligand exhibited Van der Waals force with PHE-723, GLU749, ARG836, ARG858, GLY873, GLY874, LYS875 (Figure 8).
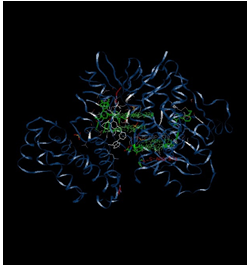
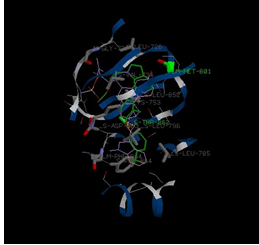
Tupichinol E- EGFR Complex: Docking of Tupichinol E with EGFR Complex displayed an affinity for binding of -98.89 kcal/mol. The ligand exhibited H-bonding with ARG858, LYS860, TYR869, GLU872, GLY874. The ligand establishes Van der Waals force with PHE723, ARG836, GLY857, ARG858, GLY873, GLY874 (Figure 9).
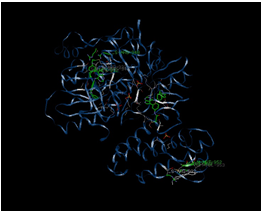
Osmertinib-HER2 Complex: Docking of Docking of Osmertinib with HER2 Complex displayed an affinity for binding of -114.37 kcal/mol. The ligand exhibits H-bonding with LYS 736 and PRO 802. The ligand establishes Van der Waals force with LEU726, VAL734, LEU800, PRO802, TYR803, GLY804, LEU852, THR862 (Figure 10).
Tupichinol E-HER2 Complex: Docking of Tupichinol E with HER2 Complex displayed an affinity for binding of −99.25kcal/mol. The ligand exhibited H-bonding with VAL797, ASP863. The ligand establishes Van der Waals force with LEU726, VAL734, LYS753, THR798, LEU852, THR862 (Figure 11, Table 6).
| Sl No. | Compound | Energy | Protein-ligand Interaction | H Bond |
|---|---|---|---|---|
| EGFR- Osmertinib | -107.2 | -106.03 | -1.21 | |
| EGFR- Tupichinol E | -98.89 | -72.39 | -21.85 | |
| HER2- Osmertinib | -114.4 | -108.34 | -6.73 | |
| HER2- Tupichinol E | -99.25 | -88.23 | -11.02 |
Table 6: Binding affinity of compounds.
Tupichinol E showed high binding affinity for HER2 and EGFR Complex thereby suggesting that this compound is required for inhibiting cancer, and these could be validated as drugs for cancer treatment. According to reports, these anti-EGFR medications showed significant effects in a variety of therapeutic clinical situations [25].
Conclusion
Tupichinol E is a significant anticancer compound that have been demonstrated in various cell types. However, Tupichinol E’s anticancer efficacy and mode of action on breast cancer cells are still unknown. First, our findings demonstrated that Tupichinol E exhibited considerable in vitro cytotoxicity against MCF-7 cells. It was demonstrated that Tupichinol E caused MCF-7 cells to undergo apoptosis in a way that was dose-dependent. We investigated to determine how Tupichinol E affected the expression levels of the Bcl-2 family, which controls mitochondrial apoptosis.
This family includes the pro-apoptotic Bax and the anti- apoptotic Bcl-2. Overexpression of Bax causes cells to undergo apoptosis more quickly in response to death signals, whereas overexpression of Bcl-2 causes cells to heterodimerize with Bax and suppress cell death. The Bcl-2 pathway is not required for the apoptosis that Tupichinol E induces in MCF-7 cells, as evidenced by the lack of change in Bax and Bcl-2 protein levels after exposure to the drug. We discovered that MCF-7 cells may undergo apoptosis as a result of the up-regulation of caspase 3 activity. Important cell cycle regulators are proteins that belong to the cyclin family. Cyclins bind and activate members of the cyclin-dependent kinase (Cdk) family to control cell cycle progression.
And in molecular docking Tupichinol E has been proven to be a viable therapeutic target for the treatment of breast cancer and increases expression with point mutations like L858R and erbB2 that are correlated with disease progression. As a result, the TKI directed therapy against receptors can inhibit tumor growth at different stages, ensuring the specificity of treatment and selectivity. According to molecular interaction, Osmertinib exhibits high affinity for mutant EGFR and HER2 [26, 27]. Osmertinib shows binding energy -107.23 kcal/mol with EGFR, while for HER2 complex it was - 114.37 kcal/mol. Additionally, it has been observed that the interaction between the Osmertinib structure and R841 results in the formation of π- alkyl bond with indole group of the structure, H- bond and C-H-bond interactions and shows Van der waals forces of interaction. Tupichinol E shows binding energy -98.89 kcal/mol with EGFR, while for HER2 complex it was -99.25kcal/mol. Additionally, it has been observed that the interaction between the Tupichinol E structure and R841 results in the formation of π-alkyl bond with indole group of the structure, H-bond and C-H- bond interactions and shows Van der waals forces of interaction. Osmertinib has already received approval to treat a number of cancer kinds. Tupichinol E is a pharmacologically active compound which can be used against cancer because of their potent activity. The last 20% of the trajectory has an average of 8.5 interactions. Throughout the course, the occupancy of the various π-staking interactions (π-alkyl, π-amide, π- lone pair, and π-S) is 150% [28]. Tupichinol E therefore reacted hydrophobically (in a docking study) with at least 8 of the amino acids in the active site to achieve stability at the binding site. Since the occupancy value in this case is greater than 100%, any one of the eight amino acids can interact with Tupichinol E through more than one of the earlier mentioned non-covalent interactions [29, 30].
In conclusion, Tupichinol E can inhibit tumor growth by inducing cell apoptosis and cell cycle blockage. Further studies will need to be carried out to determine the exact mechanisms of the antitumor action of Tupichinol E in-vivo, and to investigate how it can be used in cancer therapy alone or combination with other antitumor drugs.
Acknowledgement
This work is financially supported by Bayers Fellowship program.
Conflict Of Interest
No conflict of interest.
References
-
Saxena M, Saxena J (2012) Evalution of phytoconstituents of Acorus Calamus by FTIR and UV-Vis spectroscopic analysis. International Journal of Biological & Pharmaceutical Research 3(3): 498-501.
-
Maobe MGA, Nyarango RM (2013) Fourier Transformer Infra-Red Spectrophotometer Analysis of Urtica dioica Medicinal Herb Used for the Treatment of Diabetes, Malaria and Pneumonia in Kisii Region, Southwest Kenya. World Applied Sciences Journal 21(8): 1128- 1135.
-
Grube M, Muter O, Strikauska S, Gavare M, Limane B (2008) Application of FT‐IR spectroscopy for control of the medium composition during the biodegradation of nitro aromatic compounds. Journal of Indian Microbiology and Biotechnology 35(11): 1545-1549.
-
Subashini MS, Rajendran P, Ashok G, Kanthesh BM (2015) TLC, FTIR and GCMS analysis of leaves of Gymnema sylvestre R.Br from Kolli Hills, Tamil Nadu, India. International Journal of Current Microbiology and Applied Sciences 4(7): 757-764.
-
Agatonovic Kustrin QS, Morton DW, Yusof AP (2013) The Use of Fourier Transform Infrared (FTIR) Spectroscopy and Artificial Neural Networks (ANNs) to Assess Wine Quality. Modern Chemistry & Applications 1(4): 110.
-
Jiang Su New Medical College (1979) Dictionary of Traditional Chinese Crude Drugs. Shanghai Scientific Technologic Shanghai, China, pp: 907.
-
Zhan YH (1994) China Shennongjia resources of medicinal plants. Wuhan: Hubei Scientific and Technological Press, 1994.
-
Qiao M, Liang Z, Gong YL (2009) Research progress on chemical constituents and activities of Tupistra of Liliaceae. Journal of Hubei College of Traditional Chinese Medicine 11: 59-62.
-
Harborne JB (1998) Phytochemical Methods; A guide to modern techniques of plant analysis. Chapman & Hall, London, USA, pp: 182 -189.
-
Khandelwal KR (2005) Practical Pharmacognosy Techniques and Experiments. 13th (Edn.), Nirali Prakashan, Pune, India, pp: 130-149.
-
Stahl E (2007) Thin Layer Chromatography: A Laboratory Handbook. 2nd Indian Reprint, Springer-Verlag Berlin Heidelberg New York, USA, pp: 60-102.
-
Harborne JB (1998) Phytochemical methods: A guide to modern techniques of plant Analysis. 3rd (Edn.), Springer (India) Pvt Ltd, New Delhi, India, 14: 110-114.
-
Deore SL, Nikole K, Baviskar BA, Khadabadi SS (2013) J Chromatograph Separat Techniq 4(6): 1-4.
-
Chourasiya A, Upadhayay A, Shukla RN (2012) Journal of Pharmaceutical and biomedical sciences 25: 179-181.
-
Hemmalakshmi S, Priyangaa S, Devaki K (2017) Fourier Transform Infra-Red Spectroscopy Analysis of Erythrina variegata L. J Pharm Sci & Res Vol 9(11): 2062-2067.
-
Hong X, Liu Y, Hu G, Zhao D, Shen J, et al. (2009) EBAG9 inducing hyporesponsiveness of T cells promotes tumor growth and metastasis in 4T1 murine mammary carcinoma. Cancer Sci 100(5): 961-969.
-
Contreras-Puentes N, Mercado-Camargo J, Alvíz-Amador A (2019) In-silico study of ginsenoside analogues as possible BACE1 inhibitors involved in Alzheimer’s disease. F1000 Research 8: 1169.
-
Takezawa K, Pirazzoli V, Arcila ME, Nebhan CA, Song X, et al. (2012) HER2 amplification: a potential mechanism of acquired resistance to EGFR inhibition in EGFR-mutant lung cancers that lack the second-site EGFRT790M mutation. Cancer Discov 2(10): 922-933.
-
Trott O, Olson AJ (2010) Software News and Update AutoDock Vina: Improving the Speed and Accuracy of Docking with a New Scoring Function, Efficient Optimization, and Multithreading. J Comput Chem 31(2): 455-461.
-
Teli MK, Rajanikant GK (2012) Identification of novel potential HIF-prolyl hydroxylase inhibitors by in-silico screening. Mol Divers 16(1): 193-202.
-
(2016) Dassault Systemes BIOVIA. Discovery Studio Visualizer 4(5): 2016.
-
Hanan EJ, Eigenbrot C, Bryan MC, Burdick DJ, Chan BK, et al. (2014) Discovery of selective and noncovalent diaminopyrimidine-based inhibitors of epidermal growth factor receptor containing the T790M resistance mutation. J Med Chem 57(23): 10176-10191.
-
Lenferink AEG (1998) Differential endocytic routing of homo- and hetero-dimeric ErbB tyrosine kinases confers signaling superiority to receptor heterodimers. EMBO J 17(12): 3385-3397.
-
Girard N (2019) Optimizing outcomes in EGFR mutation- positive NSCLC: which tyrosine kinase inhibitor and when?. Future Oncol 14(11): 1117-1132.
-
Kanthala SP (2017) A peptidomimetic with a chiral switch is an inhibitor of epidermal growth factor receptor heterodimerization. Oncotarget 8(43): 74244- 74262.
-
Aggarwal S, Patil S, Rohtagi N (2017) Epidermal growth factor receptor T790M mutation: a major culprit in the progression of epidermal growth factor receptor-driven non-small cell lung cancer and the role of repeat biopsy. Indian J Cancer 54: 15-24.
-
Tanaka K (2017) Acquisition of the T790M resistance mutation during afatinib treatment in EGFR tyrosine kinase inhibitor-naïve patients with non-small cell lung cancer harboring EGFR mutations. Oncotarget 8(40): 68123-68130.
-
Sepay N, Mondal R, Al-Muhanna MK, Saha D (2022) Identification of natural flavonoids as novel EGFR inhibitors using DFT, molecular docking, and molecular dynamics. New Journal of Chemistry 46(20): 9735-9744
-
Teli MK, Rajanikant GK (2012) Identification of novel potential HIF-prolyl hydroxylase inhibitors by in-silico screening. Mol Divers 16(1): 193-202.
-
Kumar S, Jena L (2014) Understanding Rifampicin Resistance in Tuberculosis through a Computational Approach. Genomics Inform 12(4): 276-282.
- Solution-Processed Chiral Perovskites for Biomedical Applications
- Nanotechnology in Health Chemistry and Medicine: Current Challenges and Future Directions
- Human Exposure to Micro- and Nanoplastics: Pathways, Toxicity, and Intervention Strategies
- Exosome Nanomedicine for Cancer Therapy
- Micro and Nanoplastics–Plastisphere, Biotoxicity, Impact on Human Health, and Mitigation Strategies
- Process Validation of Cefixime Powder for Suspension Dosage Form, 50 mL