Simulated Nighttime Grinding of 3D Printed Night Guards vs Lab Manufactured Night Guards
Objective: To compare the wear of two different 3D printed resins and a lab manufactured night guard. Methods: Three different materials were tested for their ability to stand up to simulated nighttime grinding. The materials tested were (n=30): Flex: SprintRay Night Guard Flex (SprintRay, Los Angeles, CA), Firm: SprintRay Night Guard Firm (SprintRay, Los Angeles, CA), and NGP: Clear Splint Biocryl 2mm (Great Lakes Orthodontic, Tonawanda, NY). The materials tested were formed into 10mm cubes. Flex and Firm groups were made using the SprintRay Pro55 3D printer, according to manufacturer specifications then polished using silicon carbide grinding papers of 240 and 600 grit with water (Buehler, IL, USA). The NGP group was made with a sheet of 2mm Clear Splint Biocryl plastic placed over a template block in a Biostar V pressure molding machine to replicate the same dimensions as the Flex and Firm groups. The surface roughness of each sample was measured using the Profilometer - Roughness Tester PCE-RT 1200 (PCE Instruments) and marked as initial surface roughness (Ra1). After the wear test, another surface roughness test was measured with the Profilometer and marked as the final surface roughness score (Ra2). In addition, all the specimen of each material were analyzed before and after the test with a 3D laser profilometry TMS-500 Top Map Pro.Surf (Polytec GmbH, Germany). These measurements, prior to the wear test were the initial surface area roughness (Sa1) and the final surface area roughness (Sa2). Enamel antagonists (molars cusps) were prepared from caries-free extracted molars. Four cusps were collected from each tooth. Standardization of the enamel antagonists for shape and size were done by using a diamond bur and high-speed handpiece under water irrigation. The enamel cusps were randomized between three groups. The wear test was performed using a wear simulator developed by the Tufts University School of Engineering. To simulate wear the samples were run through 20,000 cycles roughly equivalent to one-month of normal wear, under a load of 25N. Specimen and antagonists were lubricated with water. Results: The change in roughness/wear (before-after) for each of the three groups (Firm, Flex and NGP) was calculated. Descriptive statistics were calculated for wear, the NGP group showed the highest wear with a mean±SD of -0.94±0.55 for stylus profilometry and -0.92±0.90 for the laser analysis. The Shapiro-Wilk test showed that the data for one of the three groups was not normally distributed; a Kruskal-Wallis test was conducted to assess the difference in wear between the three groups. The Kruskal-Wallis test showed a statistically significant association between group and wear, p<0.0001. The Dunn’s test along with the Bonferroni correction used to perform pairwise comparisons showed that there was a statistically significant difference between the Firm and NGP groups (p=0.004 stylus) and (p=0.014 laser) as well as the Flex and NGP groups (p<0.0001). There was no statistically significant difference between the Firm and Flex groups (p=0.612 stylus) and (p=0.443 laser). The statistical significance for within group differences was assessed using the Paired t-test for the Firm and NGP groups, and the Wilcoxon signed-rank test for the Flex group. The within group difference in the NGP group was statistically significant (p=0.0004 stylus) and (p=0.022 laser). Conclusion: Under these in vitro study conditions, Flex and Firm showed more resistance to wear than NGP. There was no statically significant difference between Firm and Flex groups.
Introduction
Bruxism is a common condition that entails grinding of the teeth or clenching of the jaw. The prevalence of bruxism is 8% - 31.4% [1, 2] and it can occur in individuals that are awake or asleep. Night-time bruxism is a multifactorial process and has been associated with stress as well as altered sleep patterns6. This parafunctional habit contributes to dental attrition, the wear of tooth structure from the teeth sliding against each other, as well as temporomandibular disorders. Temporomandibular disorders (TMD) have multiple and broad clinical effects on orofacial structures and are often diagnosed in patients with a prevalence between 5% and 12% [3, 4, 5]. Among treatment options, occlusal splints, also known as oral appliances, oral orthotics, and night guards are the most common therapeutic procedures (68%) and allow interesting clinical outcomes, as they were shown to reduce 70%–90% of the TMD symptoms successfully [4, 5, 6, 7, 8, 9]. Nightguard devices have been advocated as a means of decreasing or preventing occlusal attrition and relaxing masticatory muscle activity caused by diurnal or nocturnal bruxism [10]. Additionally, the occlusal splints provide biomechanical equilibrium for the jaw and the temporomandibular joint [11].
The night guard or occlusal splint is a removable appliance that covers the surfaces of the patient’s teeth. These appliances are conventionally fabricated with polyethylene (PVAc-PE), acrylic resin, or polymethylmethacrylate (PMMA) by an analog workflow including refractory cast [12]. Although these materials display interesting properties, they are not considered ideal for a variety of reasons including thermal irritation unpleasant taste, dimensional changes, time consuming process, residual monomers, unfavorable shape or color, susceptibility to fracture, among many others [13, 14]. Accordingly, digital dentistry has open new area of research and development to overcome these limitations [15]. Nowadays these appliances can be fabricated by the use of a (complete) digital workflow, applying subtractive as well as additive CAD/CAM methods [16, 17, 18]. Digital occlusal splints have been reported to have advantages over conventional ones due to superior materials and fabrication methods [17]. These materials are considered as interesting options for occlusal splints, as they are high-performance-polymers with less susceptibility to fracture, reducing individual human errors during technical processes, and exhibiting superior material properties to those of conventional ones [7]. Furthermore, these materials have shown superior performance over traditional ones in terms of fit, quantitative control, time-saving, speed, and dimensional stability [16, 19, 20].
However, evidence of resistance to wear of these new 3D printed materials compared to conventional plastic night guards is scarce. Therefore, the aim of this study was to compare the wear of two different 3D printed resins and a lab manufactured night guard.
Methods
Three different materials were tested for their ability to stand up to simulated nighttime grinding. The three materials tested were (n=30):
- Group 1 - Sprint Ray Night Guard Flex (Sprint Ray, Los Angeles, CA)
- Group 2 - Sprint Ray Night Guard Firm (Sprint Ray, Los Angeles, CA)
- Group 3 - Clear Splint Biocryl 2mm (Great Lakes Orthodontic, Tonawanda, NY) With 10 specimens in each group, all 30 samples were the following dimensions, 10x10x10 mm. The 3D printed samples were made using the Sprint Ray Pro55 3D printer. After printing, the specimens were cleaned with 96% Isopropyl alcohol for 5 minutes according to manufacture specifications and dried with forced air. Once dried they were polymerized for 15 minutes in curing unit set at 30°C. The surfaces of all 3D printed materials were polished using special silicon carbide grinding papers of 240 and 600 grit with water (Buehler, IL, USA). The traditional lab manufactured nightguard material were made with a sheet of 2mm Clear Splint Biocryl plastic. A template block was placed in a Biostar V pressure molding machine to replicate the same dimensions and the excess was trimmed off after cooling.
Wear Measurement
Prior to the wear test, the surface roughness of each sample was measured using the Profilometer- Roughness Tester PCE-RT 1200 (PCE Instruments). These measurements were the initial surface roughness (Ra1). After the wear test, another surface roughness test was measured with the Profilometer - Roughness Tester PCE-RT 1200 (PCE Instruments). These measurements are the final surface roughness (Ra2) [21]. In addition, all the specimen of each material were analyzed before and after the test with a 3D laser profilometry TMS-500 Top Map Pro.Surf (Polytec GmbH, Germany) [22]. These measurements, prior to the wear test were the initial surface area roughness (Sa1) and the final surface area roughness (Sa2).
Antagonist Enamel
All collected teeth were manually cleaned and stored in a 10% bleach solution for 5 days, according to OSHA disinfection standards. After proper disinfection, teeth were store in deionized water until ready to be used for the wear test.
Enamel antagonists (molars cusps) were prepared from caries-free extracted molars as mentioned above. Four cusps were collected from each tooth. Standardization of the enamel antagonists for shape and size was done by using a diamond bur and high-speed handpiece under water irrigation. Schematic representation of preparing antagonist enamel is show in Figure 1 [23]. According to Krejci I, et al. standardization of enamel cusps did not reduce the variation of the resulting wear compared with that of non-standardized enamel antagonists. Natural enamel antagonists are preferable for the simulation of wear in the occlusal contact area [24]. Therefore, for this study, the enamel cusps were randomized.
![Figure 1: Schematic representation of preparing enamel antagonist [23].](/fulltextimages/8353/fig_1.png)
Wear test
The wear test was performed using a wear simulator develop by the Tufts University School of Engineering. For the wear test, extracted human molars teeth were collected and used as the antagonists. Each enamel specimen was mounted on a specimen holder using auto-polymerizing resin (Caulk Orthodontic Resin, DENTSPLY Caulk, NC, USA). Enamel antagonist and opposing splint resin material were mounted on the wear simulator Figure 2.
To simulate wear the antagonists (enamel molar cusps) ran back and forth 8mm (average lateral excursion in the bruxism group) [25] for 20,000 cycles to resemble aging of one month of clinical performance, assuming total grinding time of 320 seconds per night (40 seconds per hour of sleep/ average 8 hours of sleep/night) [26] under a load of 25 N. Specimen and antagonists were lubricated with water which was dispensed regularly throughout the test.
![Figure 2: To simulate wear the antagonists (enamel molar cusps) ran back and forth 8mm (average lateral excursion in the bruxism group) [25] for 20,000 cycles to resemble aging of one month of clinical performance, assuming total grinding time of 320 seconds per night (40 seconds per hour of sleep/ average 8 hours of sleep/night) [26] under a load of 25 N. Specimen and antagonists were lubricated with water which was dispensed regularly throughout the test.](/fulltextimages/8353/fig_2.png)
Sample size
The statistical software Stata 15 was used for sample size calculation. Sample size was calculated for the Ra change using results from a previous study that compared surface roughness and wear behavior of occlusal splint materials [27]. The authors reported a Ra changes of 0.749 ± 0.134. To detect a Ra change difference of at least 25% between two groups, a minimum sample of 20 specimens (n=10 per group) will achieve a power of 80% and significance level of 0.05. A total of 30 specimens will be needed for 3 groups in the proposed study.
Data Analysis
Descriptive statistics (Means ± SD) was calculated for localized wear. One-way ANOVA with Tueky’s post hoc test was used to compare the wear between groups. Significance level was set at 0.05. Stata version 15 was used for analysis.
Results
To evaluate the simulated nighttime grinding of each material, surface roughness was measured with two types of profilometer analysis: stylus profilometry and a Laser 3D profilometry.
Stylus Profilometry Results
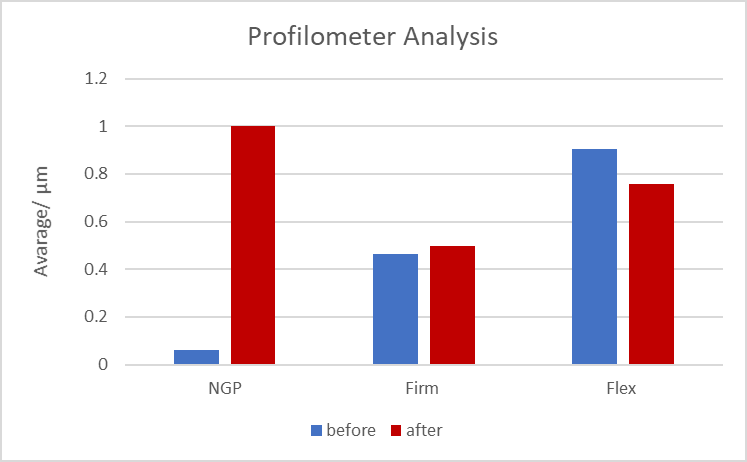
The change in roughness/wear (before-after) for each of the three groups (Firm, Flex and NGP) was calculated. Descriptive statistics were calculated for wear, the NGP group showed the highest wear with a mean ± SD of -0.94±0.55. The
Shapiro-Wilk test showed that the data for one of the three groups was not normally distributed; a Kruskal-Wallis test was conducted to assess the difference in wear between the three groups. The Kruskal-Wallis test showed a statistically significant association between group and wear, p<0.0001. The Dunn’s test along with the Bonferroni correction used to perform pairwise comparisons showed that there was a statistically significant difference between the Firm and NGP groups (p=0.004) as well as the Flex and NGP groups (p<0.0001). There was no statistically significant difference between the Firm and Flex groups (p=0.612). The statistical significance for within group differences was assessed using the Paired t-test for the Firm and NGP groups, and the Wilcoxon signed-rank test for the Flex group. The within group difference in the NGP group was statistically significant (p=0.0004).
| Type | N | Variable | Mean | Std Dev | Minimum | Maximum | Median | Std Error | Variance | Lower 95% CL for Mean |
|---|---|---|---|---|---|---|---|---|---|---|
| Firm | 10 | Ra1-Before Wear | 0.462 | 0.074 | 0.397 | 0.620 | 0.437 | 0.023 | 0.005 | 0.409 |
| Ra2-After Wear | 0.499 | 0.101 | 0.378 | 0.644 | 0.511 | 0.032 | 0.010 | 0.426 | ||
| Change | -0.037 | 0.061 | -0.111 | 0.054 | -0.040 | 0.019 | 0.004 | -0.080 | ||
| Flex | 10 | Ra1-Before Wear | 0.904 | 0.567 | 0.301 | 1.809 | 0.566 | 0.179 | 0.322 | 0.498 |
| Ra2-After Wear | 0.758 | 0.438 | 0.447 | 1.685 | 0.520 | 0.139 | 0.192 | 0.444 | ||
| Change | 0.147 | 0.389 | -0.270 | 1.173 | 0.088 | 0.123 | 0.151 | -0.132 | ||
| NGP | 10 | Ra1-Before Wear | 0.061 | 0.015 | 0.039 | 0.090 | 0.056 | 0.005 | 0 | 0.050 |
| Ra2-After Wear | 1.001 | 0.541 | 0.452 | 1.837 | 0.764 | 0.171 | 0.23 | 0.613 | ||
| Change | -0.940 | 0.548 | -1.795 | -0.362 | -0.708 | 0.173 | 0.299 | -1.332 |
Table 1: Stylus profilometer analysis before (Ra1) and after (Ra2) wear test.
Laser 3D Profilometry Results
The change in roughness/wear surface area (before- after), using a 3D Laser profilometer, for each of the three groups (Firm, Flex and NGP) was calculated. Descriptive statistics were calculated for wear, the NGP group showed the highest wear with a mean±SD of -0.92±0.90. The Shapiro- Wilk test showed that the data for one of the three groups was not normally distributed; a Kruskal-Wallis test was conducted to assess the difference in wear between the three groups. The Kruskal-Wallis test showed a statistically significant association between group and wear (p=0.019). The Dunn’s test along with the Bonferroni correction used to perform pairwise comparisons showed that there was a statistically significant difference between the Firm and NGP groups (p=0.014). There was no statistically significant difference between the Firm and Flex groups (p=0.443) as well as the Flex and NGP groups (p=0.511). The statistical significance for within group differences was assessed using the Paired t-test for the Firm group, and the Wilcoxon signed- rank test for the Flex and NGP groups. The within group difference in the NGP group was statistically significant (p=0.022).
| Type | N | Variable | Mean | Std Dev | Minimum | Maximum | Median | Std Error | Variance | Lower 95% CL for Mean |
|---|---|---|---|---|---|---|---|---|---|---|
| Firm Flex NGP | 10 10 10 | Sa1-Before Wear Sa2-After Wear Change RS1-Before Wear Sa2-After Wear Change Sa1-Before Wear Sa2-After Wear Change | 0.507 0.517 -0.011 0.489 0.565 -0.076 0.371 1.295 -0.923 | 0.104 0.118 0.021 0.204 0.12 0.127 0.333 0.572 0.899 | 0.397 0.4 -0.052 0.117 0.265 -0.264 0.043 0.611 -1.896 | 0.677 0.729 0.02 0.835 0.667 0.168 0.755 1.94 0.114 | 0.496 0.488 -0.006 0.541 0.597 -0.065 0.334 1.364 -0.965 | 0.033 0.037 0.007 0.065 0.038 0.04 0.105 0.181 0.284 | 0.011 0.014 0 0.042 0.014 0.016 0.111 0.327 0.808 | 0.433 0.433 -0.0253 0.343 0.479 -0.167 0.133 0.885 -1.566 |
Table 2: Optical profilometry analysis before (Sa1) and after (Sa2) wear test.
Discussion
The objective of this study was to compare the wear of two different 3D printed resins and one Clear Splint Biocryl splint (NGP). The results, with both types of profilometers, stylus and 3D laser, showed a statistically significant difference in wear between the 3D printed resins (Firm and Flex) when compared to the traditionally fabricated nightguard material. However, no significant difference was found between the firm and flex 3D printed resins. Moreover, the results were slightly different between the Flex and NGP group in both profilometry analysis. When using the stylus profilometry there was statistically significant difference between the Flex and NGP groups. On the other hand, there was no statistically significant difference between those groups with the laser profilometry analysis.
Measuring surface wear is a complicated process and multiple factors contribute to it, which have been investigated by various research groups in vivo and in vitro [21, 28]. In this study we attempted to simulate the clinical situation as much as possible.
There is no agreement in the literature as to which material should be used as the antagonist in wear simulation tests [29]. Alternate materials to enamel have been used as antagonist in wear studies without significant changes in results [27, 30, 31, 32]. Therefore, in order to simulate a clinical situation, enamel cusps were chosen as the antagonist in this study.
The cusps were standardized to achieve a uniform contact area because the resulting wear is significantly altered by this factor [33]. No other aspects of the enamel cusps were standardized because previous research suggested that this did not reduce the variation of the resulting wear compared with that of non-standardized enamel [24]. The reduced variation between antagonists is desirable for the wear study therefore randomized natural enamel antagonist are preferred for the simulation of wear in the occlusal contact area [24].
The antagonists were scoured onto each of the nightguard samples for 8mm. This distance was chosen as it has been observed to be the average lateral excursions in bruxers [25]. The time for each cycle during the grinding test was set at 1.0 seconds, as this was very close to what has been reported to be the time span of each EMG (electromyographic) burst during bruxism [25].
The force used in this study was 25N and the nightguard materials were run through 20,000 cycles, to simulate one month of clinical performance, assuming total grinding time of 320 seconds per night (40 seconds per hour of sleep/ average 8 hours of sleep/night) [26]. A range of vertical load has been used in a variety of in-vitro wear studies ranging from 6.5- 49N for 1,000-100,000 cycles [27, 30, 31, 34]. The 25N vertical load was chosen as a mid-point test as this is the first study on these printed resins. Additionally, this was considered an appropriate force because bruxers often grind or clench in episodes that fluctuate in patterns of force. Although a bruxer can develop higher forces, (s) he will not do that for a long time [35].
A constant change of water removes the worn particles from the interaction zone between antagonist and material, thus reducing the effect of the worn material to act as an abrasive [29]. Due to these previous studies we chose to include a constant lubrication system in our wear testing with room temperature water.
Benli, et al. [27] evaluated subtractive resins used in computer-aided design/computer-assisted manufacturing (CAD/CAM) system and thermoforming discs. The results showed significant differences between the two materials after chewing simulation. The milled resin (PEEK) showed the lowest Ra values, while the thermoforming discs had the greatest Ra values. This result is consistent with the findings of this study where both 3D printed resins showed decrease roughness values after wear when compared to the laboratory night guard material. The materials in the Benli [27] study were tested with a non-contact profilometer while this study was performed with both stylus profilometer and laser non-contact profilometer. Both methods are valid according to Heintze [29] who found both mechanical and optical methods are suitable for quantifying the wear produced in flat specimens. In this study however a volumetric loss was not evaluated. In addition, Benli, et al. performed a higher number of cycles (60,000) and a different force which could justify the lower difference in the surface roughness between the two studies before and after wear.
Conclusion
Under these in vitro study conditions, Flex and Firm showed more resistance to wear than NGP. There was no statically significant difference between Firm and Flex groups. Descriptive statistics were calculated for wear, the NGP group showed the highest wear, in both profilometry analysis, with a mean ± SD of -0.94±0.55 for the stylus and with a mean±SD of -0.92±0.90 for the Laser 3D analysis. There was no statistically significant difference between the Firm and Flex groups (p=0.612, stylus) and (p=0.443 laser). Financial Disclosure Sponsored in part by SprintRay.
References
-
Manfredini D, Winocur E, Guarda Nardini L, Paesani D, Lobbezoo F (2013) Epidemiology of bruxism in adults: a systematic review of the literature. J Orofac Pain 27(2): 99-110.
-
Kuttila M, Niemi PM, Kuttila S, Alanen P, Le Bell Y (1998) TMD treatment need in relation to age, gender, stress, and diagnostic subgroup. J Orofac Pain 12(1): 67-74.
-
(2018) National Institute of Dental and Craniofacial Research. Prevalence of TMJD and its signs and symptoms.
-
Gil Martínez A, Paris Alemany A, Villanueva LUI, Touche RL (2018) Management of pain in patients with temporomandibular disorder (TMD): challenges and solutions. J Pain Res 11: 571-587.
-
De Laat A, Stappaerts K, Papy S (2003) Counseling and physical therapy as treatment for myofascial pain of the masticatory system. J Orofac Pain 17(1): 42-49.
-
Klasser GD, Greene CS (2009) Oral appliances in the management of temporomandibular disorders. Oral Surg Oral Med Oral Pathol Oral Radiol Endod 107(2): 212-223.
-
Okeson JP (2008) Management of temporomandibular disorders and occlusion. 6th (Edn.), St. Louis: Mosby Inc.
-
Crout DK (2017) Anatomy of an occlusal splint. Gen Dent 65(2): 52-59.
-
List T, Axelsson S (2010) Management of TMD: evidence from systematic reviews and meta-analyses. J Oral Rehabil 37(6): 430-451.
-
Solberg WK, Clark GT, Rugh JD (1975) Nocturnal electromyographic evaluation of bruxism patients undergoing short term splint therapy. J Oral Rehabil 2(3): 215-223.
-
Gholampour S, Gholampour H, Khanmohammadi H (2019) Finite Element Analysis of Occlusal Splint Therapy in Patients with Bruxism. BMC Oral Health 19(1): 205.
-
Nekora A, Evlioglu G, Ceyhan A, Keskin H, Issever H (2009) Patient responses to vacuum formed splints compared to heat cured acrylic splints: pilot study. J Maxillofac Oral Surg 8(1): 31-32.
-
Gautam R, Singh RD, Sharma VP, Siddhartha R, Chand P, et al. (2012) Biocompatibility of polymethylmethacrylate resins used in dentistry. J Biomed Mater Res B Appl Biomater 100(5): 1444-1450.
-
Leib AM (2001) Patient preference for light-cured composite bite splint compared to heat-cured acrylic bite splint. J Periodontol 72(8): 1108-1112.
-
Edelhoff D, Schweiger J, Prandtner O, Trimpl J, Stimmelmayr M, et al. (2017) CAD/CAM splints for the functional and esthetic evaluation of newly defined occlusal dimensions. Quintessence Int 48(3): 181-191.
-
Lauren M, McIntyre F (2008) A new computer-assisted method for design and fabrication of occlusal splints. Am J Orthod Dentofacial Orthop 133(4): 130-135.
-
Dunn DB, Lewis MB (2011) CAD/CAM occlusal splints: a new paradigm. Aust Dent Pract 22: 130-134.
-
Dedem P, Türp JC (2016) Digital Michigan splint - from intraoral scanning to plasterless manufacturing. Int J Comput Dent 19(1): 63-76.
-
Salmi M, Paloheimo KS, Tuomi J, Ingman T, Makitie A (2013) A digital process for additive manufacturing of occlusal splints: a clinical pilot study. J R Soc Interface 10(84): 20130203.
-
Huettig F, Kustermann A, Kuscu E, Geis Gerstorfer J, Spintzyk S (2017) Polishability and wear resistance of splint material for oral appliances produced with conventional, subtractive, and additive manufacturing. J Mech Behav Biomed Mater 75: 175-179.
-
Lambrechts P, Debels E, Landuyt K, Peuman M, Meerbeek B (2006) How to simulate wear? Overview of existing methods. Dent Mater 22(8): 693-701.
-
Heintze SD, Cavalleri A, Forjanic M, Zellweger G, Rousson V (2006) A comparison of three different methods for the quantification of the in vitro wear of dental materials. Dent Mater 22(11): 1051-1062.
-
Mehzabeen KR, Boughton P, Kan WH, Ruys AJ, Guazzato M (2020) Two-body wear test of enamel against laboratory polished and clinically adjusted zirconia. J Mech Behav Biomed Mater 108: 103760.
-
Krejci I, Albert P, Lutz F (1999) The influence of antagonist standardization on wear. J Dent Res 78(2): 713-719.
-
Diracoglu D (2011) Relationship between maximal bite force and tooth wear in bruxist and non-bruxist individuals. Arch Oral Biol 56(12): 1569-1575.
-
Reding GR, Zepelin H, Robinson JE, Zimmerman SO, Smith VH (1968) Nocturnal teeth-grinding: all-night psychophysiologic studies. J Dent Res 47(5): 786-797.
-
Benli M, Eker Gümüş B, Kahraman Y, Gökçen Rohlig B, Evlioğlu G, et al. (2020) Surface roughness and wear behavior of occlusal splint materials made of contemporary and high-performance polymers. Odontology 108(2): 240-250.
-
Mair LH, Stolarski TA, Vowles RW, Lloyd CH (1996) Wear: mechanisms, manifestations and measurement. Report of a workshop. J Dent 24(1-2): 141-148.
-
Heintze SD (2006) How to qualify and validate wear simulation devices and methods. Dent Mater 22(8): 712- 734.
-
Kurt H, Erdelt KJ, Cilingir A, Mumcu E, Sulun T, et al. (2012) Two-body wear of occlusal splint materials. J Oral Rehabil 39(8): 584-590.
-
Yildiz Domanic K, Aslan YU, Ozkan Y (2020) Two-body wear of occlusal splint materials against different antagonists. BMC Oral Health 20(1): 174.
-
Reyes Sevilla M, Kujis RH, Werner A, Kleverlaan CJ, Lobbezoo F (2018) Comparison of wear between occlusal splint materials and resin composite materials. J Oral Rehabil 45(7): 539-544.
-
Krejci I, Albert P, Lutz F (1992) Chewing Pressure vs. Wear of Composites and Opposing Enamel Cusps. J Dent Res 71(8): 1525-1559.
-
Shinkai K, Suzuki S, Leinfelder KF, Katoh Y (1994) How heat treatment and thermal cycling affect wear of composite resin inlays. J Am Dent Assoc 125(11): 1467- 1472.
-
Lavigne G, Guitard F, Rompre P, Montplaisir JY (2001) Variability in sleep bruxism activity over time. J Sleep Res 10(3): 237-244.
-
Chadwick RG (1994) Thermocycling-the effects upon the compressive strength and abrasion resistance of three composite resins. J Oral Rehabil 21(5): 533-543.
-
Yap AU, Wee KE, Teoh SH, Chew CL (2001) Influence of thermal cycling on OCA wear of composite restoratives. Oper Dent 26(4): 349-356.
- Diagnosis and Management of Mental Nerve Paresthesia Secondary to Apical Periodontitis of Mandibular Second Premolar: A CBCT Based Case Report
- A Randomized, Double Blinded Clinical Trial to Compare the Effect of Oral Premedication (Diclofenac Potassium or Dexamethasone) on Post-Operative Pain Following Pulpectomy
- Modified Lip Repositioning Technique for the Management of Excessive Gingival Display
- Integral Role of Non-Dental Providers and Fluoride Dissemination
- Root Canal Treatment Rate in Deciduous Teeth Among 6-Year- Olds in the Era of Discontinuing Water Fluoridation - Historical Cohort Study
- The Impact of the Notch1 on the Migratory Capacity and the Expression of E-Cadherin and CyclinD1 in Ameloblastoma Cells