Utilization of the Charlson Comorbidity Score to Predict 10-Year Survival in Renal Transplant Recipients
Purpose: The Charlson Comorbidity Score has been demonstrated to predict mortality in prostate cancer patients. Our novel objective was to compare the 10-year observed mortality with expected mortality based on pre-operative Charlson Score adjusted for resolution of renal disease in patients undergoing renal transplantation at our institution. Materials and Methods: We reviewed the records of 100 consecutive patients receiving a first renal transplant at our center between 2004 and 2005. Inclusion criteria were kidney only transplant with follow-up until death or 10 years post-transplant. Age, sex, etiology of renal failure, months on dialysis pre-transplant, comorbidities, survival at 10 years or months from transplant to death were collected. A Charlson Score adjusted for resolution of renal disease was determined and probability of survival at 10 years was calculated from this. Cox proportional hazards modeling was used to determine independent factors predictive of patient survival. Kaplan Meier Curves were generated to demonstrate 10-year survival. Results: Mean 10 year predicted survival was 72.5% (CI 66-78.8) and actual survival was 77% (CI 68.6 - 85.4).The only significant predictive variable of survival was predicted 10-year survival based on the Charlson Score (HR 0.9758, p
Introduction
The Charlson Comorbidity Score (CCS) was first published by Charlson et al in 1987 [1]. The objective was to develop a prospectively applicable method for classifying comorbid conditions that might alter the risk of mortality for use in longitudinal studies. It was originally based on 19 diseases each assigned an individual a point value and the sum of the points was then used to calculate predicted survival. In 1994 an age component was added [2]. Currently, a CCS is determined from the sum of these 2 components, which then allows a 10-year predicted survival to be determined. There are multiple methods of assessing a patient’s predicted survival based on the individual’s comorbidity burden. Despite this, there is no consensus regarding which is the most predictive. The CCS has been demonstrated to predict mortality in prostate cancer when calculated to adjust for cure [3]. Previous studies have shown the CCS to be a practical tool for the evaluation of comorbidity in the renal transplant population [4]. Our novel objective was to compare 10-year observed mortality based on preoperative CCS prior to renal transplant adjusted for resolution of renal disease.
Materials and Methods
After obtaining institutional review board approval we used the renal transplant database at our institution to identify 100 consecutive patients undergoing renal transplantation between 6/15/2004 and 10/28/2005.
Inclusion Criteria
Patients included were first-time kidney-only transplant recipients, 18 years of age and older, with 10 years of follow-up prior to data collection.
Data Collection
Patient data was collected from the renal transplant database followed by a formal review of each patient’s electronic health record. The following were collected: age at time of renal transplant, sex, etiology of end-stage renal disease (ESRD), months of dialysis prior to transplant, presence of relevant past medical history for the CCS at the time of diagnosis, survival at 10 years and months to death if the patient did not survive to 10years post-transplant.
Charlson Score
The calculation of a comorbidity component of a standard Charlson Score is outlined in the introduction. The conditions included and corresponding point values are featured in Table 1. For this study, we calculated a renal transplant- adjusted Charlson Score adjusting for the resolution of ESRD following renal transplant (RT- CCS).Since ESRD was presumed resolved after renal transplant, the 2 points normally added to the patient’s Charlson Score for ESRD (defined in table 1 as “Moderate- severe chronic renal failure”) were eliminated from the RT-CCS. The age component is calculated by awarding 0.1 point for each year over 40 years of age, any patient age 40 or less would receive a score of zero (Table 2). Together the morbidity and age components are combined to calculate the total CCS. From this a patient’s 10-year predicted survival is calculated as outlined below.
| Point | 1 | 2 | 3 | 6 |
|---|---|---|---|---|
| Morbidity | MI | Hemiplegia | Moderate-severe liver disease | Metastatic solid tumour |
| Morbidity | CCF | Moderate-severe CRF | AIDS | |
| Morbidity | COPD | DM (with end-organ damage) | ||
| Morbidity | DM (without end-organ damage) | MalignancyLeukaemia | ||
| Morbidity | Cerebrovascular disease | Lymphoma | ||
| Morbidity | Dementia | |||
| Morbidity | Ulcers | |||
| Morbidity | Connective tissue disease | |||
| Morbidity | Mild liver disease |
Table 1: For this study, we calculated a renal transplant- adjusted Charlson Score adjusting for the resolution of ESRD following
Abbreviations: MI: Myocardial Infarction; CCF: Congestive cardiac failure; PVD: Peripheral vascular disease; COPD: chronic obstructive pulmonary disease; DM: Diabetes mellitus; CRF: chronic renal failure. Table1: Charlson Comorbidities and respective point Scores.
| Age | Score | Age | Score | Age | Score | Age | Score | Age | Score |
| 40 | 0 | 50 | 1 | 60 | 2 | 70 | 3 | 80 | 4 |
| 41 | 0.1 | 51 | 1.1 | 61 | 2.1 | 71 | 3.1 | 81 | 4.1 |
| 42 | 0.2 | 52 | 1.2 | 62 | 2.2 | 72 | 3.2 | 82 | 4.2 |
| 43 | 0.3 | 53 | 1.3 | 63 | 2.3 | 73 | 3.3 | 83 | 4.3 |
| 44 | 0.4 | 54 | 1.4 | 64 | 2.4 | 74 | 3.4 | 84 | 4.4 |
| 45 | 0.5 | 55 | 1.5 | 65 | 2.5 | 75 | 3.5 | 85 | 4.5 |
| 46 | 0.6 | 56 | 1.6 | 66 | 2.6 | 76 | 3.6 | 86 | 4.6 |
| 47 | 0.7 | 57 | 1.7 | 67 | 2.7 | 77 | 3.7 | 87 | 4.7 |
| 48 | 0.8 | 58 | 1.8 | 68 | 2.8 | 78 | 3.8 | 88 | 4.8 |
| 49 | 0.9 | 59 | 1.9 | 69 | 2.9 | 79 | 3.9 | 89 | 4.9 |
Table 2: Age component of Charlson Score
Charlson age score B=___ Table 2: Age component of Charlson Score
| A+B | Z(%) | A+B | Z(%) | A+B | Z(%) | A+B | Z(%) | A+B | Z(%) |
| 0-1 | >95 | 2.1 | 89 | 3.1 | 76 | 4.1 | 50 | 5.1 | 18 |
| 1.1-2 | 90-95 | 2.2 | 88 | 3.2 | 74 | 4.2 | 47 | 5.2 | 16 |
| 2.3 | 87 | 3.3 | 72 | 4.3 | 44 | 5.3 | 13 | ||
| 2.4 | 86 | 3.4 | 69 | 4.4 | 41 | 5.4 | 11 | ||
| 2.5 | 85 | 3.5 | 67 | 4.5 | 37 | 5.5 | 9 | ||
| 2.6 | 84 | 3.6 | 65 | 4.6 | 34 | 5.6 | 7 | ||
| 2.7 | 82 | 3.7 | 62 | 4.7 | 31 | 5.7 | 6 | ||
| 2.8 | 81 | 3.8 | 59 | 4.8 | 28 | 5.8 | 4 | ||
| 2.9 | 79 | 3.9 | 56 | 4.9 | 24 | 5.9 | 3 | ||
| 3 | 77 | 4 | 53 | 5 | 21 | >6 | <2 |
Table 3: Total Charlson Score and 10-year predicted survival.
Charlson 10-year survival probability (%) Z=__ (Formula used A+B=X; e0.9X= Y; 0.983Y=Z). Table 3: Total Charlson Score and 10-year predicted survival. Charlson Score (X) X = A+B Comorbidity component (A) Sum of points for each morbidity (Table 1) Age component (B) Age <40 years – 0 Age 41–50 years – 1 Age 51–60 years – 2; Age 61–70 years – 3 Age 71–80 years – 4. Charlson probability (Z) Formula: e0.9X= Y 0.983Y=Z (10-year survival) We also then utilized the table created by Kastner, et al. (Table 3) which allowed rapid calculation of a patient’s 10-year predicted survival. In instances where this table did not provide an exact value for predicted survival we utilized the logarithmic formula above to calculate this directly.
| Mean age | 51 years | ||||
|---|---|---|---|---|---|
| Sex | 52% male/ 48% female | ||||
| Donor type | 56% living/ 44% deceased | ||||
| Time on dialysis prior to transplant | 21.4 months | ||||
| Most common etiologies of ESRD | 25% Diabetes & 19% autosomal dominant polycystic kidney disease |
Analysis
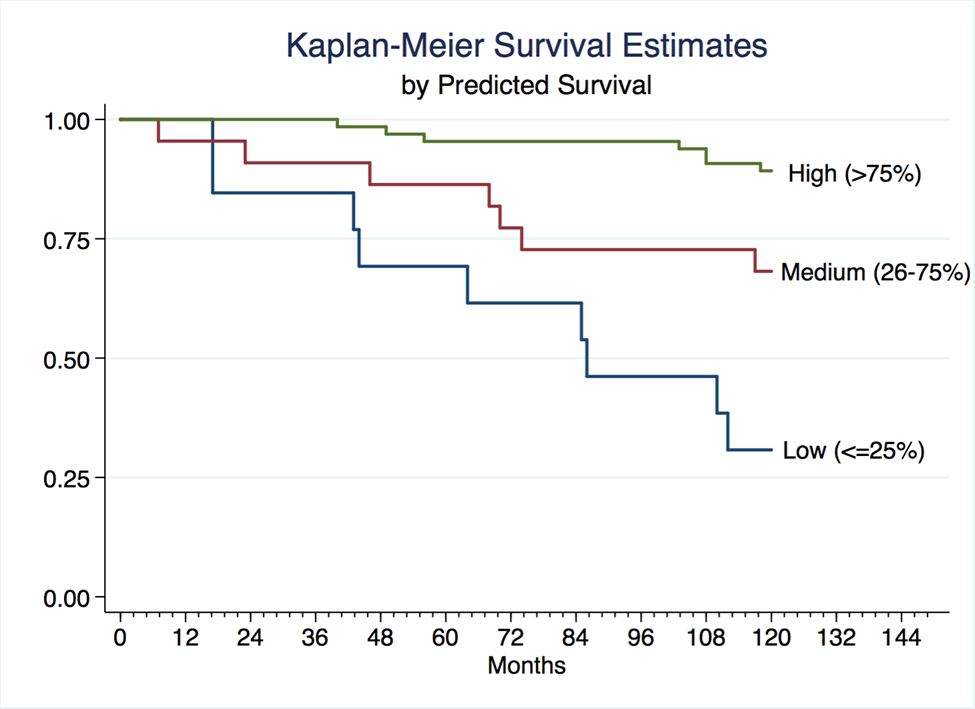
Statistical analyses were performed using STATA 13 (STATA Corp, College Station, Texas). Multivariable analysis was performed using Cox proportional hazards modeling to determine independent clinical risk factors predictive of patient survival at 10 years. Patients were grouped into high, moderate and low probability survival groups and Kaplan-Meier survival curves were generated and compared between groups.
Results
Mean age at time of renal transplant was 51, 52% of patients were male, 56% received a kidney from a living donor, mean months on dialysis prior to transplant was 21.4.The most common etiologies of ESRD were diabetes mellitus (25%) and autosomal dominant polycystic kidney disease (19%). The mean RT-CCS was 2.49 (std dev 1.95). The mean RT-CCS 10-year predicted survival was 72.5% (CI 66.0- 78.8). The mean standard CCS was 4.49 (std dev 1.95) and 10 year predicted survival based on this was 44.9% (CI 37.9-51.8). Mean actual survival was 77.0% (CI 68.6- 85.4). The only predictive factor on actual 10-year survival was RT-CCS 10-year predicted survival (HR 0.9758, p<0.0001). Kaplan Meier curves with patients stratified into predicted survival groups are shown in the figure I.
Discussion
To our knowledge this is the first study in the renal transplant population to compare actual patient survival to 10-year predicted survival based on the CCS.
Furthermore, this is also the first application of a Charlson Score adjusted to account for resolution of ESRD in patients undergoing renal transplantation. The utility of this adjustment was clearly demonstrated as without it a standard Charlson score grossly underestimated the 10- year survival of these patients. Although there are numerous comorbidity indices throughout the literature and currently there appears to be no clear consensus as to which is the most accurate predictor of survival, we chose the CCS for our study for several reasons. Perhaps the most significant is that in its original form it has been around for nearly 30 years demonstrating its longevity and allowing for extensive prior validation [1]. Secondarily as evidenced in our methods, this is simple and rapid to calculate, allowing for easy application in the clinical setting. Our study specifically demonstrates that in the renal transplant population this tool is predictive of a patient’s actual survival. This finding has several potential implications in patient care. Patients undergoing renal transplantation with a higher Charlson Score are at an increased risk of mortality and therefore this may serve to identify patients who warrant closer follow-up and monitoring as suggested by Wu et al [5]. Also, baseline comorbidity of renal transplant patients has been shown to vary across different institutions [6]. As such, the CCS has the potential to aide in performing an informed comparison of results from between different institutions. Lastly, with a limited supply of organs available this may be useful in organ allocation decisions. Our results should be interpreted in light of several limitations. The study was performed using a retrospectively collected cohort of patients, which may have introduced bias. We minimized the influence of this bias by selecting 100 consecutive patients meeting inclusion criteria. The novel approach to calculating a RT- CCS presumes that all patients are cured of their ESRD which is not true in those with graft failure. Our study did not account for this. Lastly, as previously noted in the literature, some of the comorbid conditions in the CCS are not precise. For example, a Charlson score does not differentiate between a patient with claudication and a patient who has undergone amputation. Both patients would receive 1 point for peripheral vascular disease despite the distinct difference in disease severity [3].
Conclusions
The Renal Transplant adjusted Charlson Comorbidity Score 10-year predicted survival was predictive of actual survival in patients 18 years and older undergoing an initial renal transplant. This rapidly calculated tool can be easily replicated among other cohorts and once validated in a larger study may be useful in comparing survival outcomes between different transplant institutions as well as in organ allocation.
References
-
Charlson ME, Pompei P, Ales KL, MacKenzie CR (1987) A new method of classifying prognostic comorbidity in longitudinal studies: development and validation. J Chronic Dis 40(5): 373-383.
-
Charlson M, Szatrowski TP, Peterson J, Gold J (1994) Validation of a combined comorbidity index. J Clin Epidemiol 47(11): 1245-1251.
-
Kastner C, Armitage J, Kimble A, Rawal J, Carter PG, et al. (2006) The Charlson comorbidity Score: a superior comorbidity assessment tool for the prostate cancer multidisciplinary meeting. Prostate Cancer Prostatic Dis 9(3): 270-274.
-
Grosso G, Corona D, Mistretta A, Zerbo D, Sinagra N, et al. (2012) Predictive value of the Charlson comorbidity index in kidney transplantation. In Transplantation proceedings 44(7): 1859-1863. [INLINE_TABLE:4:0]
-
Krakauer H, Bailey RC, Lin MJY (2004) Beyond survival: the burden of disease in decision making in organ transplantation. Am J Transplant 4(10): 1555-1561.
- Results of 6-Month Follow-Up of Patients After B-Turp and Thulep
- The Effect of Drinking Water with a High Content of Antimony and Arsenic on the Dynamics of their Distribution in the Kidneys and the Renal Excretory Function in Rats
- Effectiveness and Safety of Tansurethral Thulium Laser Enucleation of the Prostate in the Treatment of BPH: Review
- A Systematic Review on Molecular Pathophysiology Involved in Chronic Kidney Disease and the Role of Animal Models in Drug Discovery to Manage in Chronic Kidney Disease - An Update
- Functional Development of Kidneys in Human Ontogenesis
- Testicular Metastasis: Uncommon Prostate Cancer Case Report