Analysis of NITI AAYOG (National Institution For Transforming India) Health Index Report on the Ranking of States and Union Territories: Round 2 (2015-2016/ 2017-2018)-V2
India has committed to achieve the Sustainable Development Goals (SDGs) for Goal 3 of SDGs which is about ensuring healthy lives with promoting well-being for all. National Institution for Transforming India- (NITI) Aayog had started the State Health Index initiative for ranking, comparing, states and UTs for achieving desirable health outcomes. The key objective of NITI Aayog is to track development on health, to develop healthy competition and cross learning among states and UTs. Health Index Scores and rankings are generated to assess Incremental Performance (year-to-year progress) and Overall Performance of state/ UT of India for achievement of health-related Sustainable Development Goals (SDGs) as well as Universal Health Coverage (UHC). This novel study second was a cross-sectional retrospective observational study. The Health Index consists of a set of indicators in the domains of Health Outcomes, Governance and Information, and Key Inputs/Processes. Health Outcomes are assigned the highest weight in this study; indicators were selected on the basis of their importance and availability of reliable data at least annually from pre- existing data sources such as the Sample Registration System (SRS), Civil Registration System (CRS) and Health Management Information Systems (HMIS). Data on indicators is included for Index calculations only after validation by the IVA.
Introduction
Background/Rationale
By adopting the Sustainable Development Goals (SDGs), India is committed for Goal 3 of SDGs which is for ensuring healthy lives and promoting well-being for all. NITI Aayog in India has established the annual State Health Index tool for ranking the States/UTs on health outcomes, Governance and Information, and Key Inputs/Processes. The outcome is complemented with the MoHFW’s (Ministry of Health and Family Welfare) Government of India to link a part of NHM funds to the States on this Index [1, 2]. I am presenting the second version of review of Round-2 of the Health Index, discussing the status of States and the UTs during the period 2015-16 (Base Year) and 2017-18 (Reference Year), i.e., a two-year period [3, 4]. The report on Health Index highlights the areas to focus by states and UTs for improvement in overall health outcomes. NITI Aayog measures the annual performance and rank States and UTs on the basis of incremental change. Health Index Scores and rankings are generated to assess Incremental Performance (year-to- year progress) and Overall Performance of state/UT for achievement of health-related Sustainable Development Goals (SDGs) as well as Universal Health Coverage (UHC).
Objectives
Aim of NITI Aayog of India is to promote a co-operative positive competition amongst the States and UTs of India for transformative action in achieving better health outcomes. The key Objective is to calculate and release a composite annual state/UTs Health Index by utilizing key health outcomes, health systems and service delivery indicators for generating Health Index scores and rankings of the States and UTs based on incremental performance and overall performance. Other objectives are to calculate positive/ negative development on health, to encourage healthy competition and mutual learning among states and UTs, to ensure States’ participation and ownership, transparency by using an independent validation of data by an independent agency.
Methods
Study Design
This was a cross-sectional retrospective observational quantitative and qualitative study. The Health Index consists of indicators in the domains of Health Outcomes, Governance and Information, and Key Inputs/Processes. Health Outcomes are assigned the highest weight, indicators were selected on the basis of their importance and availability of reliable data at least annually from pre- existing data sources such as the Sample Registration System (SRS), Civil Registration System (CRS) and Health Management Information Systems (HMIS). Data on indicators is included for Index calculations only after validation by the IVA. A composite Index is calculated as a weighted average of various indicators, for a base year (BY) and a reference year (RY). The change in the Index score of each State from the base year to a reference year is the annual incremental progress of each State. States and UTs were grouped in 3 categories to ensure comparison among similar entities, namely 21 Larger States, 8 Smaller States, and 7 UTs [3, 4]. The same 23 indicators were used for the Health Index-2018 as in the first round. Taking into account importance and availability of reliable data 23 indicators were included in the Health Index. OOPE (out of pocket expenditure) used in first round was not available [3, 4]. Setting For calculation of Index values and ranks, data was submitted online and validated by an Independent Validation Agency (IVA). The States were previously sensitized about the process for data submission through workshops and key stakeholders (Table 1). Data was submitted by participants States and UTs through online portal hosted by NITI Aayog and data from pre-existing sources in the public domain was pre-entered. After validation of data by an IVA it was used
- as an input into automated generation of Index values and ranks on the web-portal. The data was verified by IPE Global, an IVA prior to computing the Index and ranks for all States and UTs of India.
- Technical
- Assistance (TA)
- Agency (the World
- Bank)
- Niti Aayog
- States
- Review, finalize and disseminate - the
- Health Index-2018 along with necessary guidance in close partnership with
- MoHFW
- TA to NITI Aayog in reviewing and finalizing the
- Health Index-2018 and protocols and guidelines
- Adopt and share
- Health Index2018 with various departments and districts as needed
- Mentor the States on data definitions and data requirements for the
- Health Index2018
- Enter and submit data in a timely manner on the indicators as per identified sources in web portal
- Provide guidance to the States for submission of data including visiting State
- Health Departments/
- Directorates as needed
- Facilitate interaction between States and
- TA agency, mentor agencies, and the IVA
- Technical oversight to the mentor agencies, portal agency and the IVA
- Coordination with different districts, mentor agencies and the IVA
- Provide technical support for generation of composite Index
- Follow up with States for timely submission of data/ supporting documents on the on web portal
- Host a web portal for
- States to enter data, its validation
- Provide technical support for drafting and disseminating the report
- Overall coordination and management
Table 1: List of key stakeholders - Roles and Responsibilities. Source – NITI Aayog-India.
This novel study was conducted over a period of eight months in 2018-19 see table-5. The States and UTs participated for finalization of the indicators/variables, workshops for sharing the methodology, process of data submission.
Participants
All states and UTs of India were participants. Multiple
stakeholders as discussed above contributed to the Index development: The various Index was developed by NITI Aayog with help of World Bank, States and UTs, the Ministry of Health and Family Welfare (MoHFW), domestic and international sector experts and other development partners Categorization of States and UTs for ranking were based on the size, and administration [3, 4]. The States were ranked in three categories, namely Larger States, Smaller States and UTs [1] (Table 2).
| Number of States and UTs | States and UTs | |
|---|---|---|
| Larger States | 21 | Andhra Pradesh, Assam, Bihar, Chhattisgarh, Gujarat, Haryana, Himachal Pradesh, Jammu & Kashmir, Jharkhand, Karnataka, Kerala, Madhya Pradesh, Maharashtra, Odisha, Punjab, Rajasthan, Tamil Nadu, Telangana, Uttar Pradesh, Uttarakhand, West Bengal |
| Smaller States | 8 | Arunachal Pradesh, Goa, Manipur, Meghalaya, Mizoram, Nagaland, Sikkim, Tripura |
| Union Territories | 7 | Andaman & Nicobar, Chandigarh, Dadra & Nagar Haveli, Daman & Diu, Delhi, Lakshadweep, Puducherry |
Table 2: Categorization of States and UTs. Source – NITI Aayog-India.
This categorization was done due to the following reasons:
- The SRS data on health outcomes (NMR, U5MR, TFR and SRB) were not available for 8 Smaller States and 7 UTs,
- Reliable estimates for these outcome indicators/variables based on raw data obtained from SRS for the Smaller States and UTs could not be derived due to statistically small sample size and insufficient number of events.
Variables
The main criteria for inclusion of indicators/variables were the availability of reliable data with at least an annual frequency. The output Index is a weighted composite Index based on indicators/variables in 3 fields: (1) Health Outcomes; (2) Governance and Information; and (3) Key Inputs/Processes. Each domain was assigned a weight based on its importance. The indicator values are scaled from 0 to 100 for generating composite Index scores and performance rankings for 2015-16 (Base Year) to 2017-18 (Reference Year), i.e., a two-year period. The annual incremental progress made from BY to RY is used to generate incremental ranks. Table 3 shows the number of indicators/variables in each domain and sub-domain along with weights, while Table 4 provides the detailed Health Index with indicators/ variables, their definitions, data sources, and specifics of base and reference years.
| Domain | Sub-domain | Larger States | Smaller States | Union Territories | |||
|---|---|---|---|---|---|---|---|
| Number of Indicators | Weight | Number of Indicators | Weight | Number of Indicators | Weight | ||
| Health Outcomes | Key Outcomes | 5 | 500 | 1 | 100 | 1 | 100 |
| Intermediate Outcomes | 5 | 250 | 5 | 250 | 4 | 200 | |
| Governance and Information | Health Monitoring and Data Integrity | 1 | 70 | 1 | 70 | 1 | 70 |
| Governance | 2 | 60 | 2 | 60 | 2 | 60 | |
| Key Inputs/ Processes | Health Systems/ Service Delivery | 10 | 200 | 10 | 200 | 10 | 200 |
| Total | 23 | 1,080 | 19 | 680 | 18 | 630 |
Table 3: Health Index: Summary. Source – NITI Aayog-India. Here it is important to mention that for round-2 larger states have 23
Table 3: Health Index: Summary. Source – NITI Aayog-India. Here it is important to mention that for round-2 larger states have 23 indicators unlike 24 of round 1and total weight 1080 instead of 1130; smaller states 19 instead of 20 of round 1 and weight 680 instead of 730; UTs 18 indicators instead of 19 of round 1 and weight 630 instead of 680 for round1. * The data for indicator no. 1.2.6 related to out of pocket expenditure was available only for 2015-16 and hence was used to calculate independently the RY Index and rank of round1.
Data sources/Measurement
The Health Index consists of 23 indicators/variables related to Health Outcomes, Governance and Information, and Key Inputs/Processes (Table 4 provides Health Index- indicator details and data sources).
| S. no. | Indicator | Definition | Data source | Base Year (BY) and Reference Year (RY) |
|---|---|---|---|---|
| Domain: Health Outcomes | ||||
| 1.1.1 | Neonatal Mortality Rate (NMR) [1] | Number of infant deaths of less than 29 days per thousand live births during a specific year. | SRS [pre-filled] | BY:2015 RY:2016 |
| 1.1.2 | Under-five Mortality Rate (U5MR)[2] | Number of child deaths of less than 5 years per thousand live births during a specific year. | SRS [pre-filled] | BY:2015 RY:2016 |
| 1.1.3 | Total Fertility Rate (TFR)[3] | Average number of children that would be born to a woman if she experiences the current fertility pattern throughout her reproductive span (15-49 years), during a specific year. | SRS [pre-filled] | BY:2015 RY:2016 |
| 1.1.4 | Proportion of Low Birth Weight (LBW) among newborns | Proportion of low birth weight (<2.5 kg) newborns out of the total number of newborns weighed during a specific year born in a health facility. | HMIS | BY:2015-16 RY:2017-18 |
| 1.1.5 | Sex Ratio at Birth (SRB)[4] | The number of girls born for every 1,000 boys born during a specific year. | SRS [pre-filled] | BY:2013-15 RY:2014-16 |
| 1.2.1 | Full immunization coverage | Proportion of infants 9-11 months old who have received BCG, 3 doses of DPT, 3 doses of OPV and measles against estimated number of infants during a specific year. | HMIS | BY:2015-16 RY:2017-18 |
| 1.2.2 | Proportion of institutional deliveries | Proportion of deliveries conducted in public and private health facilities against the number of estimated deliveries during a specific year. | HMIS | BY:2015-16 RY:2017-18 |
| 1.2.3 | Total case notification rate of tuberculosis (TB) | Number of new and relapsed TB cases notified (public + private) per 1,00,000 population during a specific year. | Revised National | BY:2016 RY:2017 |
| 1.2.4 | Treatment success rate of new microbiologically confirmed TB cases | Proportion of new cured and their treatment completed against the total number of new microbiologically confirmed TB cases registered during a specific year. | RNTCP MIS, MoHFW [pre- filled] | BY:2015 RY:2016 |
| 1.2.5 | Proportion of people living with HIV (PLHIV) on antiretroviral therapy (ART)[5] | Proportion of PLHIVs receiving ART treatment against the number of estimated PLHIVs who needed ART treatment for the specific year. | Central MoHFW Data [pre-filled] | BY:2015-16 RY:2017-18 |
| s. no. | Indicator | Definition | Data source | Base Year (BY) and Reference Year (RY) |
| Domain: Governance and Information | ||||
| 2.1.1 | Data Integrity Measure: a. Institutional deliveries; b. ANC registered within first trimester | Percentage deviation of reported data from standard survey data to assess the quality/integrity of reported data for a specific period. | HMIS and NFHS-4 (pre- filled) | BY and RY: 2015- 16 (NFHS) BY and RY: 2011-12 to 2015-16 (HMIS) |
| 2.2.1 | Average occupancy of an officer (in months), combined for following three posts at State level for last three years: 1. Principal Secretary; 2. Mission Director (NHM); 3. Director (Health Services) | Average occupancy of an officer (in months), combined for following posts in last three years: 1. Principal Secretary; 2. Mission Director (NHM); 3. Director (Health Services) | State Report | BY: April 1, 2013-March 31, 2016 RY: April 1, 2015-March 31, 2018 |
| 2.2.2 | Average occupancy of a full- time officer (in months) for all the districts in last three years - District Chief Medical Officers (CMOs) or equivalent post (heading District Health Services) | Average occupancy of a CMO (in months) for all the districts in last three years. | State Report | BY: April 1, 2013- March 31, 2016 RY: April 1, 2015-March 31, 2018 |
| Domain: key Inputs and Processes | ||||
| 3.1.1 | Proportion of vacant health care provider positions (regular + contractual) in public health facilities | Vacant healthcare provider positions in public health facilities against total sanctioned health care provider positions for following cadres (separately for each cadre) during a specific year: a. Auxiliary Nurse Mid- wife (ANM) at sub-centres (SCs); b. S taff nurse (SN) at Primary Health Centres (PHCs) and Community Health Centres (CHCs); c. Medical officers (MOs) at PHCs; d. Specialists at District Hospitals (Medicine, Surgery, Obstetrics and Gynaecology, Pediatrics, Anesthesia, Ophthalmology, Radiology, Pathology, Ear-NoseThroat (ENT), Dental, Psychiatry) | State Report | BY: As on March 31, 2016 RY: As on March 31, 2018 |
| 3.1.2 | Proportion of total staff (regular + contractual) with e-payslip generated in the IT enabled Human, Resources Management Information System (HRMIS). | Availability of a functional IT enabled HRMIS measured by the proportion of staff (regular + contractual) for whom an e-payslip can be generated in the IT enabled HRMIS against total number of staff (regular + contractual) during a specific year. | State Report | BY: As on March 31, 2016 RY: As on March 31, 2018 |
| s. no. | Indicator | Definition | Data source | Base Year (BY) and Reference Year (RY) |
| 3.1.3 | a. Proportion of specified type of facilities functioning as First Referral Units (FRUs) as against required norm | Proportion of public sector facilities conducting specified number of C-sections per year (FRUs) against the norm of one FRU per 5,00,000 population during a specific year. | State Report on number of functional FRUs, MoHFW data on required number of FRUs | BY:2015-16 RY:2017-18 |
| b. Proportion of functional 24x7 PHCs as against required norm | Proportion of PHCs providing healthcare services as per the stipulated criteria against the norm of one 24x7 PHC per 1,00,000 population during a specific year. | State Report on number of functional 24x7 PHCs, MoHFW data on required number of PHCs | BY:2015-16 RY:2017-18 | |
| 3.1.4 | Average number of functional Cardiac Care Units (CCUs) per district (*100) | Number of functional CCUs [with desired equipment ventilator, monitor, defibrillator, CCU beds, portable ECG machine, pulse oxymeter etc.), drugs, diagnostics and desired staff as per programme guidelines] per districts *100. | State Report | BY: As on March 31, 2016 RY: As on March 31, 2018 |
| 3.1.5 | Proportion of ANC registered within first trimester against total registrations | Proportion of pregnant women registered for ANC within 12 weeks of pregnancy during a specific year. | HMIS | BY:2015-16 RY:2017-18 |
| 3.1.6 | Level of registration of births | Proportion of births registered under Civil Registration System (CRS) against the estimated number of births during a specific year. | Civil Registration System (CRS) [pre-filled] | BY:2014 RY:2016 |
| 3.1.7 | Completeness of Integrated Disease Surveillance Programme (IDSP) reporting of P and L forms | Proportion of Reporting Units (RUs) reporting in stipulated time period against total RUs, for P and L forms during a specific year. | Central IDSP, MoHFW Data [pre-filled] | BY:2015 RY:2017 |
| 3.1.8 | Proportion of CHCs with grading 4 points or above | Proportion of CHCs that are graded 4 points or above against total number of CHCs during a specific year. | HMIS | BY:2015-16 RY:2017-18 |
| 3.1.9 | Proportion of public health facilities with accreditation certificates by a standard quality assurance program (NQAS/ NABH/ISO/AHPI) | Proportion of specified type of public health facilities with accreditation certificates by a standard quality assurance program against the total number of following specified type of facilities during a specific year. 1. District hospital (DH)/Sub-district hospital (SDH); 2. CHC/Block PHC | State Report | BY: As on March 31, 2016 RY: As on March 31, 2018 |
| 3.1.10 | Average number of days for transfer of Central NHM fund from State Treasury to implementation agency (Department/Society) based on all tranches of the last financial year | Average time taken (in number of days) by the State Treasury to transfer funds to implementation agencies during a specific year. | Centre NHM Finance Data 10 [pre-filled] | BY:2015-16 RY:2017-18 |
Table 4: Health Index: Indicators/variables, definitions, data sources, base and reference years.
Bias
Grouping and ranking the states according to size is a biased view. The researcher feels that population density/ per capita income/ literacy rate/ health workforce/ corruption-scam index etc. should be considered for ranking states. Summarizing the complexities and condensing it in an Index has limitations. Health Outcomes are assigned the highest weight knowing the fact that it is entirely dependent on input and governance. The governance in states such as Bihar is always controversial such as lack of Directorate, corruption, posting scams etc [5]. Hence the researcher feels that governance and input indicators are more important and it is a total biased view to provide health outcome highest weight which is totally dependent on other two.
Study Size
All states and UTs of India were participants. Table 5 shows study period (This second edition of this exercise was conducted over a period of eight months in 2018-19.) The States were informed about the Health Index-2018 on July 14, 2018 through video conference chaired by the Chief Executive Officer (CEO), NITI Aayog. During the discussions an agreement was reached that the Base Year would be 2015- 16, while the Reference Year would be 2017-18 for round 2.
- Timeline for development of health index 2018
- 7/1/2018
- July-
- August
- 2018
- Finalization of Guide book and Dissemination to states
- Selection and traning of mentors, guidance to states and submission of data on portal
- Selection and traning of IVA, Validation of data By IVA,
- North East Regional Data validation Workshop and Video
- Conference with all states on Finalization of Validated date
- Index and rnk generation and report writting
- Dissemination of rank
Table 5: Study period. Source – NITI Aayog-India
Quantitative Variables
See Table 4
Statistical Methods
Methodological Details of Constructing The Index-Computation of Index Scores and Ranks
After validation of data by the IVA, data was used for the Health Index score calculations. Indicator value was scaled, based on the nature of the indicator, for positive indicators, where higher the value, better the performance, the scaled value (Si) for the indicator, with data value as Xi , was calculated as follows:
Scaled value (Si) for positive indicator = (Xi – Minimum value) x 100/ (Maximum value – Minimum value) For negative indicators where lower the value, better the performance (e.g. NMR, U5MR,) scaled value was calculated as follows:
Scaled value (Si) for negative indicator = (Maximum value – Xi) x 100/ (Maximum value – Minimum value) The Minimum and Maximum Values of Each Indicator Were Ascertained Based on the Values for That Indicator across States within the Grouping of States (Larger States, Smaller States, and Uts) For that Year: Indicator value lies between the ranges of 0 to 100; e.g. the State with the lowest institutional deliveries will get a scaled value of 0, while the State with the highest institutional deliveries will get a scaled value of 100. For a negative indicator such as NMR, the State with the highest NMR will get a scaled value of 0, while the one with the lowest NMR will get a scaled value of 100. Accordingly, the scaled value of other States will lie between 0 and 100 in both cases. Based on these scaled values (Si), a composite Index score was calculated for the base year and reference year by application of the weights using the formula:
Composite Index = (∑ Wi *Si)/ (∑ Wi) --Where Wi is the weight for I th indicator The composite Index score has been used for generating overall performance ranks. The difference between the composite Index score of reference and base years was the annual incremental performance. The ranking is primarily based on the incremental progress, however, rankings based on Index scores for the base year and the reference year performance calculated to provide the overall performance of the States and UTs.
Results
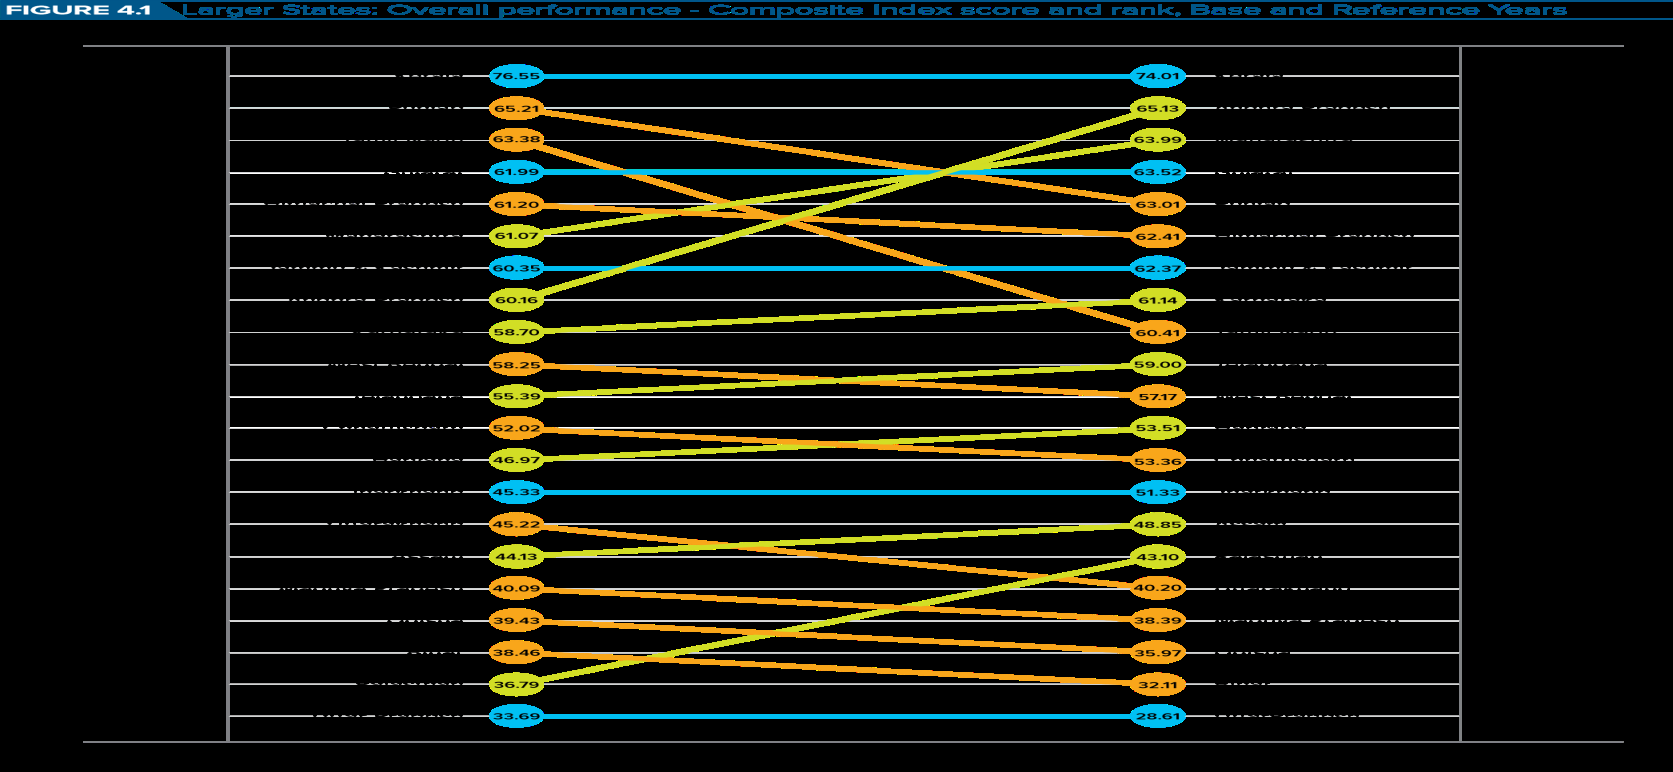
In the Reference Year (2017-18), the average composite Health Index score among Larger States was 53.22, compared to the Base Year (2015-16) average of 52.59. Health Index score across States, range from 28.61 in Uttar Pradesh to 74.01 in Kerala. There is no indication that the gap between poorest performing State and best-performing State is narrowing. Compared to the Base Year, the Health Index scores have increased in twelve States in the Reference Year. However, the index score has declined both for the poorest performing State (Uttar Pradesh) and the best performing State (Kerala). I have already mentioned in version 1 that it is very difficult for states that are on top performance to improve more and more and the lowest ranking states have more space in this field to improve and some states are also utilizing this to get advertisement of improvement [3, 4]. The top five best performing States based on the overall performance were Kerala (74.01), Andhra Pradesh (65.13), Maharashtra (63.99), Gujarat (63.52) and Punjab (63.01), while the 5 least performing States in the reference period were: Uttar Pradesh (28.61), Bihar (32.11), Odessa (35.97), Madhya Pradesh (38.39), and Uttarakhand (40.20).
Descriptive Data
Independent Validation of Data: IVA namely, Sambodhi Research and Communications Private Limited was hired by NITI Aayog to review and validate the data, Index scores and rankings of States and UTs. The data submitted on the portal was validated by the IVA from September to December 2018.
Outcome data Most Improved Improved No Change Deteriorated Most Deteriorated Not Applicable
See Table-6, 7, 8, 9, 10, 11, 12, 13, and 14 for outcome data,
| Larger States | 1.1.1. NMR (PER 1,000 Live Births) | 1.1.2. U5MR (PER 1,000 Live Births) | 1.1.3. TFR* | 1.1.4. LBW (Percentage) | 1.1.5. Sex Ratio at Birth (No. Of Girls, Born For Every 1,000 Boys Born) | |||||
|---|---|---|---|---|---|---|---|---|---|---|
| BY | RY | BY | RY | BY | RY | BY | RY | BY | RY | |
| Andhra Pradesh | 24 | 23 | 39 | 37 | 1.7 | 1.7 | 6.73 | 5.58 | 918 | 913 |
| Assam | 25 | 23 | 62 | 52 | 2.3 | 2.3 | 16.68 | 14.41 | 900 | 896 |
| Bihar | 28 | 27 | 48 | 43 | 3.2 | 3.3 | 7.22 | 9.23 | 916 | 908 |
| Chhattisgarh | 27 | 26 | 48 | 49 | 2.5 | 2.5 | 12.15 | 10.05 | 961 | 963 |
| Gujarat | 23 | 21 | 39 | 33 | 2.2 | 2.2 | 10.51 | 12.33 | 854 | 848 |
| Haryana | 24 | 22 | 43 | 37 | 2.2 | 2.3 | 14.9 | 8.47 | 831 | 832 |
| Himachal Pradesh | 19 | 16 | 33 | 27 | 1.7 | 1.7 | 12.63 | 12.59 | 924 | 917 |
| Jammu & Kashmir | 20 | 18 | 28 | 26 | 1.6 | 1.7 | 5.93 | 5.48 | 899 | 906 |
| Jharkhand | 23 | 21 | 39 | 33 | 2.7 | 2.6 | 7.42 | 7.12 | 902 | 918 |
| Karnataka | 19 | 18 | 31 | 29 | 1.8 | 1.8 | 11.49 | 10.01 | 939 | 935 |
| Kerala | 6 | 6 | 13 | 11 | 1.8 | 1.8 | 11.72 | 11.42 | 967 | 959 |
| Madhya Pradesh | 34 | 32 | 62 | 55 | 2.8 | 2.8 | 14.1 | 14.3 | 919 | 922 |
| Maharashtra | 15 | 13 | 24 | 21 | 1.8 | 1.8 | 13.74 | 12.06 | 878 | 876 |
| Odessa | 35 | 32 | 56 | 50 | 2 | 2 | 19.16 | 18.25 | 950 | 948 |
| Punjab | 13 | 13 | 27 | 24 | 1.7 | 1.7 | 6.88 | 8.41 | 889 | 893 |
| Rajasthan | 30 | 28 | 50 | 45 | 2.7 | 2.7 | 25.51 | 14.01 | 861 | 857 |
| Tamil Nadu | 14 | 12 | 20 | 19 | 1.6 | 1.6 | 13.03 | 15.49 | 911 | 915 |
| Telangana | 23 | 21 | 34 | 34 | 1.8 | 1.7 | 5.7 | 7.14 | 918 | 901 |
| Uttar Pradesh | 31 | 30 | 51 | 47 | 3.1 | 3.1 | 9.6 | 11.18 | 879 | 882 |
| Uttarakhand | 28 | 30 | 38 | 41 | 2 | 1.9 | 7.26 | 8.23 | 844 | 850 |
| West Bengal | 18 | 17 | 30 | 27 | 1.6 | 1.6 | 16.45 | 16.45 | 951 | 937 |
| Larger States | 1.2.1. Full Immunization (Percentage) | 1.2.2. Institutional Delivery (Percentage) | 1.2.3. TB Case Notification Rate (Per 1,00,000 Population) | 1.2.4. TB Case Treatment Success Rate (Per 1,00,000 Population) | 1.2.5. PLHIV ON ART** (PERCENTAG) | |||||
| BY | RY | BY | RY | BY | RY | BY | RY | BY/RY | ||
| Andhra Pradesh | 92 | 100 | 87 | 86 | 145 | 161 | 88.5 | 89 | 76.11 | |
| Assam | 88 | 83 | 74 | 72 | 123 | 119 | 86.2 | 77.5 | 64.58 | |
| Bihar | 90 | 90 | 57 | 56 | 84 | 82 | 89.7 | 71.9 | 37.18 | |
| Chhattisgarh | 91 | 87 | 65 | 76 | 138 | 145 | 89.1 | 88.6 | 53.06 | |
| Gujarat | 91 | 92 | 98 | 92 | 193 | 224 | 88.9 | 88.1 | 52.43 | |
| Haryana | 83 | 89 | 80 | 84 | 172 | 145 | 87.5 | 78.9 | 51.53 | |
| Himachal Pradesh | 95 | 79 | 67 | 68 | 207 | 226 | 89.6 | 89 | 79.89 | |
| Jammu & Kashmir | 100.0 | 100 | 81 | 85 | 72 | 74 | 88.3 | 85 | 96.41 | |
| Jharkhand | 88 | 100 | 67 | 88 | 108 | 118 | 90.9 | 91.7 | 39.4 | |
| Karnataka | 96 | 94 | 79 | 80 | 105 | 123 | 84.7 | 79.7 | 88.68 | |
| Kerala | 95 | 100 | 93 | 91 | 139 | 67 | 87.5 | 83.7 | 66.72 | |
| Madhya Pradesh | 75 | 78 | 65 | 62 | 164 | 167 | 90.3 | 82.5 | 61.01 | |
| Maharashtra | 98 | 96 | 85 | 90 | 164 | 159 | 84.2 | 79.5 | 87.71 | |
| Odisha | 85 | 60 | 73 | 71 | 99 | 159 | 88.9 | 72.5 | 32.95 | |
| Punjab | 99.64 | 93 | 82 | 82 | 136 | 153 | 87.2 | 85.9 | 84.62 | |
| Rajasthan | 78 | 82 | 74 | 75 | 143 | 139 | 90.3 | 89.9 | 46.41 | |
| Tamil Nadu | 83 | 76 | 82 | 81 | 125 | 119 | 85.4 | 75.9 | 87.06 | |
| Telangana | 89 | 90 | 85 | 92 | 123 | 107 | 89.6 | 90.4 | 76.11 | |
| Uttar Pradesh | 85 | 85 | 52 | 51 | 137 | 140 | 87.5 | 64 | 57.81 | |
| Uttarakhand | 99 | 95 | 63 | 67 | 138 | 151 | 86 | 77.6 | 65.25 | |
| West Bengal | 96 | 96 | 81 | 81 | 93 | 100 | 86.5 | 85.7 | 35.92 |
Table 6: Larger States: Health Outcomes domain indicators base and reference years. Source – NITI Aayog-India. **The data shown i
| Larger States | 2.1.1.A. Data Integrity: Institutional Delivery (Percentage)+ | 2.1.1.B Data Integrity: First Trimester Anc Registration (Percentage)+ | 2.2.1. Average Occupancy: State- Level 3 Key Posts (In Months) | 2.2.2. Average Occupancy: Cmos (In Months) | ||
|---|---|---|---|---|---|---|
| BY/RY | BY/RY | BY | RY | BY | RY | |
| Andhra Pradesh | 23.53 | 15.42 | 17.51 | 23.99 | 13.22 | 9.25 |
| Assam | 0.25 | 21.16 | 12.11 | 21.99 | 7.95 | 13.76 |
| Bihar | 18.21 | 16.33 | 13.01 | 18.98 | 11.88 | 13.25 |
| Chhattisgarh | 22.34 | 25.9 | 11.4 | 8.97 | 25.4 | 18.07 |
| Gujarat | 0.68 | 2.06 | 20.71 | 22.21 | 18.09 | 18.98 |
| Haryana | 4.62 | 19.08 | 11.21 | 7.35 | 12.56 | 13.2 |
| Himachal Pradesh | 12.72 | 7.3 | 12.39 | 15.65 | 10.5 | 18.33 |
| Jammu & Kashmir | 12.42 | 13.5 | 13.81 | 8.98 | 11.77 | 13.32 |
| Jharkhand | 7.95 | 53.48 | 12 | 10.77 | 11.46 | 10.01 |
| Karnataka | 21.22 | 8.2 | 6.49 | 6.69 | 13.23 | 15.69 |
| Kerala | 3.71 | 24.86 | 12.02 | 11.72 | 11.72 | 13.14 |
| Madhya Pradesh | 23.09 | 9.19 | 16 | 19.98 | 17.62 | 14.73 |
| Maharashtra | 1.16 | 5.61 | 15.74 | 9.98 | 15.64 | 17.37 |
| Odessa | 13.82 | 22.09 | 12.01 | 15.86 | 13.95 | 13.48 |
| Punjab | 12.41 | 9.97 | 20.42 | 14.36 | 10.19 | 8.41 |
| Rajasthan | 12.44 | 18.43 | 22.02 | 23.98 | 11.94 | 17.32 |
| Tamil Nadu | 10.92 | 22.75 | 16.51 | 26.39 | 7.29 | 7.74 |
| Telangana | 21.06 | 15.8 | 7.81 | 15.98 | 11.19 | 16.48 |
| Uttar Pradesh | 36.59 | 0.92 | 19.64 | 9.67 | 14.15 | 10.53 |
| Uttarakhand | 14.93 | 10.77 | 10.35 | 10.99 | 13.93 | 10.06 |
| West Bengal | 2.12 | 42.44 | 28.02 | 28.02 | 14.1 | 14.1 |
Table 7: Larger States: Governance and Information domain indicators, base and reference years. Source-NITI Aayog-India. + Same d
| Larger States | 3.1.1. A. Vacancy: Anms At Scs (Percentage) | 3.1.1. B. VACANCY: AT PHCS AND CHCS (Percentage) | 3.1.1. C. Vacancy: Sns Mos At Phcs (Percentage) | 3.1.1.D. Vacancy: Specialists At Dhs (Percentage) | 3.1.2. E-PAY SLIP (PERCENTAGE) | |||||
|---|---|---|---|---|---|---|---|---|---|---|
| BY | RY | BY | RY | BY | RY | BY | RY | BY | RY | |
| Andhra Pradesh | 15.67 | 17.08 | 20.48 | 12.75 | 12.8 | 10.6 | 30.4 | 25.1 | 58.65 | 100 |
| Assam | 8.99 | 4.6 | 8.95 | 11.81 | 17.8 | 25.5 | 41.7 | 47 | 0 | 0 |
| Bihar | 59.3 | 59.45 | 50.28 | 50.74 | 63.6 | 34.1 | 60.6 | 59.7 | 0 | 0 |
| Chhattisgarh | 9.23 | 9.47 | 37.28 | 41.26 | 45 | 57.3 | 77.7 | 70.8 | 0 | 12.04 |
| Gujarat | 28.08 | 10.32 | 36.46 | 23.67 | 32 | 30.2 | 55.5 | 21 | 35.61 | 39.54 |
| Haryana | 15.23 | 15.25 | 43.24 | 35.39 | 25.4 | 22.4 | 0 | 21.1 | 0 | 99.98 |
| Himachal Pradesh | 9.87 | 22.58 | 27.19 | 47.52 | 21.7 | 32.1 | NA | NA | 8.07 | 100 |
| Jammu & Kashmir | 10.28 | 9.44 | 27.48 | 17.93 | 30.2 | 28.8 | 22.2 | 25.4 | 0 | 0 |
| Jharkhand | 19.73 | 19.18 | 74.94 | 54.23 | 48.7 | 46.3 | 50.3 | 47.2 | 0 | 0 |
| Karnataka | 22.59 | 33.39 | 25.97 | 21.73 | 11.5 | 4.61 | 21.5 | 37.7 | 49.35 | 44.96 |
| Kerala | 4.49 | 5.3 | 5.3 | 3.62 | 5.86 | 2.41 | 21.5 | 13.5 | 100 | 100 |
| Madhya Pradesh | 14.23 | 13.84 | 33.5 | 42.22 | 58.3 | 55.1 | 51 | 49.1 | 0 | 0 |
| Maharashtra | 9.46 | 9.75 | 15.67 | 15.33 | 17 | 22.8 | 30.3 | 47.3 | 67.6 | 86.29 |
| Odessa | 0 | 0 | 0 | 0 | 26.9 | 31.9 | 19 | 27.4 | 75.79 | 76.38 |
| Punjab | 8.48 | 11.99 | 33.98 | 12.91 | 7.77 | 17.7 | 47.7 | 18.4 | 0 | 0 |
| Rajasthan | 19.24 | 24.22 | 47.26 | 50.46 | 14.9 | 12.2 | 45.8 | 22.4 | 0 | 69.38 |
| Tamil Nadu | 15.97 | 9.78 | 19.09 | 18.82 | 7.58 | 15.1 | 16.7 | 15.8 | 84.72 | 84.38 |
| Telangana | 18.01 | 14.64 | 12.79 | 7.22 | 22.3 | 15 | 54.8 | 53.5 | 0 | 33.03 |
| Uttar Pradesh | 0 | 0 | 1.89 | 0 | 26.7 | 4.78 | 32.4 | 28.7 | 0 | 54.58 |
Table 8: Larger States: Key Inputs/Processes domain indicator’s base and reference years.
| Uttarakhand | 16.88 | 16.88 | 20.02 | 16.32 | 12.2 | 69.7 | 60.3 | 68 | 0 | 0 | |||
|---|---|---|---|---|---|---|---|---|---|---|---|---|---|
| West Bengal | 0.77 | 0.77 | 9.7 | 9.7 | 41.2 | 41.2 | 20.2 | 20.2 | 81.23 | 81.23 | |||
| Larger States | 3.1.3. A. Functional Frus (Percentage) | 3.1.3. B. Functional 24/7 Phc (Percentage) | 3.1.4. Functional Ccus Per District *100 (Percentage) | 3.1.5. Proportion Of First Trimester Anc Registration (Percentage) | 3.1.6. Level Of Birth Registration (Percentage) | ||||||||
| BY | RY | BY | RY | BY | RY | BY | RY | BY | RY | ||||
| Andhra Pradesh | 57.58 | 89.9 | 29.15 | 22.67 | 53.9 | 53.9 | 74.4 | 78.7 | 100 | 95.7 | |||
| Assam | 72.58 | 90.32 | 176.9 | 83.01 | 0 | 0 | 80.6 | 84.8 | 100 | 100 | |||
| Bihar | 11.54 | 15.38 | 73.58 | 53.79 | 0 | 5.26 | 55.5 | 61.8 | 64.2 | 60.7 | |||
| Chhattisgarh | 23.53 | 27.45 | 40.39 | 111.4 | 3.7 | 3.7 | 74.6 | 89.5 | 100 | 100 | |||
| Gujarat | 42.98 | 63.64 | 31.46 | 56.29 | 48.5 | 48.5 | 74.9 | 78.4 | 95 | 98.8 | |||
| Haryana | 50.98 | 52.94 | 77.56 | 67.32 | 19.1 | 38.1 | 62.2 | 71.5 | 100 | 99.9 | |||
| Himachal Pradesh | 121.4 | 107.1 | 5.8 | 5.8 | 91.7 | 83.3 | 81.4 | 85.1 | 93.1 | 89.2 | |||
| Jammu & Kashmir | 196 | 220 | 45.6 | 38.4 | 27.3 | 31.8 | 53 | 64.8 | 75.5 | 77.6 | |||
| Jharkhand | 22.73 | 30.3 | 33.03 | 29.39 | 0 | 0 | 36.4 | 51.7 | 82 | 90.2 | |||
| Karnataka | 116.4 | 121.3 | 69.23 | 62.68 | 43.3 | 20 | 71.2 | 79.1 | 97.8 | 100 | |||
| Kerala | 120.9 | 107.5 | 0 | 0 | 64.3 | 78.6 | 80.6 | 83.2 | 100 | 97.1 | |||
| Madhya Pradesh | 49.66 | 51.03 | 56.47 | 68.32 | 9.8 | 9.8 | 63.8 | 62.8 | 82.6 | 74.6 | |||
| Maharashtra | 32.44 | 63.14 | 46.71 | 35.14 | 22.9 | 58.3 | 66.8 | 71.5 | 100 | 94 | |||
| Odisha | 65.48 | 69.05 | 30 | 26.43 | 3.33 | 33.3 | 75.8 | 83.6 | 98.5 | 97.5 | |||
| Punjab | 141.8 | 130.9 | 26.35 | 27.08 | 63.6 | 63.6 | 73 | 75.2 | 100 | 100 | |||
| Rajasthan | 29.2 | 32.85 | 68.03 | 43.5 | 70.6 | 24.2 | 60.7 | 62.8 | 98.2 | 100 | |||
| Tamil Nadu | 122.9 | 134 | 34.95 | 24.13 | 56.3 | 90.6 | 94.4 | 94.1 | 100 | 100 | |||
| Telangana | 80 | 114.3 | 26.99 | 25.57 | 0 | 0 | 55.9 | 47.3 | 95.6 | 97.3 | |||
| Uttar Pradesh | 15.75 | 25.75 | 17.42 | 20.42 | 0 | 0 | 48.7 | 45.2 | 68.3 | 60.7 | |||
| Uttarakhand | 95 | 65 | 54.46 | 50.5 | 0 | 15.4 | 62.5 | 61 | 86 | 100 | |||
| West Bengal | 49.18 | 49.18 | 5.91 | 5.91 | 76.9 | 76.9 | 77 | 77 | 92.5 | 97.9 | |||
| Larger States | 3.1.7. Idsp Reporting Of P Form (Percentage) | 3.1.7. Idsp Reporting L Form (Percentage) | 3.1.8. Chc Grading (Percentage) | 3.1.9. Quality Accreditation Dh- Sdh (Percentage) | 3.1.9. Quality Accreditation Chc-Phc (Percentage) | 3.1.10. Fund Transfer (No. Of Days) | |||||||
| BY | RY | BY | RY | BY | RY | BY | RY | BY | RY | BY | RY | ||
| Andhra Pradesh | 99 | 100 | 99 | 100 | 37.2 | 87.4 | 0 | 12.8 | 0 | 0.5 | 127 | 93 | |
| Assam | 88 | 93 | 88 | 95 | 31.1 | 62.4 | 0 | 0 | 0 | 0 | 242 | 28 | |
| Bihar | 88 | 84 | 87 | 84 | 20.3 | 19.1 | 27.2 | 0 | 1.5 | 0 | 40 | 191 | |
| Chhattisgarh | 84 | 87 | 82 | 79 | 47.7 | 67.1 | 0 | 0 | 0 | 0 | 57 | 61 | |
| Gujarat | 95 | 85 | 96 | 89 | 49.4 | 29.8 | 2.99 | 31 | 0.6 | 8.3 | 24 | 68 | |
| Haryana | 84 | 83 | 88 | 87 | 22 | 41.5 | 0 | 9.3 | 0 | 7.6 | 42 | 58 | |
| Himachal Pradesh | 66 | 88 | 62 | 86 | 5.06 | 2.6 | 1.37 | 0 | 0 | 0 | 47 | 58 | |
| Jammu & Kashmir | 80 | 80 | 75 | 76 | 61.9 | 62.1 | 0 | 0 | 0 | 0 | 107 | 137 | |
| Jharkhand | 73 | 73 | 72 | 74 | 54.4 | 55.3 | 0 | 0 | 0 | 0 | 67 | 187 | |
| Karnataka | 95 | 92 | 94 | 90 | 31.3 | 50.2 | 0.53 | 1.6 | 0 | 0 | 139 | 105 | |
| Kerala | 96 | 92 | 96 | 95 | 0.44 | 0.43 | 10 | 7.59 | 6.5 | 4.6 | 107 | 107 | |
| Madhya Pradesh | 80 | 75 | 80 | 75 | 57.2 | 67.6 | 0 | 2.56 | 0.6 | 0.6 | 41 | 37 | |
| Maharashtra | 79 | 88 | 76 | 84 | 38.5 | 59.3 | 0 | 0 | 0.3 | 0.3 | 66 | 95 | |
| Odisha | 83 | 90 | 74 | 82 | 22.8 | 46.4 | 15.3 | 15.3 | 0 | 0 | 59 | 19 | |
| Punjab | 73 | 76 | 85 | 88 | 26.7 | 38.4 | 0 | 7.94 | 0 | 0 | 78 | 148 | |
| Rajasthan | 73 | 80 | 68 | 78 | 54.5 | 56.3 | 0 | 1.82 | 0 | 0 | 48 | 109 | |
| Tamil Nadu | 90 | 76 | 87 | 75 | 76.1 | 62.1 | 4.29 | 2.26 | 4.9 | 1.6 | 50 | 46 | |
| Telangana | 97 | 93 | 95 | 95 | 11.6 | 36.6 | 0 | 0 | 0 | 0 | 287 | 0 | |
| Uttar Pradesh | 42 | 69 | 57 | 67 | 44.1 | 48.2 | 0 | 7.5 | 0 | 0 | 93 | 118 | |
| Uttarakhand | 93 | 88 | 93 | 88 | 8.33 | 11.8 | 0 | 0 | 0 | 0 | 27 | 109 | |
| West Bengal | 78 | 91 | 80 | 87 | 53.7 | 74.4 | 0 | 0 | 0 | 0 | 51 | 64 |
Table 9: Larger States: Key Inputs/Processes domain indicator’s base and reference years.
| Smaller States | 1.1.4. LBW (Percentage) | 1.2.1. Full Immunization (Percentage) | 1.2.2. Institutional Delivery (Percentage) | 1.2.3. TB Case Notification Rate (Per 1,00,000 Population) | 1.2.4. TB Treatment Success Rate (Percentage) | 1.2.5. Plhiv On Art** (Percentage) | |||||
|---|---|---|---|---|---|---|---|---|---|---|---|
| BY | RY | BY | RY | BY | RY | BY | RY | BY | RY | BY/RY | |
| Arunachal Pradesh | 6.55 | 6.41 | 65 | 65.5 | 56.5 | 63 | 183 | 203 | 86 | 65 | 28.19 |
| Goa | 15.6 | 15.6 | 95.2 | 97.1 | 92.5 | 86.6 | 131 | 128 | 87 | 85 | 72.75 |
| Manipur | 3.53 | 4.45 | 96.3 | 100 | 73.5 | 79.7 | 81 | 94 | 83 | 80 | 63.87 |
| Meghalaya | 7.65 | 7.7 | 93.3 | 77.6 | 62.1 | 62.7 | 137 | 116 | 86 | 80 | 100 |
| Mizoram | 4.65 | 4.72 | 100 | 90.8 | 96.3 | 95.1 | 186 | 186 | 91 | 74 | 100 |
| Nagaland | 3.89 | 4.09 | 63.9 | 58.2 | 58.1 | 54.3 | 139 | 148 | 72 | 68 | 73.8 |
| Sikkim | 7.76 | 7.63 | 74.4 | 70 | 70.2 | 66.3 | 241 | 197 | 77 | 66 | 33.51 |
| Tripura | 11.1 | 13.6 | 84.3 | 86.1 | 79.4 | 88.4 | 61 | 44 | 89 | 71 | 5.8 |
Table 10: Smaller States: Health Outcomes domain indicators, base and reference years. Source – NITI Aayog-India. ** Data repeated
| Smaller States | 2.1.1. A. Data Integrity: Institutional Delivery (Percentage)+ | 2.1.1. B. Data Integrity: First Trimester Anc Registration trimester Anc Registration (Percentage)+ | 2.2.1. Average Occupancy: State- Level 3 Key Post (In Months) | 2.2.2. Average Occupancy: Cmos (In Months) | ||
|---|---|---|---|---|---|---|
| BY/RY | BY/RY | BY | RY | BY | RY | |
| Arunachal Pradesh | 1.36 | 5.62 | 13.9 | 11.4 | 17.5 | 18.2 |
| Goa | 5.01 | 23.74 | 21.7 | 14 | 12 | 12 |
| Manipur | 2.87 | 28.19 | 21 | 12 | 17.3 | 25.9 |
| Meghalaya | 13.44 | 10.56 | 19.3 | 9.97 | 14.8 | 22.7 |
| Mizoram | 22 | 18.71 | 9.77 | 13.9 | 26 | 26 |
| Nagaland | 54.79 | 107.87 | 7.25 | 5.81 | 19.9 | 23.4 |
| Sikkim | 29.16 | 26.76 | 24 | 24 | 25.5 | 25.5 |
| Tripura | 3.35 | 10.89 | 10.9 | 11.9 | 17.3 | 24.9 |
Table 11: Smaller States: Governance and Information domain indicators, base and reference years. Source-NITI Aayog-India.
| Smaller States | 3.1.1.A. Vacancy: Anms At Scs (Percentage) | 3.1.1.B. Vacancy: Sns At Phcs And Chcs (Percentage) | 3.1.1.C. Vacancy: Mos At Phcs (Percentage) | 3.1.1.D. Vacancy: Specialists At Dhs (Percentage) | 3.1.2. E-Payslip (Percentage) | |||||||
|---|---|---|---|---|---|---|---|---|---|---|---|---|
| BY | RY | BY | RY | BY | RY | BY | RY | BY | RY | |||
| Arunachal Pradesh | 22.37 | 13.5 | 28.78 | 15.63 | 38.75 | 30.23 | 89.11 | 69.96 | 38.8 | 21.5 | ||
| Goa | 30.1 | 20 | 11.68 | 28.57 | 14.22 | 20.19 | 39.7 | 36.74 | 0 | 0 | ||
| Manipur | 29.89 | 27.3 | 18.98 | 20.12 | 42.76 | 43.06 | 47.67 | 45.1 | 0 | 0 | ||
| Meghalaya | 20 | 10.7 | 31.05 | 12.56 | 35.67 | 30.9 | 29.73 | 41.55 | 0 | 0 | ||
| Mizoram | 16.07 | 20.2 | 6.11 | 7.12 | 38.1 | 2.38 | 15.22 | 15.58 | 0 | 0 | ||
| Nagaland | 11.01 | 0 | 0 | 0 | 27.36 | 0 | 0 | 0 | 0 | 0 | ||
| Sikkim | 0 | 0 | 61.96 | 30.43 | 0 | 0 | 34.38 | 31.25 | 0 | 0 | ||
| Tripura | 38.9 | 24.6 | 0 | 0 | 2.06 | 0 | NA | 1.41 | 0 | 100 | ||
| Smaller States | 3.1.3. A. Functional Frus (Percentage) | 3.1.3.B. Functional 24/7 Phc (Percentage) | 3.1.4. Functional Ccus Per District *100 (Percentage) | 3.1.5. Proportion Of First Trimester Anc (Percentage) | 3.1.6. Level Of Birth Registration (Percentage) | |||||||
| BY | RY | BY | RY | BY | RY | BY | RY | BY | RY | |||
| Arunachal Pradesh | 133.3 | 200 | 42.86 | 35.71 | 0 | 0 | 36.99 | 34.73 | 100 | 100 | ||
| Goa | 100 | 100 | 6.67 | 0 | 0 | 50 | 58.74 | 55.33 | 100 | 84.4 | ||
| Manipur | 66.67 | 66.7 | 65.52 | 44.83 | 0 | 0 | 63.23 | 61.14 | 100 | 100 | ||
| Meghalaya | 100 | 66.7 | 180 | 203.3 | 0 | 0 | 32.07 | 34.38 | 100 | 100 | ||
| Mizoram | 100 | 200 | 136.4 | 118.2 | 11.11 | 11.11 | 73.61 | 75.36 | 100 | 100 | ||
| Nagaland | 125 | 100 | 165 | 150 | 9.09 | 9.09 | 35.83 | 29.73 | 100 | 100 | ||
| Sikkim | 200 | 200 | 216.7 | 366.7 | 0 | 0 | 79.89 | 76.97 | 74.1 | 66.2 | ||
| Tripura | 57.14 | 85.7 | 116.2 | 121.6 | 0 | 0 | 61.85 | 60.92 | 81.7 | 82.4 | ||
| Smaller States | 3.1.7. Idsp Reporting Of P Form (Percentage) | 3.1.7. Idsp Reporting L Form (Percentage) | 3.1.8. Chc Grading (Percentage) | 3.1.9. Quality Accreditation Dh-Sdh (Percentage) | 3.1.9. Quality Accredi tation Chc-Phc (Percentage) | 3.1.10. Fund Transfer (No. Of Days) | ||||||
| BY | RY | BY | RY | BY | RY | BY | RY | BY | RY | BY | RY | |
| Arunachal Pradesh | 82 | 82 | 77 | 74 | 0 | 3.23 | 5 | 0 | 0 | 0 | 143 | 108 |
| Goa | 79 | 80 | 88 | 82 | 75 | 100 | 0 | 0 | 0 | 0 | 154 | 151 |
| Manipur | 63 | 77 | 38 | 60 | 29.41 | 23.53 | 12.5 | 0 | 0 | 0 | 258 | 119 |
| Meghalaya | 84 | 91 | 82 | 89 | 7.41 | 10.34 | 0 | 9.0 | 0 | 0 | 38 | 58 |
| Mizoram | 48 | 96 | 58 | 96 | 0 | 0 | 0 | 10 | 0 | 0 | 177 | 61 |
| Nagaland | 79 | 71 | 65 | 65 | 0 | 0 | 0 | 0 | 0 | 0 | 213 | 94 |
| Sikkim | 97 | 100 | 100 | 95 | 0 | 0 | 0 | 0 | 0 | 0 | 153 | 133 |
| Tripura | 97 | 93 | 94 | 86 | 0 | 0 | 0 | 5.5 | 0 | 0 | 69 | 38 |
Table 12: Smaller States: Key Inputs/Processes domain indicators, base and reference years. Source-NITI Aayog-India.
| UT | 1.1.4. Lbw (Percentage) | 1.2.1. Full Immunization (Percentage) | 1.2.2. Institutional Delivery (Percentage) | 1.2.3. Tb Case Notification Rate (Per 1,00,000 Population) | 1.2.4. Tb Treatment Success Rate (Percentage) | |||||
|---|---|---|---|---|---|---|---|---|---|---|
| BY | RY | BY | RY | BY | RY | BY | RY | BY | RY | |
| Andaman & Nicobar Islands | 17.17 | 16.63 | 100 | 77.22 | 80.2 | 75.71 | 139 | 76 | 91.5 | 83.9 |
| Chandigarh | 20.77 | 20.89 | 93.58 | 83.4 | 100 | 100 | 305 | 523 | 85.6 | 86.8 |
| Dadra & Nagar Haveli | 29.39 | 36.88 | 77.06 | 79.12 | 87.09 | 87.21 | 133 | 225 | 86.3 | 89.6 |
| Daman & Diu | 24.37 | 20.68 | 79.67 | 52.83 | 72 | 47.37 | 166 | 151 | 79.5 | 92.6 |
| Delhi | 21.43 | 19.6 | 96.21 | 99.82 | 80.6 | 82.84 | 348 | 360 | 86.7 | 84.8 |
| Lakshadweep | 5.56 | 7.44 | 100 | 77.08 | 85.4 | 65 | 35 | 70 | 91.3 | 93.8 |
| Pondicherry | 15.5 | 14.61 | 77.6 | 69.5 | 100 | 100 | 103 | 114 | 89.2 | 88.8 |
Table 13: (UT) Union Territories: Health Outcomes Domain Indicators base and Reference Years. Source-NITI Aayog-India.
| UT | 2.1.1.A. Data Integrity: Institutional Delivery (Percentage)+ | 2.1.1.B Data Integrity: First Trimester Anc Registration (Percentage)+ | 2.2.1. Average Occupancy: State-Level 3 Key Posts (In Months) | 2.2.2. Average Occupancy: Cmos (In Months) | ||
|---|---|---|---|---|---|---|
| BY/RY | BY/RY | BY | RY | BY | RY | |
| Andaman & Nicobar Islands | 18.05 | 2.84 | 15 | 14.4 | 17.4 | 13.3 |
| Chandigarh | 57.98 | 27.88 | 12 | 18 | 15.6 | 8.95 |
| Dadra & Nagar Haveli | 15.11 | 22.12 | 14.4 | 19 | 18 | 36 |
| Daman & Diu | 17.43 | 15.27 | 21 | 10.8 | 36 | 18 |
| Delhi | 10.76 | 27.77 | 9.63 | 6.98 | 16.7 | 25 |
| Lakshadweep | 29.35 | 12.19 | 26.8 | 14 | NA | NA |
| Pondicherry | 90.52 | 48.82 | 20 | 24.7 | 25.3 | 22.5 |
Table 14: Union Territories: Governance and Information Domain Indicators base and Reference Years. +Same data have been used for
| UT | 3.1.1.A. Vacancy: ANMS At SCS (Percentage) | 3.1.1.B. Vacancy: Sn At Phcs And Chcs (Percentage) | 3.1.1.C. Vacancy: Mos At Phcs (Percentage) | 3.1.1.D. Vacancy: Specialists At Dhs (Percentage) | 3.1.2. E-Payslip (Percentage) | |||||||||||
|---|---|---|---|---|---|---|---|---|---|---|---|---|---|---|---|---|
| BY | RY | BY | RY | BY | RY | BY | RY | BY | RY | |||||||
| Andaman & Nicobar Islands | 7.84 | 9.8 | 7.45 | 4.35 | 36.36 | 10.61 | 100 | 71.43 | 0 | 0 | ||||||
| Chandigarh | 29.41 | 14.7 | 6.19 | 0 | 69.17 | 0 | 0 | 11.36 | 61.33 | 100 | ||||||
| Dadra & Nagar Haveli | 0 | 0.93 | 4.88 | 2.13 | 16.67 | 16.67 | 18.18 | 12.5 | 0 | 0 | ||||||
| Daman & Diu | 11.86 | 0 | 0 | 8.89 | 7.14 | 28.57 | 47.06 | 56.41 | 0 | 0 | ||||||
| Delhi | 19.75 | 8.91 | 40.75 | 46.9 | 14.21 | 26.29 | 40.21 | 40.81 | 68.81 | 55.77 | ||||||
| Lakshadweep | 0 | 0 | 0 | 0 | 0 | 0 | 76.47 | 46.15 | 0 | 0 | ||||||
| Pondicherry | 8.73 | 11.7 | 2.38 | 4.62 | 12.78 | 16.14 | 20.56 | 35.11 | 78.3 | 90.2 | ||||||
| UT | 3.1.3.A. Functional Frus (Percentage) | 3.1.3.B. Functional 24/7 Phc (Percentage) | 3.1.4. Functional Ccus Per District *100 (Percentage) | 3.1.5. Proportion Of First Trimester Anc (Percentage) | 3.1.6. Level Of Birth Registration (Percentage) | |||||||||||
| BY | RY | BY | RY | BY | RY | BY | RY | BY | RY | |||||||
| Andaman & Nicobar Islands | 0 | 0 | 500 | 0 | 0 | 0 | 76.94 | 75.11 | 71.9 | 75.6 | ||||||
| Chandigarh | 150 | 250 | 0 | 0 | 0 | 200 | 36.79 | 66.34 | 100 | 100 | ||||||
| Dadra & Nagar Haveli | 100 | 100 | 133.3 | 66.67 | 0 | 100 | 84.77 | 95.9 | 65.1 | 86.2 | ||||||
| Daman & Diu | 100 | 200 | 50 | 100 | 0 | 0 | 49.26 | 80.79 | 76.4 | 49.9 | ||||||
| Delhi | 100 | 82.3 | 0.6 | 0 | 90.9 | 72.7 | 33.69 | 33.18 | 100 | 100 | ||||||
| Lakshadweep | 100 | 100 | 0 | 0 | 100 | 100 | 73.24 | 79.72 | 59.5 | 54.5 | ||||||
| Puducherry | 200 | 400 | 0 | 0 | 25 | 50 | 39.54 | 33.58 | 100 | 100 | ||||||
| UT | 3.1.7. Idsp Reporting of P Form (Percentage) | 3.1.7. Idsp Reporting L Form (Percentage) | 3.1.8. Chc Grading (Percentage) | 3.1.9. Quality Accredi tation Dh-Sdh (Percentage) | 3.1.9. Quality Accreditation Chc-Phc (Percentage) | 3.1.10. Fund Transfer (No. of Days) | ||||||||||
| BY | RY | BY | RY | BY | RY | BY | RY | BY | RY | BY | RY | |||||
| Andaman & Nicobar Islands | 50 | 82 | 21 | 82 | 0 | 50 | 0 | 0 | 0 | 0 | 78 | 0 | ||||
| Chandigarh | 78 | 94 | 88 | 93 | 100 | 100 | 0 | 0 | 0 | 0 | 35 | 0 | ||||
| Dadra & Nagar Haveli | 91 | 100 | 89 | 92 | NA | 100 | 0 | 50 | 0 | 0 | 62 | 0 | ||||
| Daman & Diu | 75 | 100 | 75 | 100 | 0 | 0 | 0 | 0 | 0 | 0 | 0 | 0 | ||||
| Delhi | 57 | 78 | 56 | 81 | 0 | 4 | 8.9 | 7.0 | 0 | 0 | 89 | 123 | ||||
| Lakshadweep | 0 | 0 | 0 | 0 | 0 | 0 | 0 | 0 | 0 | 0 | 0 | 0 | ||||
| Puducherry | 90 | 100 | 88 | 100 | 25 | 25 | 0 | 0 | 0 | 0 | 55 | 85 |
Table 15: Union Territories: Key Inputs/Processes Domain Indicators, Base and Reference Years. Source-NITI Aayog-India.
Main Results: see Figure 4.1/ E.1/E.2/ E.3 and table- 15/16/17/E.3
| Overall Performance | |||
|---|---|---|---|
| Incremental Performance | Aspirants | Achievers | Front-runners |
| not Improved (0 or less) | Madhya Pradesh | West Bengal | Kerala |
| Odessa | Punjab | ||
| Uttarakhand | Tamil Nadu | ||
| Uttar Pradesh Bihar | |||
| least Improved (0.01-2.0) | – | Chhattisgarh | Gujarat |
| Himachal Pradesh | |||
| moderately Improved (2.01-4.0) | – | – | Maharashtra |
| Jammu & Kashmir | |||
| Karnataka | |||
| Telangana | |||
| most Improved (more than 4.0) | Rajasthan | Haryana | Andhra Pradesh |
| Jharkhand | |||
| Assam |
Table 16: Larger States: Overall performance in Reference Year-Categorization. Source-NITI Aayog-India.
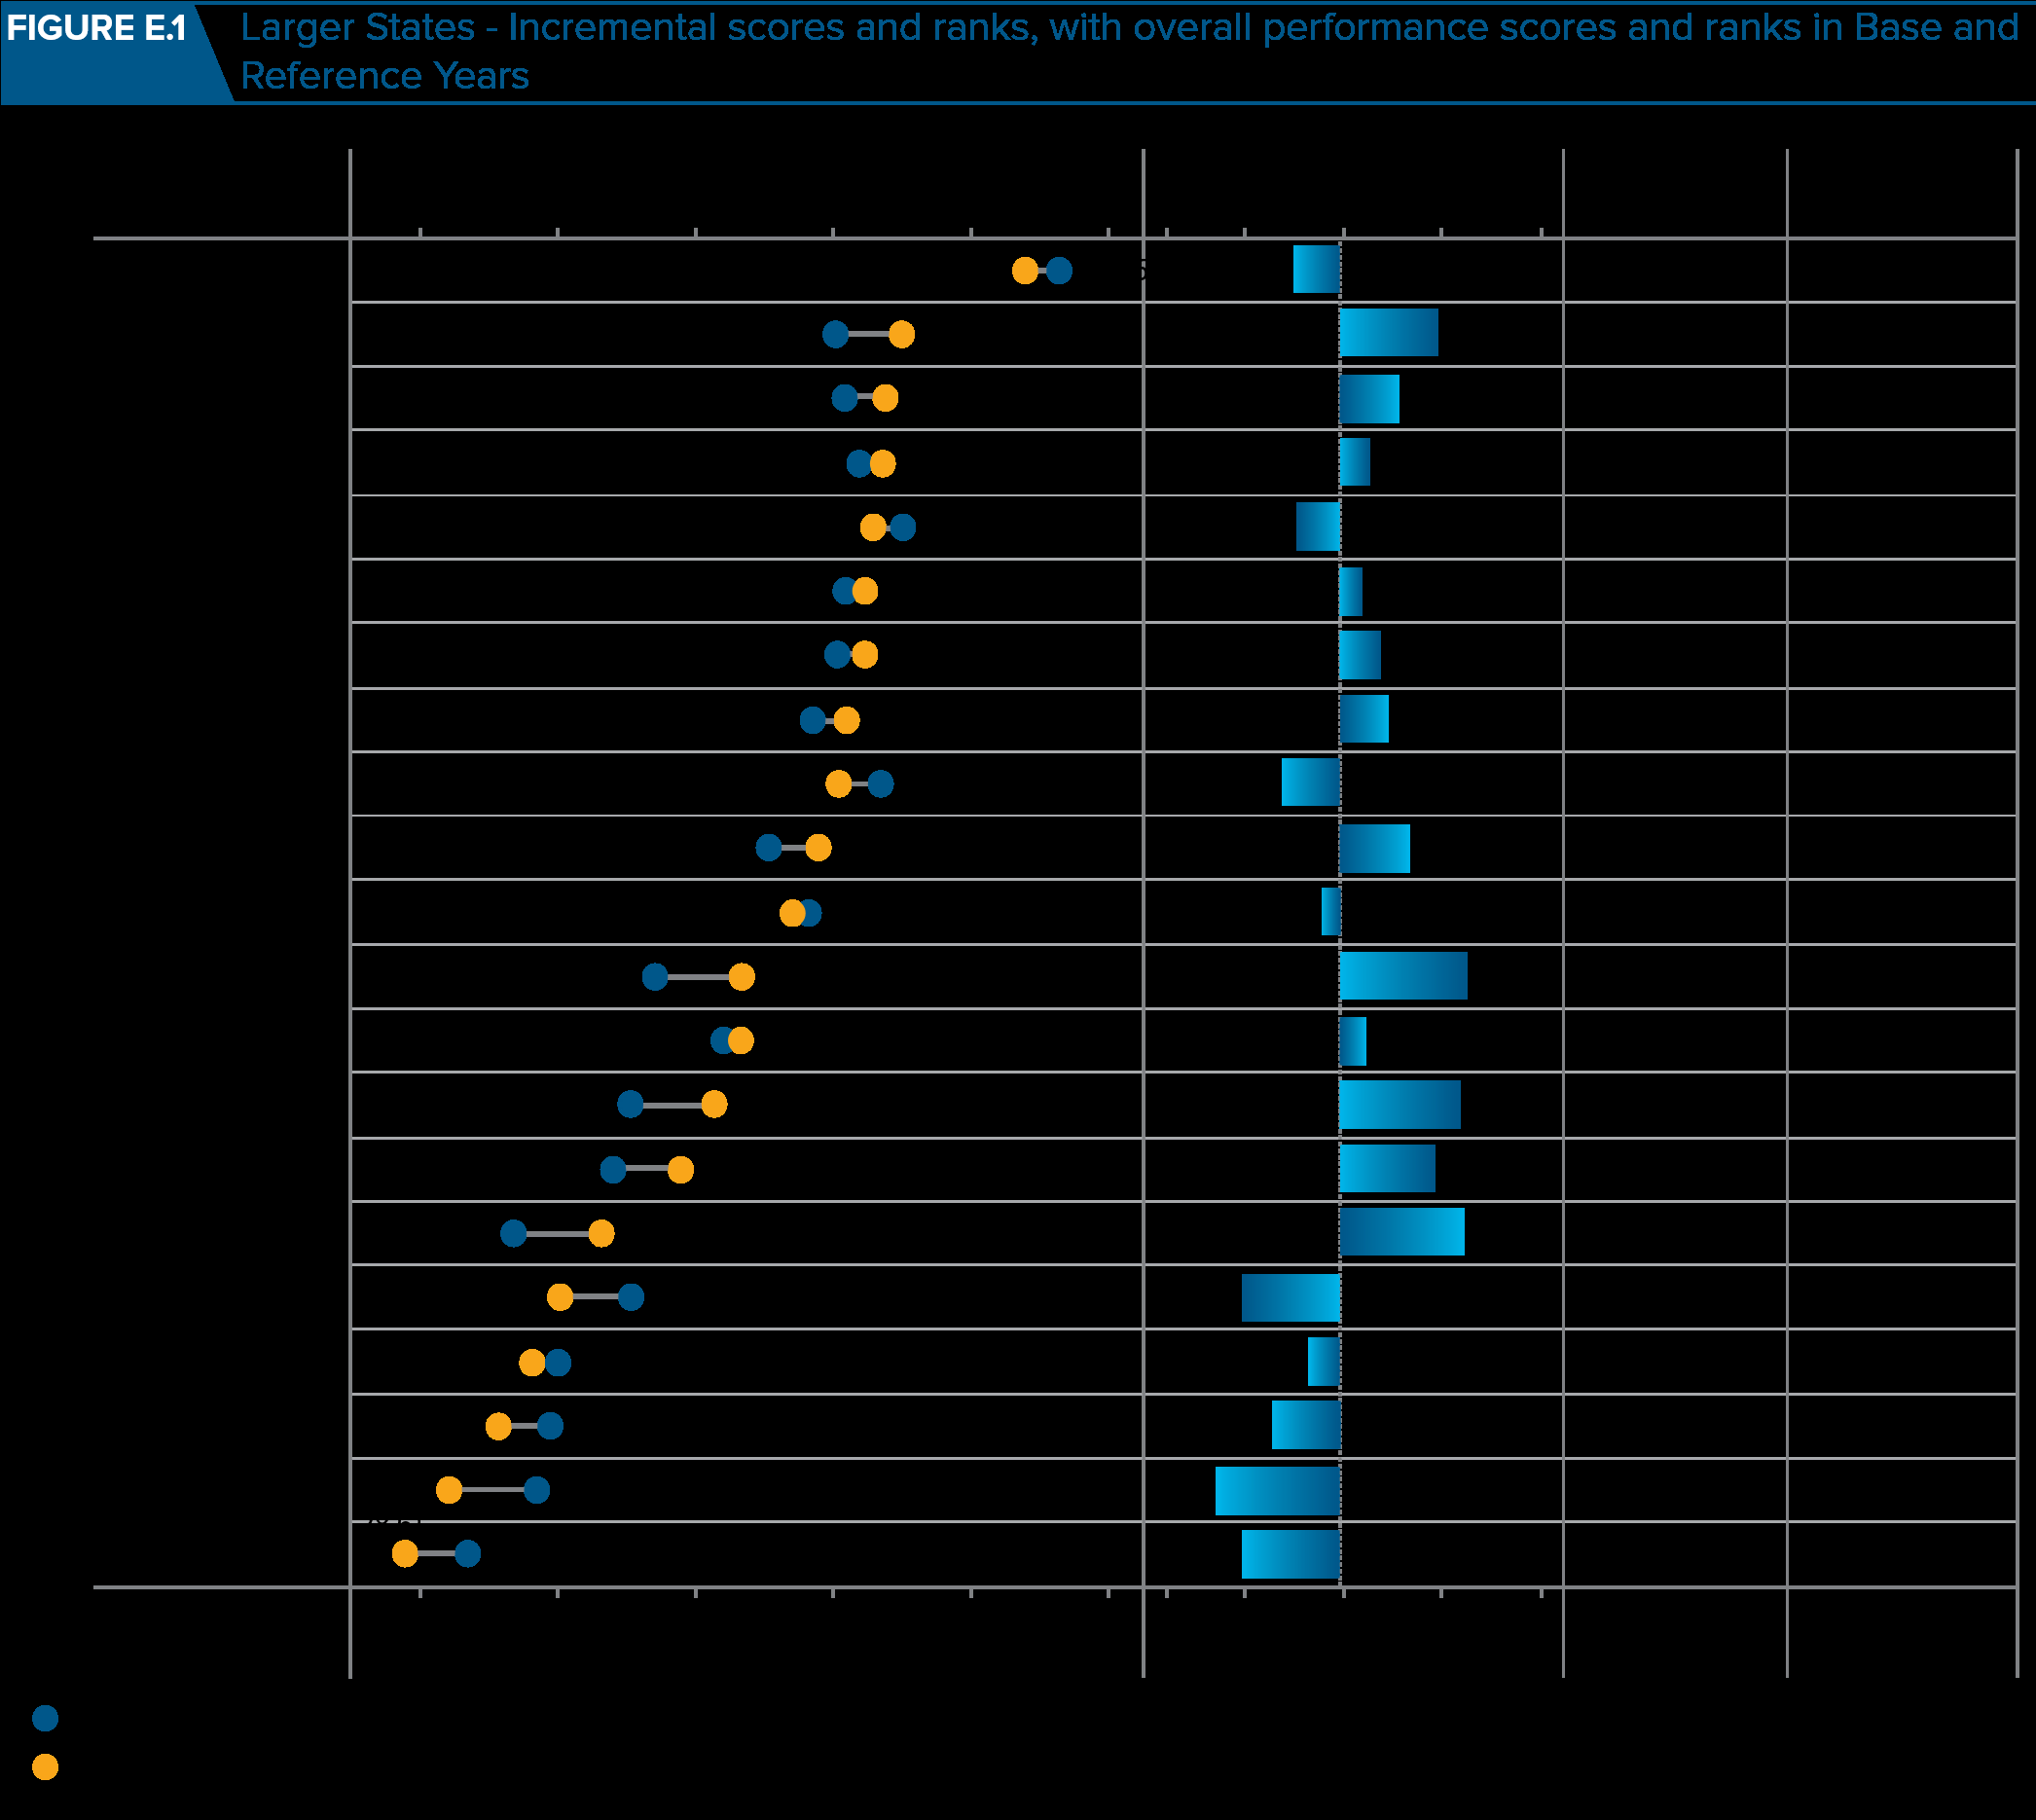
Figure E.1: Larger States: Overall and incremental performance, Base and Reference Years and incremental rank. Source-NITI Aayog-India Note: As West Bengal did not submit data on the portal, the overall and incremental performance scores were generated based on pre-filled indicator data for 12 indicators and for the remaining 11 indicators the data from the Base Year were repeated for the Reference Year. Base (2015-16) Year Reference Year (2017-18)
| Not Improved | Least Improved | Moderately Improved | Most Improved |
|---|---|---|---|
| West Bengal | Gujarat | Telangana | Haryana |
| Madhya Pradesh | Chhattisgarh | Maharashtra | Rajasthan |
| Punjab | Himachal Pradesh | Karnataka | Jharkhand |
| Kerala | Jammu and Kashmir | Andhra Pradesh | |
| Tamil Nadu | Assam | ||
| Odisha | |||
| Uttarakhand | |||
| Uttar Pradesh | |||
| Bihar |
Table 17: Larger States: Incremental performance from Base to Reference Year-Categorization. Source-NITI Aayog-India.
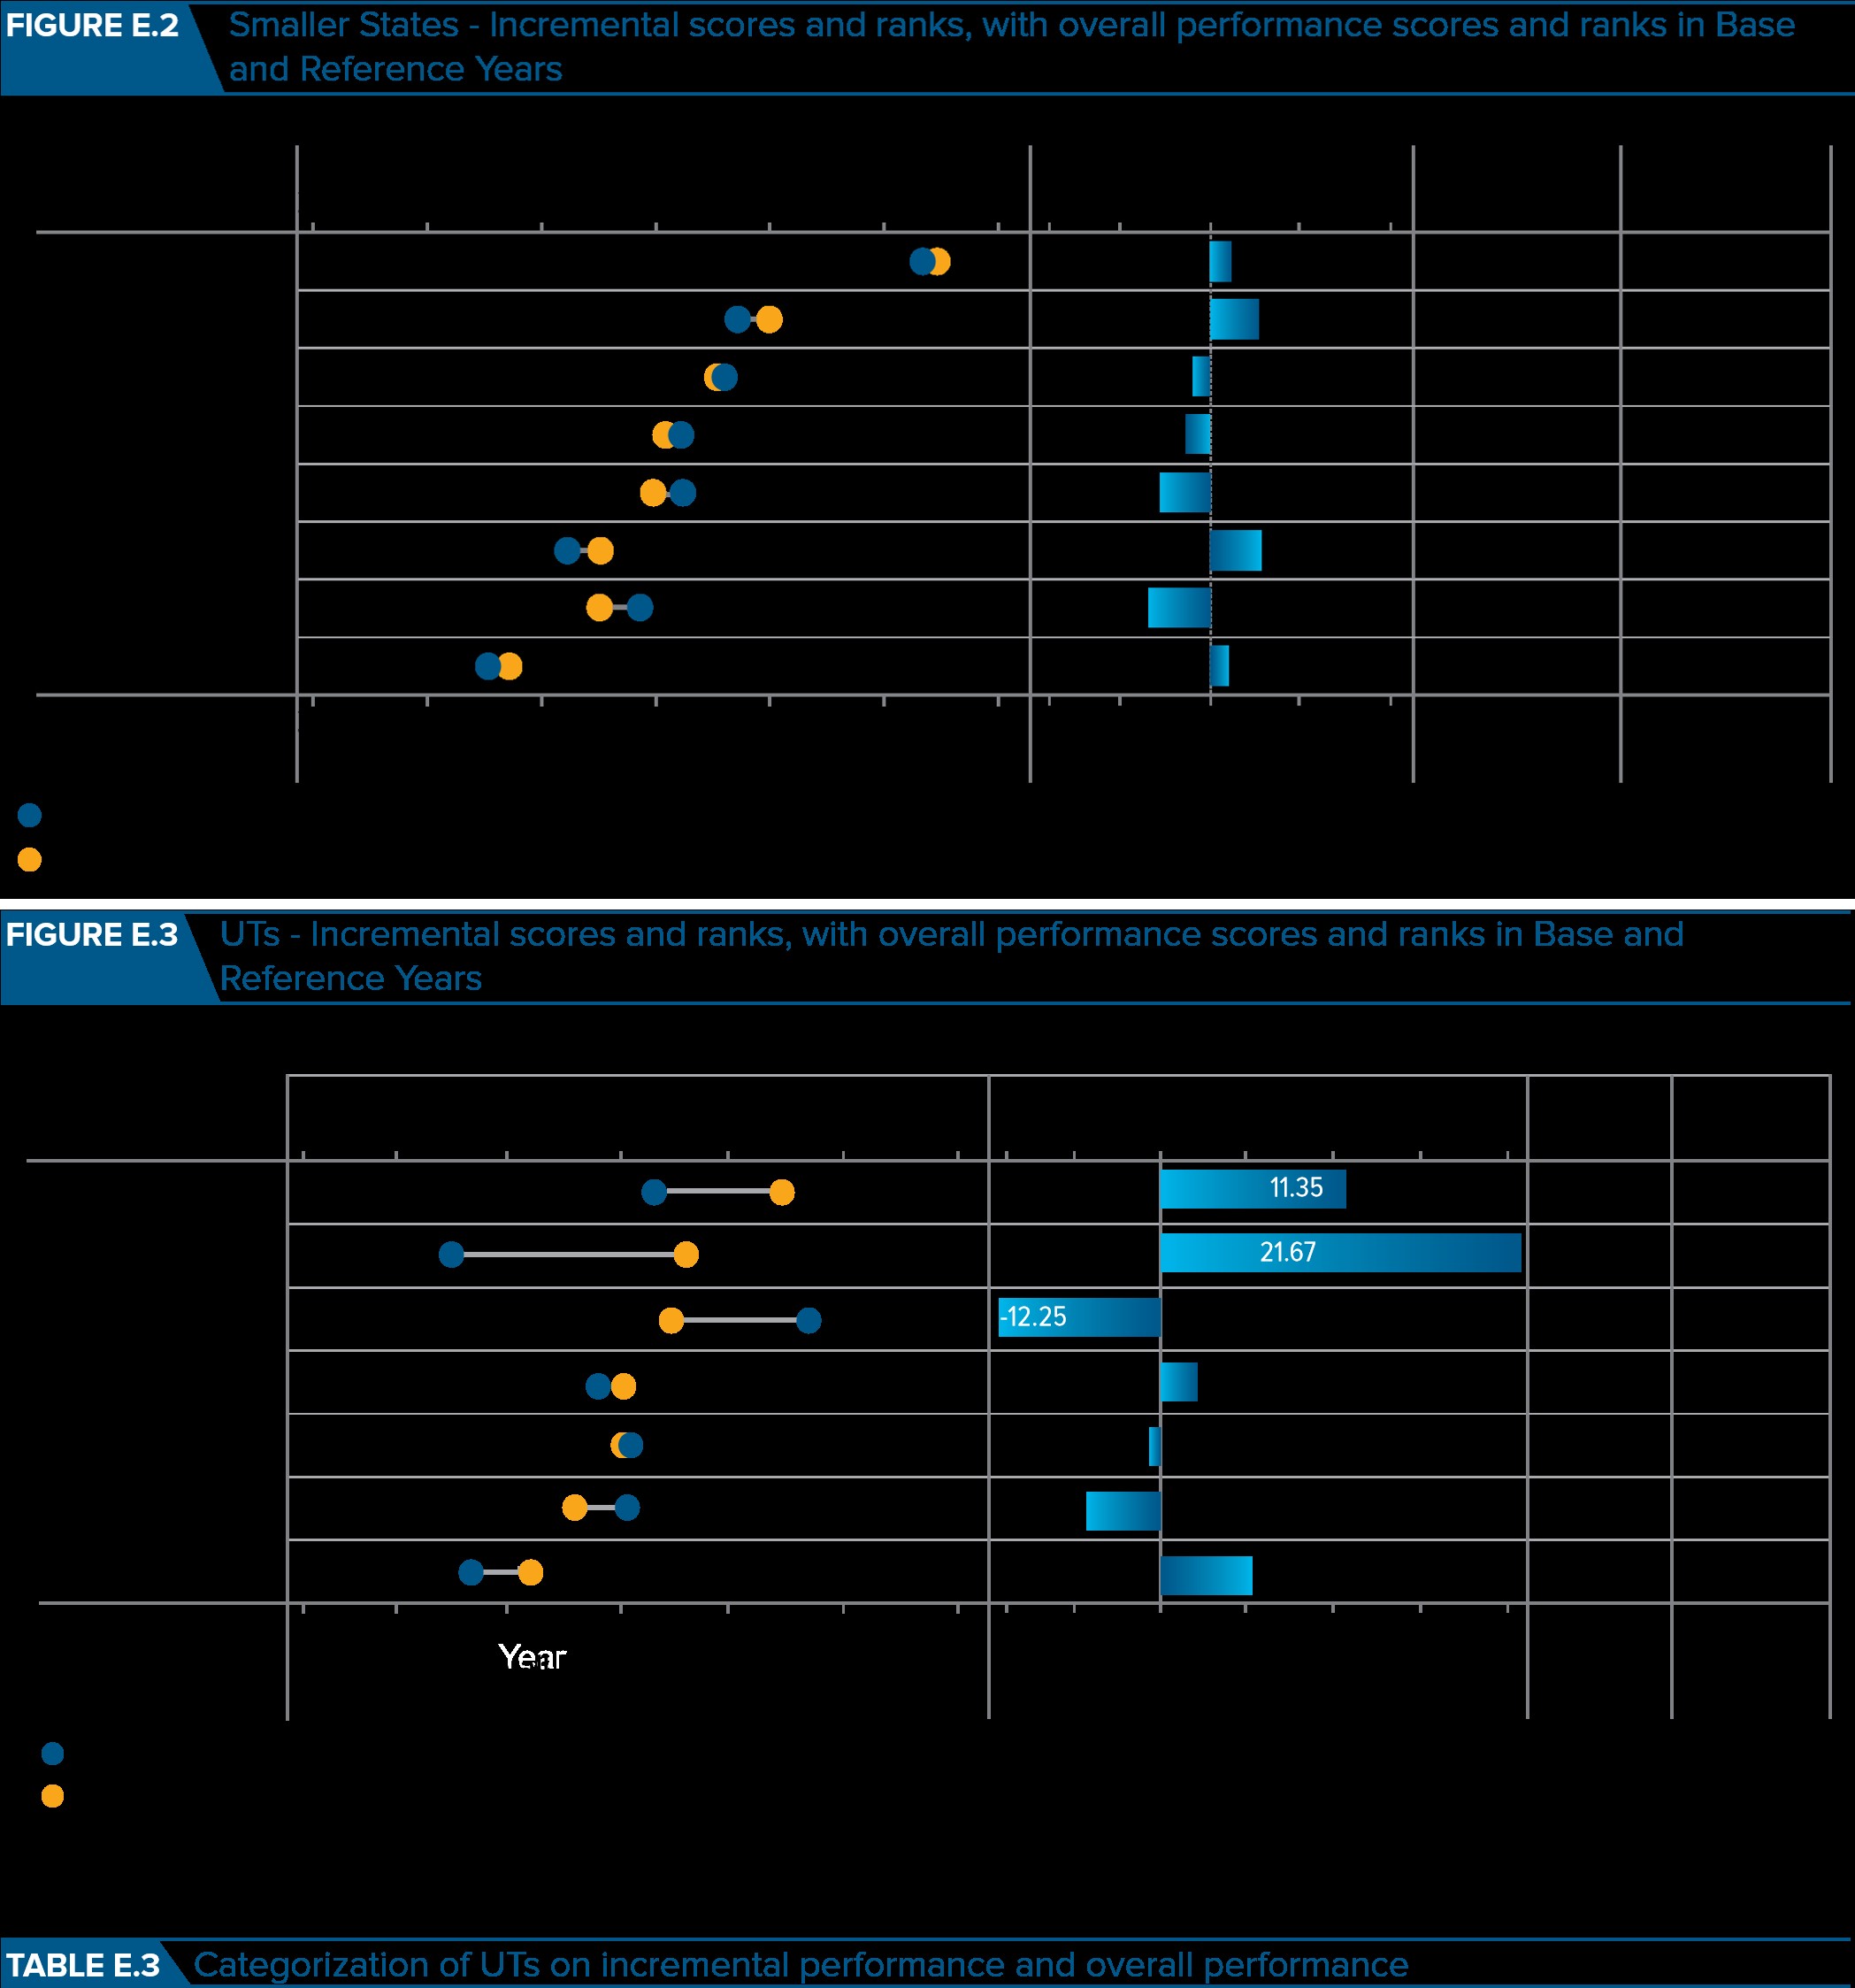
Figure E.2: Smaller States: Incremental scores and ranks, with overall performance from base year to reference year and ranks. Source-NITI Aayog-India
| Overall Performance | |||
|---|---|---|---|
| Incremental Performance | Aspirants | Achievers | Front-runners |
| not Improved (0 or less) | Arunachal Pradesh Sikkim | Meghalaya Goa | – |
| least Improved (0.01-2.0) | Nagaland | – | Mizoram |
| moderately Improved (2.01-4.0) | Tripura | Manipur | – |
| most Improved (more than 4.0) | – | – | – |
Table 18: Categorization of Smaller States on incremental performance and overall performance. Source-NITI Aayog-India. Note: The
Table 17: Categorization of Smaller States on incremental performance and overall performance. Source-NITI Aayog-India. Note: The States are categorized on the basis of Reference Year Index score range: Front-runners: top one-third (Index score >62.82), Achievers: middle one-third (Index score between 50.67 and 62.82), Aspirants: lowest one-third (Index score <50.67). The States are categorized into four groups based on incremental performance: ‘Not Improved’ (<=0 incremental changes), ‘Least Improved’ (0.01 to 2.0 points increase), ‘Moderately Improved’ (2.01 to 4.0 points increase), and ‘Most Improved’ (>4 points increase).
Figure E.3: Union Territories: Incremental scores and ranks, with overall performance from base year to reference year and ranks and table E.3.
| Overall Performance | |||
|---|---|---|---|
| Incremental Performance | Aspirants | Achievers | Front-runners |
| not Improved (0 or less) | Andaman and Nicobar | Delhi | – |
| Lakshadweep | |||
| least Improved (0.01–2.0) | – | – | – |
| moderately Improved (2.01–4.0) | – | Pondicherry | – |
| most Improved (more than 4.0) | Daman and Diu | _ | Chandigarh |
| Dadra | |||
| Nagar Haveli |
Table E.3: Categorization of UTs on incremental performance and overall performance. Source-NITI Aayog-India.
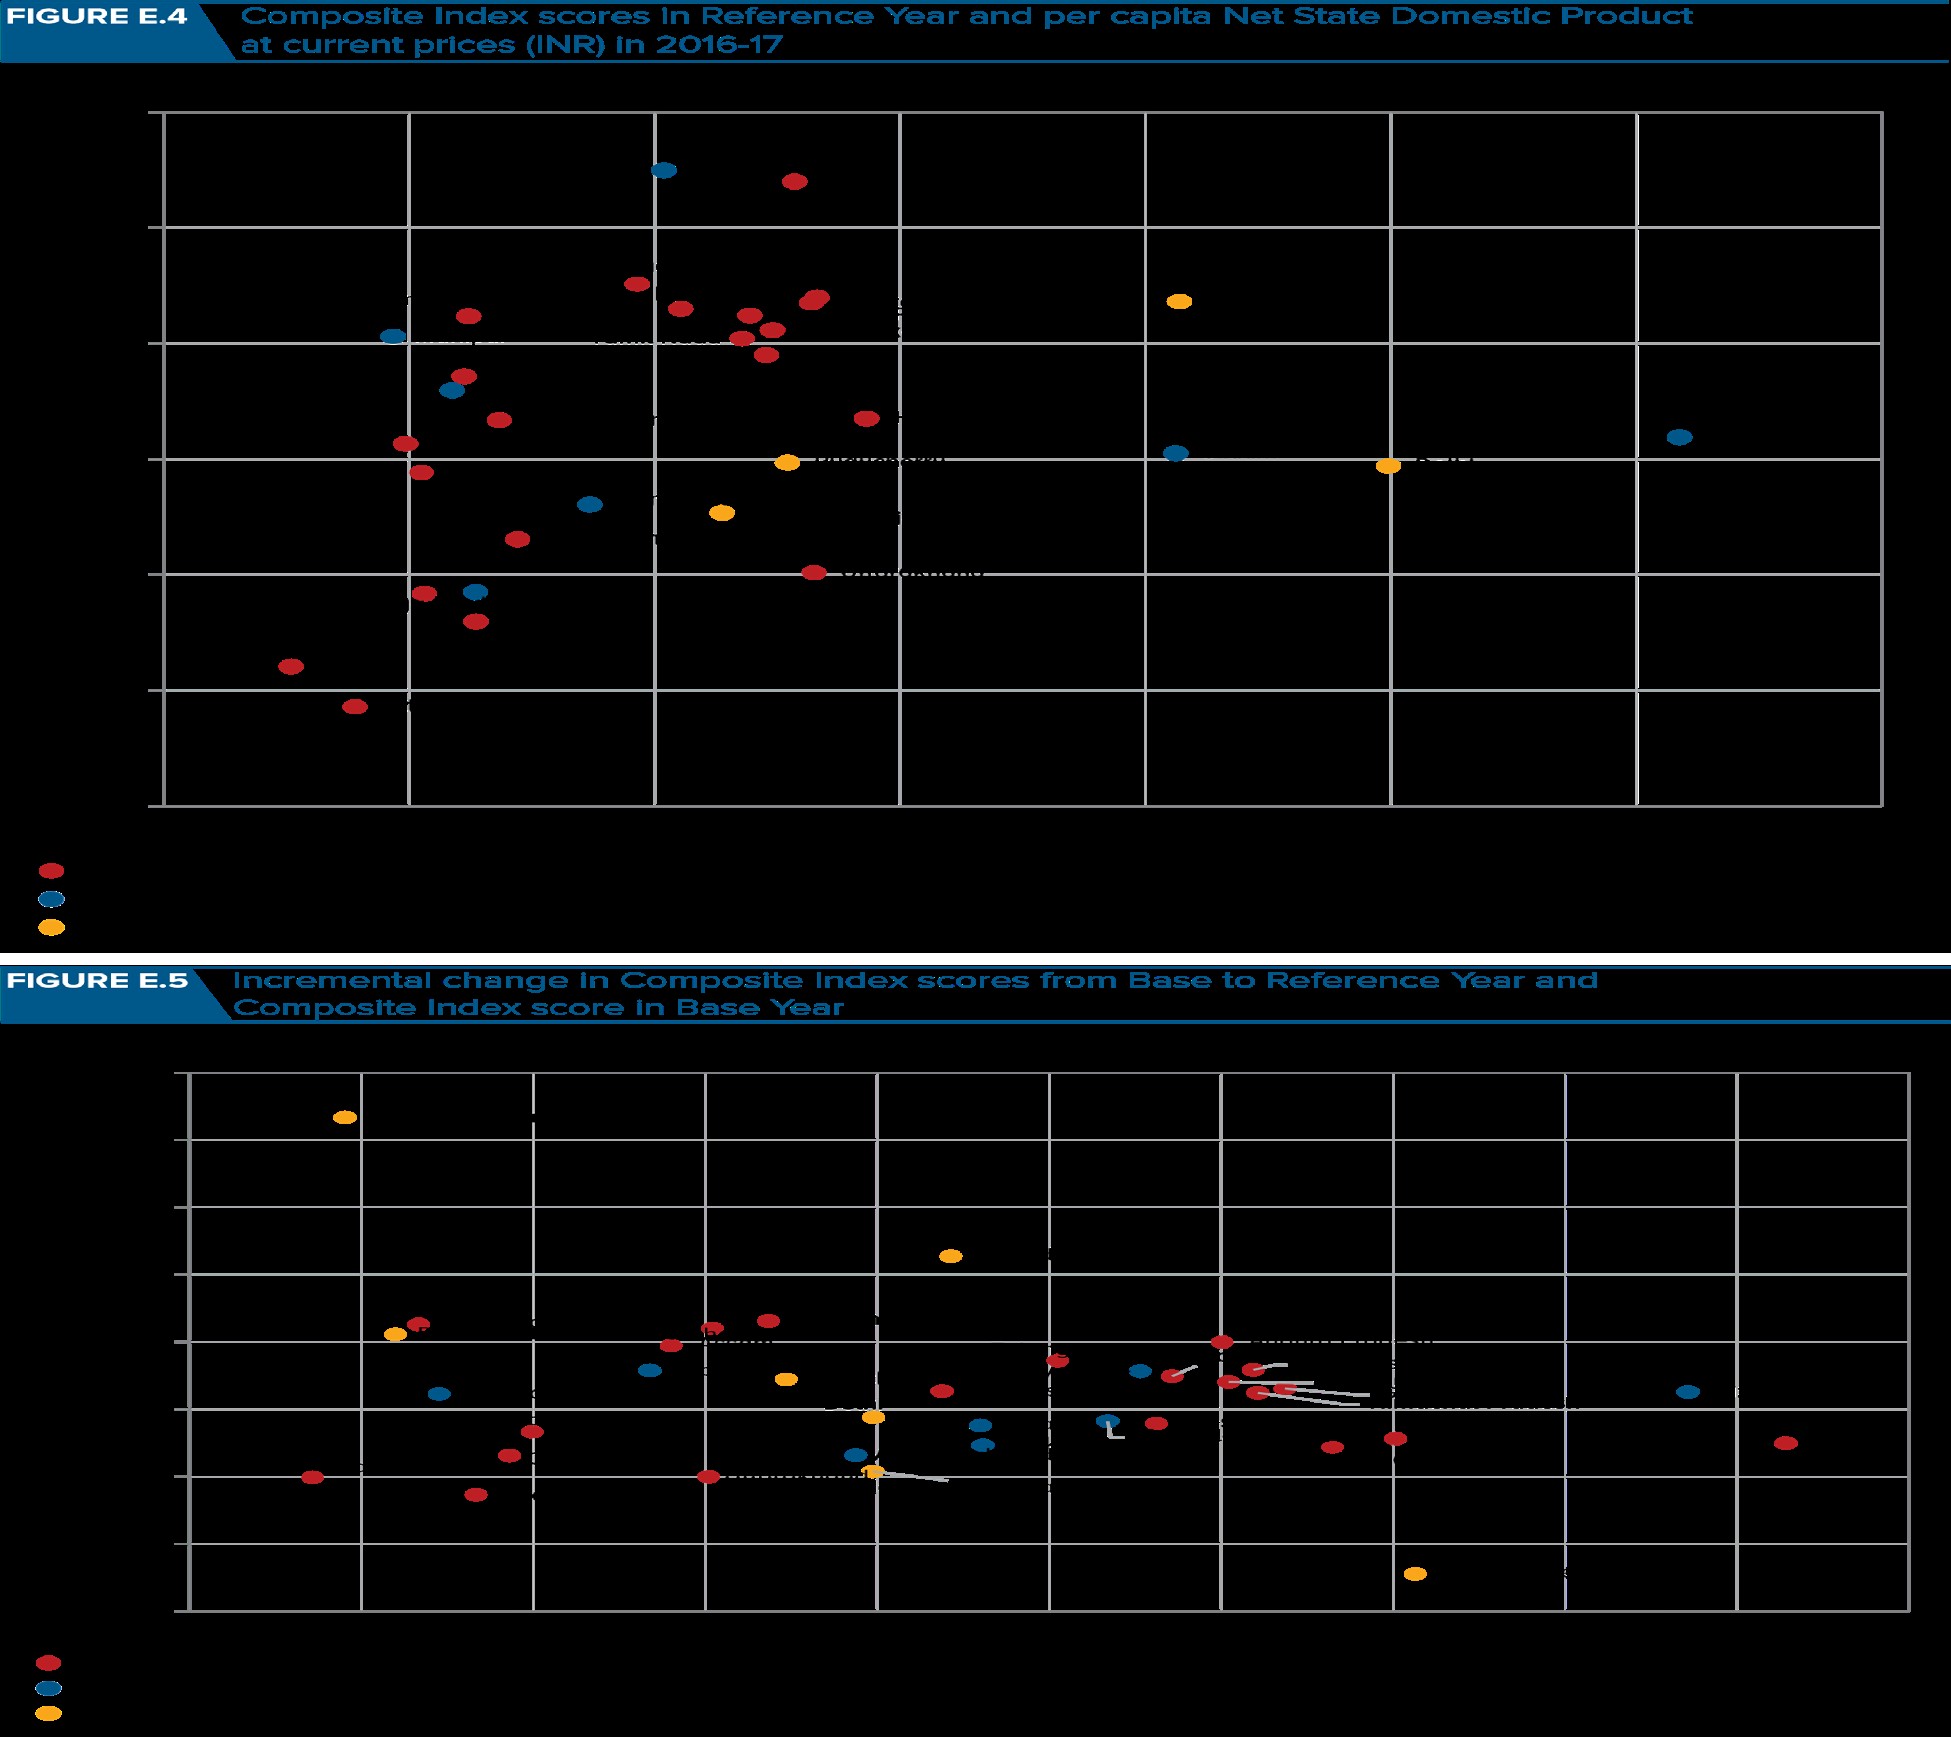
Other Analyses: see figure E.4 and E.5: It was found that the Health Index scores and the economic development levels of States and UTs as measured by per capita Net State Domestic Product (NSDP) are directly related to performance of States / UTs see-Figure E.4., except a few States with low level of economic development performed well in the Health Index, such as Jammu and Kashmir, Manipur, Mizoram, Andhra Pradesh, and Punjab.
Lesson learned
Jammu and Kashmir, Manipur, Mizoram, Andhra Pradesh, and Punjab may provide some insights on how to improve Health Index scores in States with similarly low level of economic development such as Bihar. Exceptions on the other end are States and UTs with high level of economic development but not performing well in Health Index score, e.g. Goa, Delhi and Sikkim.
There is narrowing gap in performance from Base Year to Reference Year among UTs (Figure E.5). There was a convergence in Health Index scores from Base Year to Reference Year across UTs, that is, UTs with higher Health Index scores in the Base Year tended to deteriorate whereas least performing UTs in the Base Year tended to improve their performance in the Reference Year. Among the Larger and Smaller States, there was neither divergence nor convergence in Health Index scores over time [1, 2].
Discussion
Key results
The Health Index revealed large disparities in overall performance across States and UTs. Among the Larger States, the overall Health Index score of the best-performing State is greater than 2.5 times of the least-performing State. Kerala was at top with overall score of 74.01, while Uttar Pradesh was at bottom with overall score of 28.61 (Figure E.1). For the Smaller States, scores varied between least 38.51 in Nagaland and top 74.97 in Mizoram (Figure E.2). Among the UTs, the scores were between 41.66 in Daman and Diu to 63.62 in Chandigarh (Figure E.3). Among the least performing States/ UTs such as Bihar and Uttar Pradesh, there is an urgent need to increase efforts to increase performance.
Kerala and Tamil Nadu have reached the 2030 SDG target for NMR, which are 12 neonatal deaths per 1,000 live births. Tamil Nadu, Maharashtra and Punjab have achieved the SDG target related to Under-Five Mortality Rate (U5MR), which are 25 deaths per 1,000 live births. Among the eight EAG States, only three of the States Rajasthan, Jharkhand and Chhattisgarh showed improvement Among the eight EAG States, only three of the States Rajasthan, Jharkhand and Chhattisgarh showed improvement ,least-performing States (mostly EAG1 States) further deteriorated, leading to a wider performance gap across Larger States (Table 15/16). The top ten performers were Andhra Pradesh, Maharashtra, Gujarat, Himachal Pradesh, Jammu & Kashmir, Karnataka and Telangana. The six least performing States were Uttar Pradesh, Bihar, Odisha, Madhya Pradesh, Uttarakhand, and Rajasthan, five had decline in the overall performance scores, with the exception of Rajasthan which improved the score by
6.30 points.
Note: 1. EAG States - Empowered Action Group States includes Bihar, Chhattisgarh, Jharkhand, Madhya Pradesh, Rajasthan, Uttarakhand, Uttar Pradesh, and Odisha.
In Bihar, the deterioration was primarily due to the performance related to total fertility rate, low birth weight, Sex Ratio at Birth, TB treatment success rate, quality accreditation of public health facilities, and time-taken for NHM fund transfer, while in the case of Uttar Pradesh the performance related to low birth weight, TB treatment success rate, average tenure of key positions at state and district level and level of birth registration accounted for the deterioration. Kerala maintained its ranking as the top performing Larger State.
Smaller States- Mizoram ranked first while Tripura and Manipur were top two States in terms of incremental performance (Figure E.2 and Table 17). Sikkim and Arunachal Pradesh had bigger decrease in overall Health Index scores due to poor performance of several indicators such as institutional deliveries, TB case notification rate, TB treatment success rate, 1st trimester ANCs, level of birth registration, and IDSP reporting of L-form.
UTs- Chandigarh ranked first in while Dadra and Nagar Haveli improved the most (Figure E.3 and Table E.3)., ranked second in terms of overall performance ranking. Decline in the overall Health Index scores of Lakshadweep and Andaman & Nicobar Islands is due to deterioration of health outcome indicators, 3 indicators deteriorated in Lakshadweep (low birth weight, full immunization, institutional delivery), and 4 indicators in Andaman & Nicobar (full immunization, institutional deliveries, TB case notification, and TB treatment success rate).
The indicators/variables where most States and UTs need to focus:
- Vacancies in key staff,
- Establishment of functional district Cardiac Care Units (CCUs),
- Quality accreditation of public health facilities, and
- Institutionalization of Human Resources Management Information System (HRMIS),
- Larger States need to focus on improving the Sex Ratio at Birth (SRB).
Limitations
For proper comparisons there is need for making outcome data available for smaller states, updated outcomes for non-communicable diseases and financial protection, robust programmatic data for continuous monitoring were important issues, could not be addressed optimally. There are huge disparities across States and Union Territories (UTs). The health outcomes of some States are comparable to that of some upper middle-income countries and high income countries (for example, Neonatal Mortality Rate (NMR) in Kerala is similar to that of Brazil or Argentina), while some other States have health outcomes similar to that in the poorest countries in the world (for example, NMR in Odessa is close to that of Sierra Leone).
Limitations of the Index
- Infectious diseases, non-communicable diseases (NCDs), mental health, governance, and financial risk protection could not be fully captured in the Index due to non- availability of acceptable quality data on an annual basis.
- For several indicators, the data are limited to public facilities due to the paucity and uneven availability of private sector data on health services in the HMIS.
- For several key outcome indicators, data were available only for Larger States.
- Non-availability of acceptable quality of data on an annual basis.
- Assignment of highest weight to health outcomes is biased and not appropriate. Everyone knows that it is totally dependent on input and governance and these two are given low weight is amazing. Actually these two should be given more weight, it is evident from states like Bihar that there are failure/ignorance/ corruption /scams in these areas then how the state will improve without input and transparent good governance [5]. This may be an attempt to put everything on doctors and health staff and at the same time protect policy makers and administration from getting exposed.
Interpretation
The Health Index score ranking is an annual systematic tool for measurement of performance across States and UTs of health parameters. The results provide an important insight into the areas in which States have improved, stagnated or declined which will help in better targeting of interventions.
Conclusion
The Health Index is a useful tool to measure and compare the overall performance and incremental performance across States and UTs over time. The Health Index is an important instrument in understanding the variations and complexity of the nation’s performance in health. This exercise triggered many useful discussions, including how best to measure health performance, how to strengthen the data collection system, how to identify barriers and motivate actions using data, and how to promote positive competition and learning among the States and UTs. The report in the second round highlights the areas each State/UT should focus on to facilitate improvement in overall health outcomes.
Generalizability
The States and UTs rank differently on performance, States and UTs at lower levels of the Health Index (lower levels of development of their health systems) are at an advantage in notching up incremental progress over States with high Health Index score. For example, Kerala ranks on top in terms of overall performance and at the bottom in terms of incremental progress mainly as it had already achieved a low level of Neonatal Mortality Rate (NMR) and Under-five Mortality Rate (U5MR) and replacement level fertility, leaving limited space for any further improvements.
References
-
The World Bank- https://issuu.com/worldbankindia/ docs/health_states_progressive_india
-
Niti Aayog - https://www.niti.gov.in/
-
Kumar P, Anupama (2022) Analysis of NITI AAYOG (National Institution for Transforming India) Health Index Report on the Ranking of States and Union Territories: A Cross Sectional Observational Research Study Round 1 (2014 – 2016)-V1. Research Square.
-
Kumar D (2022) Analysis of NITI AAYOG (National Institution for Transforming India) Health Index Report on the Ranking of States and Union Territories: A Cross Sectional Observational Research Study Round 1 (2014 – 2016)-V1.
-
Kumar D (2022) Establishment of Public Health Management Cadre in India and guidelines for implementation-2022.
- Intersecting Epidemics and Climate Vulnerabilities in Conflict- Driven Displacement: Epidemiology, Systemic Challenges, and One Health Gaps in South Sudan
- Advancing Domestic Health Financing for Community Health System Sustainability in South Sudan: The Boma Health Initiative Model (2025–2035)
- Prevalence and Correlates of Post-Exposure Prophylaxis Uptake among Men Who Have Sex with Men in Kisumu County, Kenya
- Medical, Ethical, and Legal Conflicts Surrounding Euthanasia in Argentina. Its Global Implications
- Knowledge and Attitude on Menstrual Hygiene among Adolescent Girls Studying in Secondary Level in Public Schools of Chitwan District, Nepal
- Biological Efficacy of an Adulticide Mixture (clothianidin + deltamethrin) as an Indoor Residual Spray against Adult Anopheles flavirostris in Palawan, the Philippines