Impact of Alcoholism and Other Factors on Violence against Women in the State of Bihar, India - Data from NFHS (National Family Health Survey -5-2019-21)
National Family Health Survey-5 data which was conducted at household level in all 38 districts of the state of Bihar from 9 July, 2019 to 2 February, 2020 revealed that there is failure of complete alcohol ban in Bihar. Violence against women under the influence of alcoholism is still going on under influence of liquor consumption. Alcohol is a risk factor for partner violence across a range of settings for all types of violence where alcohol plays as a key situational factor, escalating the probability of violence by plummeting inhibitions, clouding judgment and deteriorating ability to interpret cues. Psychiatric morbidities such as paranoid schizophrenia, bipolar disorder, delusional and antisocial personality disorder formulate the man more likely to commit sexual crimes. In the light of the above mentioned background this study based on data of NFHS-5 is aimed to analyses the status of liquor consumption relation with violence against women in the state of Bihar and Gender role attitudes, experience of physical and sexual violence, experience of violence during pregnancy, forms of spousal violence, injuries to women due to spousal violence and help seeking against violence by the women of the state of Bihar in India. The total sample size of NFHS-5 was 35,834 households, 42,483 women of age group 15-49 (including 6,350 women interviewed in PSUs in the state module), and 4,897 men of age group 15-54 for the state of Bihar. Household questionnaire regarding Gender role attitudes, Experience of physical and sexual violence, Experience of violence during pregnancy, Forms of spousal violence, Injuries to women due to spousal violence, Help seeking against violence in the household three years preceding the survey were asked from respondents and the information was gathered and utilized to construct information in 19 languages using CAPI (Computer Assisted Personal Interviewing). In residents of Bihar eligible women and men were women ages 15-49 and men ages 15-54 who lived in the household the night before the household interview (including both usual residents and visitors). See table-1- This table is based on the unweight sample. 84.4% of women whose husbands often get drunk have experienced emotional, physical, or sexual violence, compared to those who gets drunk sometimes (61.4%), drinks/never gets drunk (45.4%) and minimum 36.4% of those whose husbands do not drink -see table-8 and figure-4. The survey data analysis revealed that the drinking pattern plays a crucial role in the extent of violence against women in the state. The more the men consume liquor, the more is the domestic abuse. Nearly, 56.6% of women are afraid of their husband most of the time that have experienced spousal violence.
Introduction
Alcohol consumption, sale and distribution is totally banned in the state of Bihar, India, since 01-04-2016 vide the official Gazette Notification Number 3893 dated 21.12.2015 [1]. Through this notification Government of Bihar, in order to reduce the hazard of alcoholism and vices related to it introduced new Excise Policy within the State of Bihar for prohibition of alcohol within the State of Bihar from 01.04.2016. In order to achieve the objectives of Prohibition, The Bihar Excise Act, 1915 was amended and amendment Act, 2016 was enforced from 01.04.2016. Vide official Gazette Notification No. 1485 dated 05.04.2016. Complete Prohibition of sale and consumption of liquor was declared within the State of Bihar. Bihar Prohibition and Excise Act, 2016 was notified on 2nd of October 2016 to put into effect complete ban of alcohol consumption/sale in the territory of Bihar [1]. National Family Health Survey -5 which was carried out at household point in all 38 districts of the state of Bihar from 9 July, 2019 to 2 February, 2020 revealed that there is partial failure of alcohol ban in Bihar evident from survey report of violence against women under the influence of alcoholism happening in the state of Bihar in India [2]. Due to criticism of unplanned liquor ban, the government introduced the Bihar Liquor Prohibition Bill 2022 in the state Assembly for the new amendment, as a huge number of people were in jails for liquor related crimes, majority of which belong to economically weaker sections [3]. Chief Justice of India (CJI) said that people are waiting in India for justice for a long time and cases of liquor violations increased burden on courts [4]. Several people had died due to consumption of poisonous liquor as well as a great number of people employed in alcohol industry became jobless as well as the smuggling and illegal trafficking increased in the state of Bihar as few major side effects of alcohol ban due to unplanned enforcement of act without studying such act enforcement in other states [5, 6]. Some research study show a positive and noteworthy effect of unemployment (a problem in poor states like Bihar) on drinking behaviours and the findings are strong to numerous sensitivity tests [5]. Even the policemen who have the duty to put into operation the ban have been arrested for violation of the liquor ban [7]. In Bihar the plan to implement such law must have taken advice from health department which is having a bad image of failure in NITI Aayog report [8, 9]. Consumption of alcohol causes to 3 million deaths per annum worldwide with disabilities and ill health of millions due to harmful use of alcohol which is responsible for 5.1% of the global burden of disease. Gender wise harmful use of alcohol is more in males about 7.1% compared to 2.2% in females respectively [10]. Alcohol is one of the leading risk factor contributing to premature mortality as well as disability in 15 to 49 years age group, claiming for 10 percent of total deaths in this age group. Underprivileged and especially susceptible populations have higher rates of alcohol- associated death and hospitalization [10]. Regular intake of alcohol by the husband has been effectively associated with deprived mental health of women [11]. Alcohol is a risk factor for partner violence across a range of settings for all types of violence where alcohol plays as a key situational factor, escalating the probability of violence by plummeting inhibitions, clouding judgment and deteriorating ability to interpret cues. Psychiatric morbidities such as delusional and antisocial personality disorder, paranoid schizophrenia, bipolar disorder, formulate the man more likely to commit sexual crimes [11]. There is forensic evidence from cases (Bobbit, Manu Sharma, Nirbhaya etc.,) that liquor was the widespread factor in numerous types of violence against women. The researchers had previously done related research on impact of COVID-19 on violence against women in India which is available as preprint and publications [12, 13, 14, 15, 16, 17]. This research study with data from NFHS-5 field survey will help policy maker to understand the impact of a range of factors linked with violence against women, for potential policy making to control and eradicate violence against women. There is urgent need to stop the ongoing violence against women in Bihar aggravated by socio-economic and other factors as well as pandemic situations erupting from COVID-19 induced situations.
Objectives
In the light of the above mentioned background this study based on survey data of NFHS-5 is aimed to analyses the status of liquor consumption relation with violence against women in the state of Bihar and Gender role attitudes, experience of physical and sexual violence, experience of violence during pregnancy, forms of spousal violence, injuries to women due to spousal violence and help seeking against violence by the women of the state of Bihar in India. Objective of this research study is to find out impact of alcoholism and other factors contributing for violence against women in the household of the state of Bihar, based on data of NFHS-5.
Methods
Study Design
The total sample size of NFHS-5 was 35,834 households, 42,483 women of age group 15-49 (including 6,350 women interviewed in PSUs in the state module), and 4,897 men of age group 15-54 for the state of Bihar – see Table-1. The sample size was based on the size obligatory to produce trustworthy indicator estimates for each district. The rural sample was a two-stage sampling design, keeping villages as the Primary Sampling Units (PSUs) in the primary stage (selected with probability proportional to size), followed by random selection of twenty-two (22) households in each PSU at the subsequent stage. In the town areas of survey two-stage sampling was done with Census Enumeration Blocks (CEB) assortment during first stage while random selection of twenty-two (22) households in each CEB during succeeding stage. The second phase sampling selection of households in both areas, were done after performing an inclusive mapping and inventory operation for household in the particular samples of first-stage units. This study was a cross-sectional large-scale, several round survey done in an illustrative sample of households in all 38 districts of the state of Bihar from 9 July, 2019 to 2 February, 2020.
Setting
Household questionnaire regarding Gender role attitudes, Experience of physical and sexual violence, Experience of violence during pregnancy, Forms of spousal violence, Injuries to women due to spousal violence, Help seeking against violence in the household three years preceding the survey were asked from respondents and the information was gathered and utilized to construct information in 19 languages using CAPI (Computer Assisted Personal Interviewing). The fieldwork was conducted in all 38 districts of the state of Bihar starting from 9 July, 2019 to 2 February, 2020. Data were collected from selected 35,834 households, 42,483 women of age 15-49 (including 6,350 women interviewed in PSUs in the state module), and 4,897 men of age 15-54.
| Result | Urban | Rural | Total |
|---|---|---|---|
| Household interviews | |||
| Households selected | 3,986 | 33,676 | 37,662 |
| Households occupied | 3,916 | 33,011 | 36,927 |
| Households interviewed | 3,789 | 32,045 | 35,834 |
| Household response rate1 | 96.8 | 97.1 | 97 |
| Interviews with women age 15-49 | |||
| Number of eligible women | 4,799 | 39,178 | 43,977 |
| Number of eligible women interviewed | 4,601 | 37,882 | 42,483 |
| Women response rate2 | 95.9 | 96.7 | 96.6 |
| Interviews with men age 15-54 | |||
| Number of eligible men | 807 | 4,581 | 5,388 |
| Number of eligible men interviewed | 734 | 4,163 | 4,897 |
| Men response rate2 | 91 | 90.9 | 90.9 |
Table 1: Number of households, number of interviews with women and men, and response rates, according to residence, Bihar, 2019-2
Table 1: Number of households, number of interviews with women and men, and response rates, according to residence, Bihar, 2019-21 Note: Eligible women and men are women age 15-49 and men age 15-54 who stayed in the household the night before the household interview (including both usual residents and visitors). This table is based on the unweight sample. 1Households interviewed/households occupied 2Respondents interviewed/eligible respondents
Participants
Participants were from 38 districts of the state of Bihar from selected 35,834 households, which includes 42,483 women of age group 15-49 (including 6,350 women interviewed in PSUs in the state module), and 4,897 men of age group 15-54. The selection basis of participants is as per population distribution in rural and urban areas and stay at house between men and women and age selection is as per understanding questionnaire and reproductively active age.
Eligibility Criteria
In residents of Bihar eligible women and men were women ages 15-49 and men ages 15-54 who lived in the household the night before the household interview (including both usual residents and visitors). See table-1- This table is based on the unweight sample. 1Households interviewed/ households occupied 2Respondents interviewed/eligible respondents.
Descriptive Data and Variables
The descriptive data and variables are listed in tables-
2,3,4,5,6,7,8,9,10
| Reason/behavior | Ever-married | Never married | Total | |||
|---|---|---|---|---|---|---|
| Women | Men | Women | Men | Women | Men | |
| Percentage who agree that a husband is justified in hitting or beating his wife if: | ||||||
| She goes out without telling him | 17.3 | 11.8 | 15.9 | 14.2 | 16.9 | 12.8 |
| She neglects the house or children | 19.1 | 12.3 | 19.7 | 13.5 | 19.3 | 12.8 |
| She argues with him | 21.4 | 16.9 | 20.8 | 18.7 | 21.3 | 17.6 |
| She refuses to have sexual intercourse with him | 10.4 | 7.7 | 10 | 9.3 | 10.3 | 8.4 |
| She doesn’t cook properly | 14.7 | 10.1 | 15.7 | 10.6 | 14.9 | 10.3 |
| He suspects her of being unfaithful | 16.8 | 16 | 16.6 | 17.2 | 16.7 | 16.5 |
| She shows disrespect for in-laws | 23.7 | 20.8 | 22.1 | 24.1 | 23.3 | 22.2 |
| Percentage who agree with at least one specified reason | 37.5 | 33.1 | 36.4 | 35 | 37.3 | 33.9 |
| Percentage who agree that a wife is justified in refusing to have sex with her husband when she: | ||||||
| Knows her husband has a sexually transmitted disease | 89.6 | 85.4 | 80 | 85.4 | 87.3 | 85.4 |
| Knows her husband has sex with other women | 90.1 | 77.3 | 81.6 | 76.7 | 88.1 | 77 |
| Is tired or not in the mood | 88.5 | 76.7 | 78.6 | 76.8 | 86.1 | 76.8 |
| Percentage who agree with all three reasons | 82.3 | 65.3 | 71.5 | 66.7 | 79.7 | 65.8 |
| Percentage who agree with none of the three reasons | 5.2 | 8 | 13.3 | 9.2 | 7.2 | 8.5 |
| Percentage who agree that when a wife refuses to have sex with her husband, he has the right to: | ||||||
| Get angry and reprimand her | na | 15.8 | na | 14 | na | 15 |
| Refuse to give her financial support | na | 10.1 | na | 9.6 | na | 9.9 |
| Use force to have sex even if she doesn’t want to | na | 9.2 | na | 9.4 | na | 9.3 |
| Have sex with another woman | na | 8.1 | na | 8.2 | na | 8.1 |
| Percentage who agree with all four behaviors’ | na | 4.2 | na | 3.9 | na | 4.1 |
| Percentage who agree with none of the four behaviors’ | na | 78.2 | na | 78.6 | na | 78.4 |
| Number of respondents | 4,871 | 2,662 | 1,515 | 1,882 | 6,386 | 4,545 |
| na = Not applicable |
Table 2: Gender role attitudes- Percentage of women and men age 15-49 with specific attitudes toward wife beating and refusal by
| Percentage who agree that a husband is justified in hitting or beating his | Percentage who agree that a wife is justified in refusing to have sex with her husband for all specified reasons2 | Percentage who agree that when a wife refuses to have sex with her husband, he does not have the right to any of the four specified behaviours3 | Number | ||||
|---|---|---|---|---|---|---|---|
| Background characteristic | wife | Men | Women | Men | Men | Women | Men |
| Age | |||||||
| 15-19 | 37.9 | 36.9 | 70.5 | 65 | 75.2 | 1505 | 1130 |
| 20-24 | 35.2 | 33.2 | 83.4 | 66.7 | 76 | 1157 | 783 |
| 25-29 | 38.4 | 37 | 82.1 | 67.6 | 75 | 1012 | 627 |
| 30-39 | 39.2 | 31.3 | 81.8 | 66.5 | 80.7 | 1524 | 1101 |
| 40-49 | 35 | 31.7 | 83.1 | 64.2 | 75.7 | 1188 | 903 |
| Residence | |||||||
| Urban | 34.4 | 31 | 82.9 | 70.4 | 72.6 | 1072 | 973 |
| Rural | 37.8 | 34.7 | 79.1 | 64.6 | 77.9 | 5314 | 3572 |
| Schooling | |||||||
| No schooling | 40.5 | 37.9 | 78.4 | 63.4 | 76.9 | 2466 | 827 |
| <5 years complete | 42.7 | 48.8 | 82.5 | 53.3 | 65.2 | 332 | 325 |
| 5-7 years complete | 43.1 | 35.3 | 80.4 | 65.5 | 73.9 | 700 | 587 |
| 8-9 years complete | 35.6 | 37.6 | 76.3 | 64.8 | 75.8 | 1067 | 861 |
| 10-11 years complete | 36.7 | 34.5 | 79.6 | 66.2 | 76.9 | 788 | 695 |
| 12 or more years complete | 26 | 23.8 | 85 | 71.4 | 81.6 | 1033 | 1250 |
| Employment (past 12 months) | |||||||
| Employed | 38.2 | 34.9 | 80.9 | 65.4 | 76.5 | 1119 | 3404 |
| Employed, for cash | 41.5 | 34.7 | 80.5 | 65.5 | 77.2 | 805 | 3136 |
| Employed, not for cash | 29.8 | 37.1 | 82 | 63.6 | 68.8 | 314 | 268 |
| Not employed | 37.1 | 30.8 | 79.5 | 67.3 | 77.4 | 5267 | 1141 |
| Marital status | |||||||
| Never married | 36.4 | 71.5 | 1515 | 1882 | |||
| 35 | 66.7 | 75.5 | |||||
| Currently married | 37.6 | 33.1 | 82.5 | 65.4 | 77.5 | 4724 | 2606 |
| Widowed/divorced/ separated/ deserted | 36.5 | -32.2 | 75 | -60.7 | -83.3 | 147 | 56 |
| Number of living children | |||||||
| 0 | 34.9 | 34.6 | 74 | 67 | 75.4 | 2016 | 2235 |
| 44563 | 36.9 | 33.3 | 82.7 | 66.9 | 77.5 | 1749 | 914 |
| 44624 | 38.5 | 31.9 | 82.4 | 64.2 | 79.4 | 1920 | 1058 |
| 5 or more | 41.5 | 36.3 | 81.3 | 60.7 | 75 | 701 | 338 |
| Household structure4 | |||||||
| Nuclear | 38.5 | 36.3 | 77.8 | 65 | 75.2 | 3059 | 2179 |
| Non-nuclear | 36.2 | 31.6 | 81.5 | 66.6 | 78.2 | 3327 | 2366 |
| Religion | |||||||
| Hindu | 36.3 | 33 | 80.5 | 66 | 77.2 | 5232 | 3796 |
| Muslim | 41.3 | 38.2 | 76.6 | 65 | 74.5 | 1141 | 742 |
| Caste/tribe | |||||||
| Scheduled caste | 40.4 | 35 | 78.4 | 62.5 | 77.4 | 1543 | 1045 |
| Scheduled tribe | 34.6 | 35.2 | 68.1 | 72.6 | 81.4 | 170 | 155 |
| Other backward class | 36.8 | 34.7 | 80.2 | 65.5 | 75.5 | 3507 | 2516 |
| Other | 34.4 | 29.5 | 82.3 | 69.7 | 79.2 | 1120 | 817 |
| Don’t know | -52.7 | * | -65.9 | * | * | 46 | 12 |
| Total | 37.3 | 33.9 | 79.7 | 65.8 | 76.7 | 6386 | 4545 |
Table 3: Gender role attitudes- by background characteristics Percentage of women and men age 15-49 who agree that a husband is w
Table 3: Gender role attitudes- by background characteristics Percentage of women and men age 15-49 who agree that a husband is warranted in hitting or beating his wife for at least one specified reason, who agree that a wife is justified in refusing to have sex with her husband for all specified reasons, and percentage of men who agree that when a wife refuses to have sex with her husband, the husband does not have the right to any of the four specified behaviors, by background characteristics, Bihar, 2019-21 Note: Figures in parentheses are based on 25-49 unweight cases. An asterisk indicates that a figure is based on fewer than 25 unweight cases and has been suppressed. Total includes women and men belonging to Christian or other religions, who are not shown separately. 1Specified reasons are: she goes out without telling him, she neglects the house or children, she argues with him, she refuses to have sexual intercourse with him, she doesn’t cook properly, he suspects she is unfaithful, and she shows disrespect for in-laws. 2 Specified reasons are: knows husband has a sexually transmitted disease, knows husband has sex with other women, and is tired or not in the mood. 3Specified behaviors are: gets angry and reprimands her, refuses to give her financial support, uses force to have sex, and has sex with another woman. 4Nuclear households are households comprised of a married couple or a man or a woman living alone or with unmarried children (biological, adopted, or fostered) with or without unrelated individuals. The remaining households are non-nuclear households.
| Type of violence/perpetrator | Ever-married | Never married | Total |
|---|---|---|---|
| Type of violence experienced | |||
| Physical violence only | 33.7 | 16.2 | 31.9 |
| Sexual violence only | 0.9 | 2.2 | 1 |
| Physical and sexual violence | 7.4 | 0.7 | 6.7 |
| Physical or sexual violence | 42 | 19.1 | 39.6 |
| Number of women | 3,598 | 415 | 4,013 |
| Person committing physical violence1 | |||
| Current husband | 95.1 | na | 90.8 |
| Former husband | 0.2 | na | 0.2 |
| Father/step-father | 4.1 | 16.1 | 4.6 |
| Mother/step-mother | 8.9 | 63.7 | 11.4 |
| Sister/brother | 5.1 | 23.3 | 5.9 |
| Daughter/son | 0.3 | 0 | 0.3 |
| Other relative | 0.9 | 6.9 | 1.2 |
| Current boyfriend | 0.1 | 0 | 0.1 |
| Former boyfriend | 0 | 0 | 0 |
| Mother in-law | 1.2 | na | 1.1 |
| Father in-law | 0.5 | na | 0.5 |
| Other in-law | 0.1 | na | 0.1 |
| Teacher | 0.7 | 5.6 | 0.9 |
| Employer/someone at work | 0 | 0 | 0 |
| Other | 0.3 | 2.8 | 0.4 |
| Number who experienced physical violence since age 15 | 1,478 | 70 | 1,548 |
| Person committing sexual violence the first time | |||
| Current husband | 98.1 | na | 94.3 |
| Former husband | 1 | na | 1 |
| Father/step-father | 0.2 | * | 0.2 |
| Brother/step-brother | 0 | * | 0.7 |
| Other relative | 0.4 | * | 1.8 |
| Own friend/acquaintance | 0 | * | 0.4 |
| Family friend | 0.3 | * | 0.3 |
| Teacher | 0 | * | 0.6 |
| Other | 0 | * | 0.7 |
| Number who experienced sexual violence | 299 | 12 | 311 |
Table 4: Experience of physical and sexual violence- Percentage of women age 18-49 who have ever experienced physical or sexual v
Table 4: Experience of physical and sexual violence- Percentage of women age 18-49 who have ever experienced physical or sexual violence; among those who have experienced physical violence, the person committing the violence; and among those who have experienced sexual violence, the person committing the violence the first time, by marital status, Bihar, 2019-21 Note: All women were asked about their experience of physical violence since age 15. Ever-married women were also asked about their experience of spousal physical violence at any age. An asterisk indicates that a figure is based on fewer than 25 unweight cases and has been suppressed. Na = Not applicable 1 Women can report more than one person who committed the violence.
| Background characteristic | Percentage who experienced violence during pregnancy | Number of women who have ever been pregnant |
|---|---|---|
| Age | ||
| 18-19 | 2.4 | 95 |
| 20-24 | 2 | 529 |
| 25-29 | 4 | 660 |
| 30-39 | 2.7 | 1,147 |
| 40-49 | 2.5 | 972 |
| Residence | ||
| Urban | 1.9 | 526 |
| Rural | 3 | 2,877 |
| Marital status | ||
| Currently married | 2.7 | 3,296 |
| Widowed/divorced/ separated/deserted | 5.2 | 105 |
| Number of living children | ||
| 0 | 1.1 | 141 |
| 2-Jan | 2.6 | 1,161 |
| 4-Mar | 3.1 | 1,487 |
| 5 or more | 2.7 | 614 |
| Schooling | ||
| No schooling | 3.3 | 1,734 |
| <5 years complete | 3.3 | 206 |
| 5-7 years complete | 1.3 | 372 |
| 8-9 years complete | 2.5 | 399 |
| 10-11 years complete | 4 | 273 |
| 12 or more years complete | 1.1 | 419 |
| Religion | ||
| Hindu | 2.8 | 2,843 |
| Muslim | 2.7 | 556 |
| Caste/tribe | ||
| Scheduled caste | 3.1 | 853 |
| Scheduled tribe | 2.8 | 85 |
| Other backward class | 2.6 | 1,867 |
| Other | 2.6 | 575 |
| Total | 2.8 | 3,403 |
Table 5: Experience of violence during pregnancy- Among women age 18-49 who have ever been pregnant, percentage who have ever exp
Table 5: Experience of violence during pregnancy- Among women age 18-49 who have ever been pregnant, percentage who have ever experienced physical violence during pregnancy, by background characteristics, Bihar, 2019-21 Note: Total includes never married women, women belonging to Christian or other religions, and women who don’t know their caste/tribe, who are not shown separately.
| In the past 12 months | ||||
|---|---|---|---|---|
| Type of violence | Ever1 | Often | Sometimes | Often or sometimes |
| Physical violence | ||||
| Any form of physical violence | 39.1 | 4.6 | 29 | 33.6 |
| Pushed her, shook her, or threw something at her | 15.1 | 2 | 11.1 | 13 |
| Twisted her arm or pulled her hair | 14.8 | 2 | 10.8 | 12.9 |
| Slapped her | 36.3 | 3.4 | 27.1 | 30.4 |
| Punched her with his fist or with something that could hurt her | 12.5 | 1.7 | 8.9 | 10.7 |
| Kicked her, dragged her, or beat her up | 9.3 | 1.7 | 6.3 | 8.1 |
| Tried to choke her or burn her on purpose | 2.8 | 0.7 | 1.9 | 2.6 |
| Threatened her or attacked her with a knife, gun, or any other weapon | 1.1 | 0.5 | 0.5 | 1 |
| Sexual violence | ||||
| Any form of sexual violence | 7.9 | 1.4 | 5.7 | 7.1 |
| Physically forced her to have sexual intercourse with him even when she did not want to | 5.5 | 0.8 | 4 | 4.8 |
| Physically forced her to perform any sexual acts she did not want to | 3.1 | 0.6 | 2.3 | 2.9 |
| Forced her with threats or in any other way to perform sexual acts she did not want to | 4.3 | 1 | 2.9 | 3.9 |
| Emotional violence | ||||
| Any form of emotional violence | 16.8 | 3.4 | 11.5 | 14.9 |
| Said or did something to humiliate her in front of others | 11.9 | 2.3 | 8 | 10.3 |
| Threatened to hurt or harm her or someone close to her | 8.1 | 2 | 5.1 | 7.1 |
| Insulted her or made her feel bad about herself | 9 | 1.7 | 6.3 | 8 |
| Any form of physical and/or sexual violence | 40 | 5.1 | 29.7 | 34.8 |
| Any form of physical and sexual violence | 7 | 0.9 | 5 | 5.9 |
| Any form of physical and/or sexual and/or emotional violence | 42.4 | 6.6 | 30.7 | 37.3 |
| Any form of physical and sexual and emotional violence | 4.3 | 0.7 | 2.7 | 3.4 |
| Any violence by women against their husband2 | 3.6 | 0.5 | 2.7 | 3.3 |
| Number of ever-married women | 3,598 | 3,598 | 3,598 | 3,598 |
Table 6: Forms of spousal violence-Percentage of ever-married women age 18-49 who have experienced various forms of violence comm
Table 6: Forms of spousal violence-Percentage of ever-married women age 18-49 who have experienced various forms of violence committed by their husband ever and in the 12 months preceding the survey, Bihar, 2019-21 Note: Husband refers to the current husband for currently married women and the most recent husband for widowed, divorced, separated, or deserted women. 1 Includes in the past 12 months 2Any violence by women against their husband when he was not already beating or physically hurting her.
| Background characteristic | Emotional violence | Physical violence | Sexual violence | Physical or sexual violence | Emotional, physical, or sexual violence | Number of women |
|---|---|---|---|---|---|---|
| Age | ||||||
| 18-19 | 9.4 | 24 | 9.2 | 25.4 | 27.5 | 156 |
| 20-24 | 13.2 | 31.4 | 5.6 | 32 | 34.7 | 607 |
| 25-29 | 19.4 | 39.9 | 9.4 | 40.4 | 43 | 671 |
| 30-39 | 17.9 | 43.9 | 9.3 | 45.4 | 47.3 | 1,176 |
| 40-49 | 17.2 | 39.9 | 6.2 | 40.4 | 43.1 | 990 |
| Residence | ||||||
| Urban | 12.2 | 39.5 | 6.7 | 40.6 | 42.4 | 555 |
| Rural | 17.7 | 39 | 8.1 | 39.9 | 42.3 | 3,043 |
| Schooling | ||||||
| No schooling | 19.3 | 43.1 | 8.7 | 44.1 | 46.5 | 1,786 |
| <5 years complete | 18.1 | 39.1 | 10.1 | 40.8 | 45 | 211 |
| 5-7 years complete | 11.3 | 38.1 | 4.3 | 38.2 | 40.4 | 395 |
| 8-9 years complete | 14.7 | 38.8 | 11 | 39.7 | 41.5 | 435 |
| 10-11 years complete | 14.4 | 37 | 7.3 | 37 | 38.6 | 296 |
| 12 or more years complete | 14.8 | 26.5 | 4.3 | 27.8 | 30.3 | 475 |
| Employment (past 12 months) | ||||||
| Not employed | 14.7 | 36.1 | 7.4 | 37 | 39.3 | 2,832 |
| Employed for cash | 25.1 | 46.4 | 10 | 46.9 | 50.1 | 542 |
| Employed not for cash | 23.9 | 59.8 | 8.9 | 60.8 | 62.7 | 224 |
| Marital status | ||||||
| Currently married | 16.5 | 39 | 7.7 | 39.9 | 42.3 | 3,486 |
| Widowed | 12.1 | 33.6 | 5.3 | 33.6 | 34.8 | 93 |
| Marital duration1 | ||||||
| Married only once | 16.7 | 38.8 | 7.9 | 39.6 | 42 | 3,526 |
| 0-4 years | 12 | 25.1 | 6.6 | 26.1 | 28.7 | 623 |
| 5-9 years | 15.4 | 36.6 | 7.3 | 36.9 | 38.9 | 622 |
| 10 or more years | 18.3 | 43.1 | 8.4 | 44 | 46.5 | 2,280 |
| Married more than once | 24.3 | 54.9 | 5 | 57.6 | 60.5 | 73 |
| Number of living children | ||||||
| 0 | 13.1 | 24.1 | 6.9 | 26 | 29 | 336 |
| 2-Jan | 13.9 | 35 | 6.4 | 35.5 | 38 | 1,161 |
| 4-Mar | 19.8 | 44.1 | 8.3 | 45.1 | 47.6 | 1,487 |
| 5 or more | 17.1 | 42.9 | 10.1 | 43.8 | 45.3 | 614 |
| Household structure2 | ||||||
| Nuclear | 18.5 | 42.6 | 9.8 | 43.5 | 45.6 | 1,711 |
| Non-nuclear | 15.3 | 35.9 | 6.1 | 36.8 | 39.4 | 1,887 |
| Religion | ||||||
| Hindu | 17 | 40.4 | 7.8 | 41.3 | 43.4 | 2,997 |
| Muslim | 15.7 | 32.2 | 7.9 | 33.5 | 37 | 597 |
| Caste/tribe | ||||||
| Scheduled caste | 20.6 | 44.7 | 8.1 | 45.8 | 47.8 | 908 |
| Scheduled tribe | 14.2 | 37 | 4 | 37 | 39.6 | 88 |
| Other backward class | 16.2 | 39.4 | 8.8 | 40.4 | 42.9 | 1,966 |
| Other | 14.2 | 30.5 | 4.8 | 31 | 33.4 | 613 |
| Respondent’s father beat her mother | ||||||
| Yes | 31.1 | 67.1 | 16.1 | 67.8 | 69.7 | 530 |
| No | 14.1 | 33.3 | 6.2 | 34.3 | 36.7 | 2,937 |
| Don’t know | 20.3 | 54.6 | 10.6 | 55.4 | 58.2 | 131 |
| Total | 16.8 | 39.1 | 7.9 | 40 | 42.4 | 3,598 |
Table 7: Spousal violence by background characteristics-Percentage of ever-married women age 18-49 by whether they have ever expe
Table 7: Spousal violence by background characteristics-Percentage of ever-married women age 18-49 by whether they have ever experienced emotional, physical, or sexual violence committed by their husband, according to background characteristics, Bihar, 2019-21 Note: Husband refers to the current husband for currently married women and the most recent husband for widowed, divorced, separated, or deserted women. Total includes divorced/separated/deserted women, women belonging to Christian or other religions, and women who don’t know their caste/tribe, who are not shown separately. 1Currently married women only 2Nuclear households are households comprised of a married couple or a man or a woman living alone or with unmarried children (biological, adopted, or fostered) with or without unrelated individuals. The remaining households are non-nuclear households.
| Background characteristic | Emotional violence | Physical violence | Sexual violence | Physical or sexual violence | Emotional, physical, or sexual violence | Number of women |
|---|---|---|---|---|---|---|
| Husband’s schooling | ||||||
| No schooling | 20.5 | 42.5 | 9 | 43.7 | 46.4 | 1,107 |
| <5 years complete | 20.5 | 48.6 | 9.9 | 49.2 | 51 | 195 |
| 5-7 years complete | 15 | 39.7 | 8.7 | 40.6 | 43.4 | 492 |
| 8-9 years complete | 14.4 | 44.2 | 9.3 | 45 | 46.3 | 514 |
| 10-11 years complete | 15.9 | 38.4 | 5.4 | 39 | 41.6 | 525 |
| 12 or more years complete | 14 | 28.8 | 6 | 29.6 | 31.9 | 735 |
| Husband’s alcohol consumption | ||||||
| Does not drink | 13.8 | 33.1 | 5.5 | 33.8 | 36.4 | 2,808 |
| Drinks/never gets drunk | 13.7 | 43.1 | 3.8 | 43.1 | 45.5 | 57 |
| Gets drunk sometimes | 24.1 | 58.1 | 14.1 | 60 | 61.4 | 626 |
| Gets drunk often | 55.8 | 81.8 | 35.2 | 83.3 | 84.4 | 107 |
| Spousal age difference1 | ||||||
| Wife older | -9.3 | -45.1 | -7.5 | -45.1 | -47.8 | 50 |
| Wife is same age | 8.2 | 21.5 | 4.8 | 23.2 | 23.6 | 89 |
| Wife 1-4 years younger | 16.8 | 40.6 | 8.7 | 41.5 | 43.5 | 1,602 |
| Wife 5-9 years younger | 17.3 | 37.9 | 7.3 | 39 | 41.9 | 1,405 |
| Wife 10 or more years younger | 15.6 | 39 | 6.2 | 39.6 | 42.3 | 339 |
| Spousal schooling difference | ||||||
| Husband has more schooling | 14.6 | 38.3 | 7.4 | 39.2 | 41.3 | 1,759 |
| Wife has more schooling | 18.1 | 39.5 | 9.5 | 40.3 | 42.5 | 544 |
| Both have equal schooling | 14.1 | 34.7 | 3.9 | 35.5 | 37.9 | 350 |
| Neither attended school | 21.4 | 42.7 | 9.5 | 43.8 | 46.6 | 914 |
| Number of marital control behaviors displayed by husband2 | ||||||
| 0 | 8.3 | 28.8 | 1.9 | 28.9 | 29.5 | 1,096 |
| 2-Jan | 11.8 | 38.1 | 6.7 | 39.3 | 41 | 1,370 |
| 4-Mar | 23.8 | 45.4 | 12.1 | 46.8 | 50.5 | 821 |
| 6-May | 50.5 | 62.9 | 22.8 | 64.2 | 72.1 | 311 |
| Number of decisions in which women participate3 | ||||||
| 0 | 21.3 | 40.6 | 11.5 | 41.6 | 43.8 | 440 |
| 2-Jan | 18.2 | 39.6 | 9.5 | 40.5 | 43.4 | 531 |
| 3 | 15.4 | 38.6 | 6.7 | 39.5 | 41.8 | 2,514 |
| Number of reasons for which wife beating is justified4 | ||||||
| 0 | 13.4 | 33.6 | 6 | 34.4 | 36.4 | 2,224 |
| 2-Jan | 21 | 47.6 | 10.1 | 49.1 | 52.2 | 580 |
| 4-Mar | 27.5 | 54.6 | 13.2 | 55.3 | 58.9 | 417 |
| 6-May | 18.9 | 42.5 | 10.6 | 43.1 | 44.8 | 236 |
| 7 | 19.1 | 38.1 | 8.2 | 39.9 | 43.1 | 143 |
| Number of reasons given for refusing to have sexual intercourse with husband5 | ||||||
| 0 | 28 | 38.9 | 15.6 | 41.3 | 44 | 187 |
| 2-Jan | 26.2 | 47.6 | 12.6 | 48.4 | 53.2 | 446 |
| 3 | 14.7 | 37.8 | 6.7 | 38.6 | 40.6 | 2,965 |
| Afraid of husband | ||||||
| Most of the time | 28 | 53.4 | 16.4 | 55.2 | 56.6 | 637 |
| Sometimes | 15.5 | 38.3 | 6.5 | 39.1 | 41.8 | 2,392 |
| Never | 10.1 | 26.4 | 4 | 26.9 | 28.7 | 569 |
| Total | 16.8 | 39.1 | 7.9 | 40 | 42.4 | 3,598 |
Table 8: Spousal violence by husband’s characteristics and empowerment indicator - Percentage of ever-married women age 18- 49 wh
Table 8: Spousal violence by husband’s characteristics and empowerment indicator - Percentage of ever-married women age 18- 49 who have ever suffered emotional, physical, or sexual violence committed by their husband, according to his characteristics, marital characteristics, and selected empowerment indicators, Bihar, 2019-21 Note: Husband refers to the current husband for currently married women and the most recent husband for widowed, divorced, separated, or deserted women. Figures in parentheses are based on 25-49 unweight cases. 1Currently married women only 2Behaviours include: Is jealous or angry if she talks to other men, frequently accuses her of being unfaithful, does not permit her to meet her female friends, tries to limit her contact with her family, insists on knowing where she is at all times, and does not trust her with any money 3 Currently married women only. Decisions included are decisions about own health care, major household purchases, and visits to her family or relatives. 4Reasons given for which wife beating is justified include: she goes out without telling him, she neglects the house or children, she argues with him, she refuses to have sexual intercourse with him, she doesn’t cook properly, he suspects she is unfaithful, and she shows disrespect for in-laws 5Reasons given for refusing to have sexual intercourse with husband include: she knows her husband has a sexually transmitted disease, she knows her husband has sex with other women, and she is tired or not in the mood
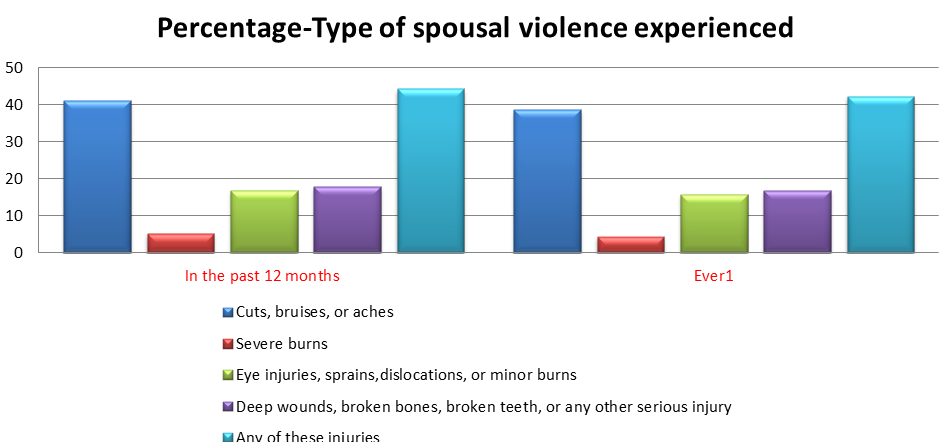
- Percentage of women who have had:
- Deep wounds, broken bones, broken teeth, or any other serious injury
- Eye injuries, sprains, dislocations, or minor burns
- Cuts, bruises, or aches
- Any of these injuries
- Type of spousal violence experienced
- Severe burns
- Experienced physical violence
- Ever1
- 20.8
- 1.4
- 6.2
- 5.7
- 23.5
- 1,406
- In the past 12 months
- 22
- 1.7
- 6.7
- 5.9
- 24.9
- 1,209
- Experienced sexual violence
- Ever1
- 36.4
- 4.2
- 14.6
- 15.2
- 39.6
- 283
- In the past 12 months
- 36.9
- 4.7
- 14.5
- 15.5
- 40
- 256
- Experienced physical or sexual violence
- Ever1
- 20.8
- 1.5
- 6.2
- 5.7
- 23.4
- 1,439
- In the past 12 months
- 21.9
- 1.7
- 6.6
- 5.8
- 24.7
- 1,253
- Experienced physical and sexual violence
- Ever1
- 38.5
- 4.4
- 15.8
- 16.8
- 42.1
- 250
- In the past 12 months
- 40.9
- 5.2
- 16.8
- 17.8
- 44.2
- 211
Table 9: Injuries to women due to spousal violence-Percentage of ever-married women age 18-49 who have experienced
| Help seeking/source of help | Type of violence experienced | Marital status | ||||
|---|---|---|---|---|---|---|
| Physical only | Sexual only | Both physical and sexual | Ever- married | Never married | Total | |
| Help seeking | ||||||
| Never sought help and never told anyone | 84.3 | -88.2 | 69 | 82.2 | 74.6 | 81.8 |
| Never sought help but told someone | 6.8 | -3.4 | 11 | 7.3 | 10.1 | 7.4 |
| Sought help | 8.9 | -8.4 | 20 | 10.5 | 15.3 | 10.8 |
| Don’t know/missing | 0 | 0 | 0 | 0 | 0 | 0 |
| Number of women who experienced violence | 1,279 | 42 | 269 | 1,511 | 79 | 1,590 |
| Sources of help among those who sought any help1 | ||||||
| Own family | 39.7 | * | 38.7 | 40 | * | 40.1 |
| Husband’s family | 46.7 | * | 43.5 | 48.5 | * | 45.1 |
| Current/former husband | 1.4 | * | 2 | 1.9 | * | 1.8 |
| Friend | 10 | * | 13.5 | 8.5 | * | 10.9 |
| Neighbour | 8.9 | * | 9 | 9.4 | * | 8.8 |
| Religious leader | 2.8 | * | 3.9 | 3.3 | * | 3.1 |
| Doctor/medical personnel | 4.8 | * | 0 | 3.4 | * | 3.2 |
Table 10: Help seeking-Percentage of women age 18-49 who have ever experienced physical or sexual violence by whether they have ev
| Police | 0 | * | 6.4 | 2.2 | * | 2 |
|---|---|---|---|---|---|---|
| Social service organization | 1.5 | * | 0 | 1.1 | * | 1 |
| Other | 4.2 | * | 1 | 2.1 | * | 3.1 |
| Number of women who experienced violence and sought help | 114 | 4 | 54 | 159 | 12 | 171 |
Table 11: Help seeking-Percentage of women age 18-49 who have ever experienced physical or sexual violence by whether they have ev
Table 10: Help seeking-Percentage of women age 18-49 who have ever experienced physical or sexual violence by whether they have ever sought help, and among those who have sought help from any source, the source from which help was sought, according to the type of violence experienced and marital status, Bihar, 2019-21 Note: Figures in parentheses are based on 25-49 unweight cases. An asterisk indicates that a figure is based on fewer than 25 weighted cases and has been suppressed. 1 Women can report more than one source from which they sought help
Data sources/measurement
National Family Health Survey, India – available at - http://rchiips.org/nfhs/bihar.shtml
Bias
The utilization of only secondary data from NFHS-5 is a kind of bias as felt by researcher and to address this potential source of bias the researcher will compare this with previous survey data to assess the improvement or degradation in the indicators related to this research in the next version of this research study.
Study Size
38 districts of the state of Bihar from selected 35,834 households, which includes 42,483 women of age 15-49 (including 6,350 women interviewed in PSUs in the state module), and 4,897 men of age 15-54.
Quantitative Variables
Kindly see table 2 to 10.
Results
Gender Role Attitudes
Out of total 6,386 women number of respondents and 4,545 men number of respondents 37.3 percent of women agree that a husband is justified in hitting or thrashing his wife under some circumstances and 33.9 percent men and 37.3% women agree that a husband is justified in hitting or thrashing his wife under some circumstances as per data of the survey see Table-2 and Figure-1. Maximum 23.3%women and 22.2% men respondents agreed that wife thrashing is acceptable if a woman shows disregard for her in-laws, 16.5%men and 16.7%women agreed thrashing women is acceptable if her husband doubts her of being disloyal, 10.3%men and 14.9%women agreed thrashing women is acceptable if She doesn’t cook properly, 8.4 and 10.3 percent men and women respectively agreed thrashing women is acceptable if She refuses to have sexual intercourse with him, 21.3 women and 17.6 % agreed thrashing women is acceptable if a woman argues with her husband, and 19.3 percent women and 12.8% men agreed thrashing women is acceptable if a woman neglects the house or children followed by 16.9 percent women and 12.8% men who agreed thrashing women is acceptable if a woman goes out without telling her husband and.
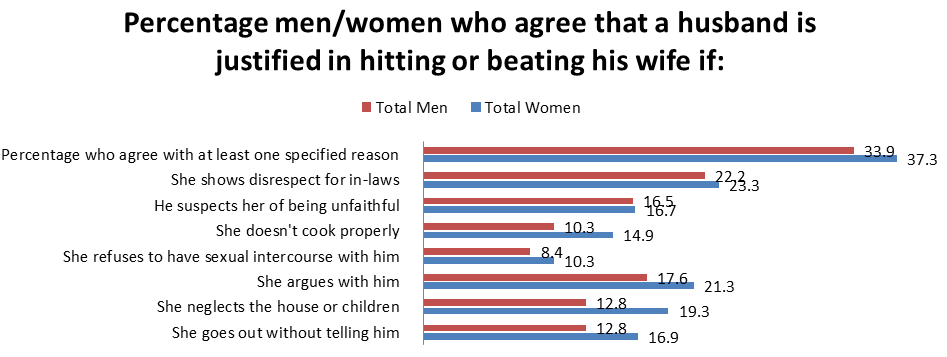
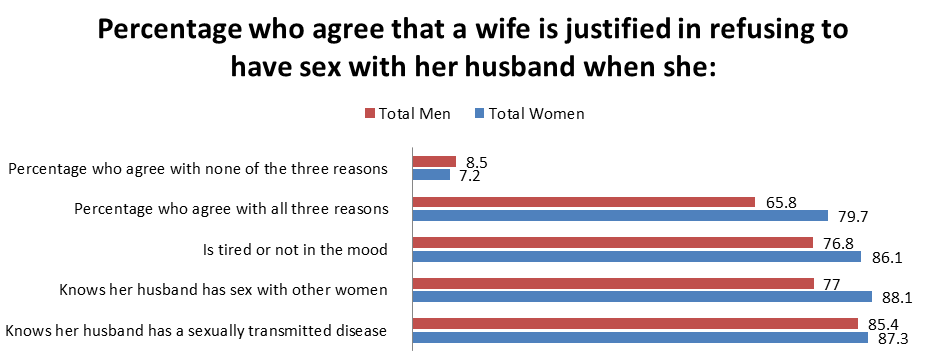
87.3% of women respondents and 85.4% of men respondents agreed that a woman is defensible in refusing to have sex with her husband if she knows he has a sexually transmitted disease, 88.1% of women respondents and 77% of men respondents agreed that a woman is defensible in refusing to have sex with her husband if she knows he has intercourse with other women and 86.1% of women respondents and 76.8% of men respondents agreed that a woman is defensible in refusing to have sex with her husband if she is tired or not in the mood –see Figure-2. More than three-quarters i.e. 78.4% of men agree that if a wife refuses to have sex with her husband he does not have a right to get angry and scold her, refuse to give her financial support, use force to have sex even if she doesn’t want to, or have sex with another woman see Table-2. To reduce the length of article the researchers have elaborated important findings. For more details please view table 1 to 10.
Impact of Education on Violence Against Women
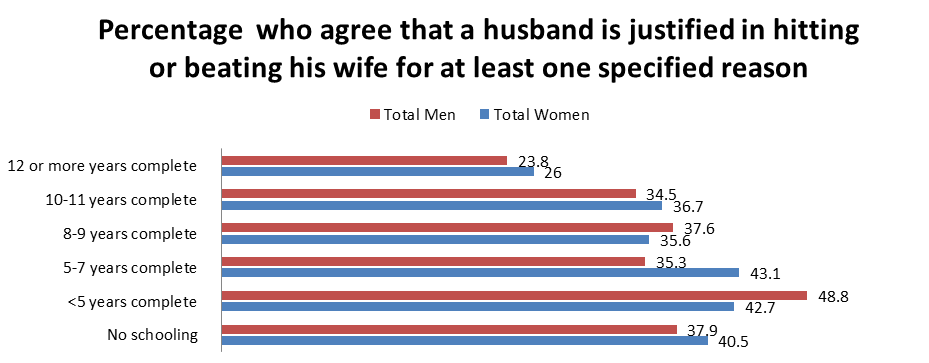
Among women and men who have completed 12 years of schooling, 26 % of women and 23.8 % of men agree that a husband is warranted in thrashing his wife for one or more of the specified reasons, while among men and women respondents without schooling 40.5 % of women and 37.9 % of men agree that a husband is warranted in thrashing his wife for one or more of the specified reasons see table-3 and figure-3.
Physical and Sexual Violence
In Bihar, 42.0 % of married women in 18-49 age groups have knowledgeable physical or sexual violence- see table-4. The survey data revealed that 39.6% of women have well- informed physical violence, 1.0% sexual violence and 6.7% both physical and sexual violence. For ever-married women who experienced physical violence since age 15, the most common executor was the current husband (95.1%).
Violence During Pregnancy
2.8 percent of women respondents out of 3403 surveyed between ages 18-49 have ever been pregnant and have ever experienced physical violence during their pregnancies. 5.2 percent women who are widowed, divorced, separated, or deserted, women with 10-11 years of schooling (4%), and rural women (3%), urban 1.9 % have experienced violence in pregnancy see table-5.
Spousal Violence
The data analysis of NFHS-5 revealed that 36.3% women stated to be slapped by their husband, 15.1% pushed, shaken, or having something thrown at them, or having their arm twisted or hair pulled, 12.5% reported being punched with a fist, 9.3% reported being kicked, dragged, or beaten up, 2.8% reported being choked or burned on purpose and 1.1%have been threatened or attacked with a weapon such as knife or gun see table-6, 7, 8,9. In Bihar, 39.1 percent of women age 18-49 have ever experienced physical violence, and 7.9 percent have ever experienced sexual violence while 16.8 % of women age 18-49 have ever experienced emotional violence. In total, 40 percent experienced physical and/or sexual violence and 7 percent experienced both physical and sexual violence while 42.4 % have ever experienced any form of physical and/or sexual and/or emotional violence. More than two-fifths (42.1%) of ever-married women age 18-49 in Bihar have experienced physical or sexual violence. Domestic violence is eminent among married women with 42% married only once, while women married more than once 60.5% and women who are in employment but not for cash 62.7% than women in any other group.
Impact of Alcoholism on Spousal Violence
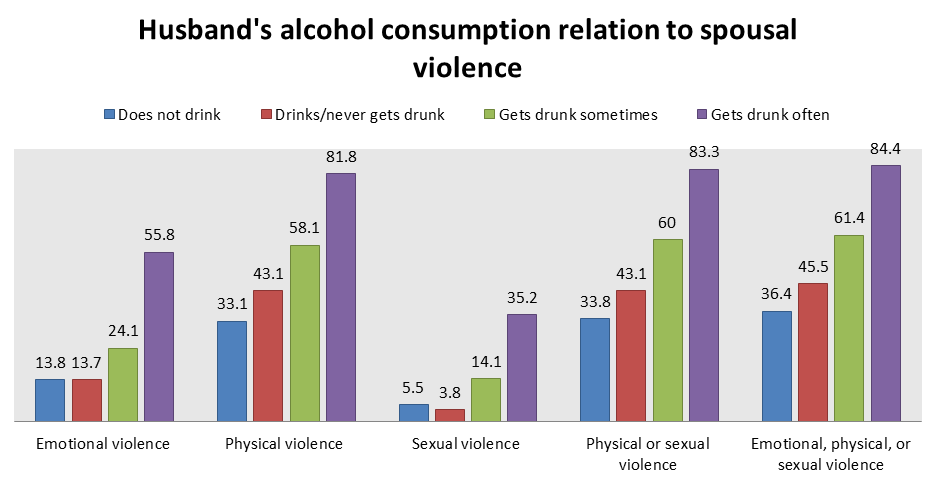
84.4% of women whose husbands often get drunk have experienced emotional, physical, or sexual violence, compared to those who gets drunk sometimes (61.4%), drinks/never gets drunk (45.4%) and minimum 36.4% of those whose husbands do not drink -see table-8 and figure-4. The survey data analysis revealed that the drinking pattern plays a crucial role in the extent of violence against women in the state. The more the men consume liquor, the more is the domestic abuse. Nearly, 56.6% of women are afraid of their husband most of the time that have experienced spousal violence.
Injuries to Women Due to Spousal Violence and Help Seeking
Injuries data of NHFS-5 report amongst married women revealed that most common knowledgeable physical and sexual violence in the past 12 months are cuts, bruises, or aches (40.9%), deep wounds, broken bones, broken teeth, or any other serious injury (17.8%), eye injuries, sprains, dislocations, or minor burns (16.8%), and severe burns (5.2%) see table-9 and 10. 23.4% of ever-married women age 18-49 have ever experienced physical or sexual violence reported suffering from injuries from what their husband did to them. 42.1% of women experienced both physical and sexual violence. The most common types of injuries among ever-married women who have experienced ever physical and sexual violence were cuts, bruises, or aches (38.5%); deep wounds, broken bones, broken teeth, or any other serious injury (16.8%); eye injuries, sprains, dislocations, or minor burns (15.8%); and severe burns (4.4%). Only 10.8 percent of women age 18-49 who ever experienced physical or sexual violence sought help, while 7.4 percent never sought help but told someone. 81.8% of women never sought help and never told anyone. Among women who sought help, the main sources of help were their husband’s family (45.1%), their own family (40.1%), friend (10.9%), and neighbor (8.8%). Only 3.2 percent of women sought help from a doctor/medical personnel and only 2 percent of women sought help from the police. The most dreadful is that only 10.8% women who suffered physical or sexual violence in the state of Bihar came out to seeking help while 7.4% women who suffered physical or sexual violence never sought help but told someone about the violence inflicted on them –see table-10 and Figure 5.
The estimates of this cross sectional sample survey may be affected by non-sampling errors, and sampling errors. Non- sampling errors are due to failure to locate and interview the correct sample household, misunderstanding of the survey questions by interviewer or the respondent, and data entry errors. Non-sampling errors are very difficult to avoid and also difficult to evaluate and correct statistically. The NFHS-5 sample is a multi-stage stratified design, Jackknife repeated replication method derives estimates of complex rates from each of several replications of the parent sample, and calculates standard errors for these estimates using simple formulae. Each replication considers all but one cluster in the
Discussion
Despite liquor ban in the state of Bihar, the National Family Health Survey (NFHS)-5 (2019-21) data revealed that maximum women in Bihar experience domestic violence (emotional, physical or sexual) only when their husband gets drunk which have a dual indication. First alcohol consumption is going on in Bihar indicating failure of complete liquor ban implementation and most important indication is that the alcohol consumption is having a direct relation in increasing violence against women. Hence alcohol must be banned in all locations of world on a global basis where its consumption is related to increased violence against women.
The World Health Organization recognizes that violence against women, particularly domestic or spousal violence is a major public and clinical health problem and a violation of women’s human rights, which also reflects the scale of gender inequality and discrimination against women. The consequences of violence on physical, mental, sexual, and reproductive health often last a lifetime.
Limitations
This is a novel study which is trying to find out impact of alcohol and other factors on violence against women in Bihar in a new way but the key limitation is poor data resources as well as lack of funds for field investigation by the researcher.
References
-
Department of Prohibition and Excise (erstwhile the Department of Excise and Prohibition)- Government of Bihar, India.
-
National Family Health Survey, India.
-
The Bihar Prohibition and Excise (Amendment) Bill, 2022, India.
-
The Times of India.
-
Popovici I, French MT (2013) Does Unemployment Lead to Greater Alcohol Consumption? Ind relat (Berkeley) 52(2): 444-466.
-
The Times of India.
-
Liquor smuggling in Bihar: Two arrested, six cops suspended (2021) The Times of India.
-
WHO (2019) 10 areas governments could work with to reduce the harmful use of alcohol. world health organization.
-
Piyush K, Anupama A (2022) Analysis of NITI AAYOG (National Institution for Transforming India) Health Index Report on the Ranking of States and Union Territories: A Cross Sectional Observational Research Study Round 1 (2014-2016)-V1, pp: 1-19.
-
WHO (2022) Health Topic Alcohol, India. World Health Organization.
-
Sharma I (2015) Violence against women: Where are the solutions? Indian J Psychiatry 57(2): 131-139.
-
Kumar DP, Anupama A (2022) Impact of Covid-19 pandemic on Prevalence of complaints related to violence against women in India - A cross-sectional comparative research study from 2014 to 2022? CrimRxiv.
-
Piyush K (2021) What Impact Have SARS-CoV-2/ COVID-19 Pandemic on Domestic Violence against Women in India across Different States and Union Territories from the Beginning of Lockdown Due to COVID-19 Pandemic in March 2020 Till 20Th September 2020? How COVID-19 Pandemic Induced Lockdown Influence Mental Health of Women in India?, pp: 1-14.
-
Piyush K, Anupama A (2022) What Impact Have COVID-19 Pandemic Era on Violence against Women in India - A Retrospective Comparative Research Study from January 2018 to December 2021. Qeios, pp:1-31.
-
Piyush K, Anupama A (2022) Impact of Covid-19 Pandemic on Prevalence of Complaints Related to Violence against Women in India - A Cross-Sectional Comparative Research Study from 2014 to 2022?, pp: 1-13.
-
Kumar P, Anupama A (2022) Impact of Covid-19 pandemic on Prevalence of violence against women complaints in India - A cross-sectional comparative research study from 2014 to 2022? Cambridge Open Engage.
-
Piyush K, Anupama A (2022) Impact of Covid-19 pandemic on Prevalence of complaints related to violence against women in India - A cross-sectional comparative research study from 2014 to 2022?. CrimRxiv, India.
-
Piyush K, Anupama A(2022) What can be impact of civil authorities faulty mortality registration on COVID-19 mortality count in the state of Bihar, India- Evidence from NFHS-5. Research Square, pp: 1-9.
- Intersecting Epidemics and Climate Vulnerabilities in Conflict- Driven Displacement: Epidemiology, Systemic Challenges, and One Health Gaps in South Sudan
- Advancing Domestic Health Financing for Community Health System Sustainability in South Sudan: The Boma Health Initiative Model (2025–2035)
- Prevalence and Correlates of Post-Exposure Prophylaxis Uptake among Men Who Have Sex with Men in Kisumu County, Kenya
- Medical, Ethical, and Legal Conflicts Surrounding Euthanasia in Argentina. Its Global Implications
- Knowledge and Attitude on Menstrual Hygiene among Adolescent Girls Studying in Secondary Level in Public Schools of Chitwan District, Nepal
- Biological Efficacy of an Adulticide Mixture (clothianidin + deltamethrin) as an Indoor Residual Spray against Adult Anopheles flavirostris in Palawan, the Philippines