Modeling of Aggregation and Gelation of Nanoparticles Using Quadrature Method of Moments
Applications of Nanotechnology are growing significantly in the petroleum industry such as oil recovery, and well stimulation. In aqueous media, silica nanoparticles aggregate if there is sufficient attractive energy between nanoparticles. Aggregate size distribution evolves as aggregation continues, and once it spans the space, it forms a gel. The objective of this study is to study the aggregation and gelation kinetics in the batch. Population Balance equation (PBE) is used to model the kinetics of aggregation. Quadrature method of moments (QMOM) is used to convert the PBE with continuous distribution of nanoparticle size into a set of moment equations for efficient computation. The closure problem for moment transport equation is resolved using Gaussian Quadrature that requires estimation of roots orthogonal polynomials. Wheeler algorithm is then used for calculation of the coefficients of the recursive formula of the orthogonal polynomials. This study shows that the PBE and the QMOM along with the effective medium theory can be used to model the aggregation and gelation of nanoparticles at different conditions of salinity and concentration. The modeled developed in this study is used to compare between the kinetics of aggregation and gelation of fumed silica and colloidal silica nanoparticles at the same conditions. The case studies presented show the unique behavior of fumed silica over colloidal silica nanoparticles for forming a gel network at significantly low concentration. This is basically due to the fractal structure of the fumed silica nanoparticles that has higher effective volume than the spherical particles of colloidal silica of the same size. The model also shows that there is a critical concentration of salt and nanoparticles above which the viscosity increase, and the gel network can be formed. The model developed in this study can be coupled with a transport model to simulate nanoparticles transport aggregation and in situ gelation in porous media.
Introduction
Solid suspensions have a wide practical interest in many aspects of daily life such as foods, pharmaceuticals, household products, and the environment. Applications of solid suspensions in petroleum industry is quite important and widespread such as drilling fluids, enhanced oil recovery, water shutoff, etc. [1, 2, 3, 4]. Generally, there are two classes of silica nanoparticles; colloidal silica, and fumed silica nanoparticles [5, 6]. Colloidal silica nanoparticles are spherical particles formed by precipitation method. Fumed silica nanoparticles are composed of primary particles fused by pyrogenic process together to form hard aggregates of fractal structure. Fumed silica can display rheological properties similar to colloidal silica when scaled with the free volume in the suspension [7]. This means that fumed silica can give similar behavior with lower volume fraction in the suspension due to fractal structure that have lower packing factor compared to colloidal silica.
Principles of Aggregation
Aggregation of silica nanoparticles can be explained within the framework of DLVO [8, 9]. The most important forces that control the kinetics of aggregation and the properties of dispersion are dispersion and electrostatic forces. For silica dispersion in polar solvents, solvation forces due to the hydrogen bonding of the solvent to the surface silanol groups play a key role [7, 10]. Theoretically, the kinetics of aggregation depends on the magnitude of energy barrier between nanoparticles. Nanoparticle that overcome the energy barrier will aggregate with another particle in the deep primary energy minimum. Smith & Zukoski [7] studied the aggregation and gelation of fumed silica nanoparticles dispersed in ethanol. Ethanol is a very polar solvent due to the presence of hydroxyl group. They showed that at low concentration, gelation is arising from aggregation into a primary minimum due to hydrogen bonding and dispersion forces. The gelation is extremely slow due to an energetic barrier (∼ 25kT) in the inter-particle potential associated with solvation forces. The solvation forces also contribute to the formation of a secondary minimum in the interparticle potential. The depth of this minimum (∼ 3kT) is sufficient that, at a critical particle concentration, long-range diffusion is arrested due to the short-range attractions and the cooperative nature of particle interactions, as described by mode coupling theory. Aggregation causes the particle size distribution (PSD) to change with time. Many evidences show that particle aggregates from natural waters and engineered systems have fractal structures [11, 12]. Lee developed an innovative approach that models change in PSD by incorporating recently proposed fractal mathematics and introduced a new conceptual framework called the coalesced fractal sphere (CFS) assumption [13]. The rheological behavior of fumed silica suspensions depends on the structure of the aggregates formed in the suspension [14]. The mechanism of aggregation of fumed silica nanoparticles depends on the polarity of the solvent [14, 15, 16]. Primary hydrophilic fumed silica particles usually form chain-type aggregates of sub-micron size in air, with a density of ~3 surface silanol groups per nm2, due to hydrogen bonding between the silanol groups on the particle surfaces. For fumed silica dispersed in nonpolar solvent, fumed silica nanoparticles attach through hydrogen bonding between the silanol groups on the surface of fumed silica nanoparticles. On the other hand, fumed silica nanoparticles dispersed in polar solvents like water that hydrogen bonding ability could retain a stable dispersion with limited or no aggregation due to preferential hydrogen bonding of surface silanol groups with the corresponding dispersing liquids [16]. Water for example, can form a structured layers of water molecules on the surface of fumed silica nanoparticles through hydrogen bonding. These structured layers of water molecules produce a steric repulsion between the fumed silica nanoparticles and prevent their aggregation. Environmental conditions can promote silica inter- nanoparticle interaction to form larger fractal structures [13]. There are many different parameters that control the aggregation and gelation of fumed silica nanoparticles in aqueous solvents such as concentration of nanoparticles, temperature, pH, and ionic strength [7, 9, 17, 18]. Aqueous suspensions of fumed silica of concentration lower than a critical concentration are stable. However, above the critical particles concentration, aqueous suspensions of the fumed silica particles form gel-like structures, and the higher concentration the stronger the gel structure. This critical concentration marks the transition from Newtonian to shear thinning flow [18]. Alternatively, salt can be added, which at high enough concentration, collapses the diffuse electrostatic double layer so that particles can approach closely enough to be drawn into near contact by van der Waals forces. The time required for particles to diffuse into their attractive minima scales to the exponential of height of energy barrier [9]. Because of this exponential dependence, even small 100-nm-diameter particles in a low-viscosity solvent take months or even years to aggregate if the potential barrier is high. Aggregation could dramatically become faster at the electrolyte concentration at which the potential barrier is eliminated (critical coagulation concentration). Critical coagulation concentration (ccc) is the electrolyte concentration at which the transition from a slow to rapid aggregation regime occurs for a given suspension i.e. the electrostatic repulsion vanishes [19]. Amiri [18] shows that in the absence of salt in dispersing water, fumed silica demonstrates negligible changes in viscosity at different pH of the solution [18]. Increasing the salt concentration at any pH had increasing effect on viscosities of the fumed silica dispersions. Oxides such as SiO2, contain hydroxyl groups at their surfaces that can be hydrolyzed in aqueous media to form negative charges [20, 21]. Addition of an acid or base tends to neutralize these groups, and enhancing the interaction between particles.
Acidic: SiOH + H3O+ →SiOH2
+ + H2O (a) Basic: SiOH + OH− →SiO−+ H2O (b) Primary hydrophilic fumed silica particles usually form chain-type aggregates of sub-micron size in air, with a density of ~3 surface silanol groups per nm2, due to hydrogen bonding between the silanol groups on the particle surfaces. Hydrophilic fumed silica powders are well dispersed at 𝜙< 0.01 in polar dispersing fluids or polar polymer melts, and their phase states change from sol to gel with increasing 𝜙 [14]. However, when fumed silica powders are dispersed in polar dispersing liquids, agglomerate formation is often suppressed, owing to preferential hydrogen bonding of surface silanol groups with the corresponding dispersing liquids. Below pH 2, the zeta potential of fumed silica is slightly positive and the values approach the isoelectric points, which are located in the range of pH 3–3.5. Amiri [18] found that at acidic pH of 2 and up to 4.5, increasing salt concentration did not change the viscosities effectively from that of water [18]. This abnormal stability of fumed silica dispersion at acidic pH is related to the structural repulsion of the hydrated layers of water molecules [22]. At acidic conditions, reaction (a) is dominant due to surplus of protons in the solution. This indicates higher ability of water to structure at the surface of fumed silica by hydrogen bonding with surface silanol groups. This structured layer of water molecules induces electrostatic repulsion that prevents bridging of nanoparticles. At basic pH, the zeta potentials of the suspensions in these ranges varied between 23-27 mV, which is low enough to electrostatically stabilize the systems. However, Amiri found that addition of salt to fumed silica dispersion at pH far enough from i.e.p produced stronger networks than that at i.e.p [18]. Pronounced instability of fumed silica dispersion at basic pH is due dominance of reaction (b) that ion-exchange between the cations in the electrolyte and protons of the silanol groups that prevents water molecules binding to silica. Then coagulation occurs by the interaction of associated and disassociated silanol (SiO− 𝑎𝑛𝑑 SiOH). It is assumed that there is a rather higher ability of water to form hydrated layer as discussed above for fumed silica (SiOH) surface compared to the colloidal silica (SiO2). This is due to existence of OH bound to the silanol groups of fumed silicas. Such hydrated layer between the particles keeps particle surfaces apart from each other and prevents their bridging. On addition of electrolyte to the above system, the electrolyte cation ions can extract water from the silica surface and decrease the thickness of the hydration layer formed by water and reduce the extent of short-range repulsion. According to this hypothesis, the size of the cations and its affinity to the water are essentially important. van der Linden [23] shows that Hofmeister Series can explain the effect of different monovalent ions on the rheological properties of colloidal silica dispersions [23]. Monovalent alkali ions are divided into two classes according to their ability to structure water molecules in their vicinity: smaller highly hydrated cations (known as structure maker); larger poorly hydrated cations (known as structure breaker). At basic pH (~9.8), less hydrated ions such as K+ can absorb easily on the silica surface to create bridging effect [24]. The aggregation of nanoparticles is a function of the Brownian motion of the particle which increase significantly with increasing temperature. Amiri [17] shows that increasing the temperature increases the aggregation kinetics and reduced the gelation time [17]. Also, the fractal dimension of the aggregates decreases with increasing the temperature. This means a more open gel network is formed at higher temperature. Once the aggregates form a network structure that spans the whole space to form infinite network, i.e. effective volume fraction of nanoparticles equals one, a pseudo-solid called gel is formed [7, 18, 25, 26, 27, 28]. This pseudo-solid gel exhibits a shear thinning behavior that applying stress could break the aggregates and destroying the structure [29, 30]. However, when the stress is ceased, the restoration of the network is instantaneous and the gel forms.
Models of Aggregation and Gelation
Inter–particle interactions can be described by the second order theoretical formulation proposed by Elimelech based on Smoluchowski approach [8]. Aggregation is the result of two events: the collision of particles, which is characterized by a collision frequency induced by hydrodynamics, and the attachment of particles which is represented by the collision efficiency because not all encountered collisions are necessarily successful. The efficiency is controlled by both the hydrodynamics and physiochemistry. In shear flow, larger aggregates can break down into smaller ones. There are different expressions for aggregation and breakage kernels in the literature. Population balance equation (PBE) that is the integral form of Smoluchowski equation can efficiently model the aggregation and breakage of nanoparticles [31, 32]. PBE is essentially a transport equation that tracks number density of aggregates of certain size at any location and at any time in a system. There are different methods can be applied for solving PBE such as discretization methods, Lagrangian method, and quadrature method of moments (QMOM) [13, 31, 33, 34, 35, 36, 37, 38, 39, 40]. Among all the available methods for solving PBE, the Quadrature Method of Moments (QMOM) is the most efficient one. QMOM transfers PBE into a set of moment equations. So that the lower-order moments of PSD are tracked with high accuracy with a low computational cost. QMOM was first proposed by McGraw for the description of aerosol dynamics by tracking the evolution of lower order moments of an unknown aerosol distribution [41]. Moment methods are an important class of approximate models derived from kinetic equations but require closure to truncate the moment set. In QMOM, closure is achieved by inverting a finite set of moments to reconstruct a point distribution from which all unclosed moments that can be related to the finite moment set. QMOM are widely used for modeling aggregation-breakage of particulate systems [42, 43, 44, 45]. QMOM is also used for solving the kinetic equation arising in a wide variety of physical systems [38]. Conventional QMOM usually fails when tracking more than four size classes, and thus, it is difficult to construct the PSD from the conventional QMOM. Also, numerical difficulties may arise in case of large variations of moments. Su employed adjustable factors assigned to different processes to track the moments of PSD with lower computational demands than that from the standard QMOM [39, 40]. This adjustable factor allows the moments of size distribution to be adjusted to improve the accuracy or reduce the computation time. QMOM with adjustable factor was used to model the evolution of floc size distribution (FSD) of kaolinite suspension and colloidal montmorillonite [46, 47]. This paper is divided into three main parts. In the first part, we provided an extensive literature review of the fundamentals of aggregations and gelation of nanoparticles. In the second part, a mechanistic model based on PBE and QMOM will be presented that can model the aggregation and gelation kinetics at different conditions. In the last part, case studies of the kinetics of aggregation and gelation of fumed silica compared to colloidal silica will presented to show the capability of the mechanistic model presented in this paper. However, these case studies do not show all the capabilities of the model. Further discussion of the model will be presented in future papers.
Population Balance Model
Population balance equation (PBE) is a continuity statement that describes the evolution of a number density function (NDF) of particle volume dispersed in the system [31]. The particle size distribution (PSD) is a NDF representing the number concentration of particles with volumes between 𝑣 𝑎𝑛𝑑 𝑣+ 𝑑𝑣. PSD evolved with time due to particles aggregation. Under shear flow, large aggregate can break into smaller one that may aggregate with other particles again. The volume based PBE can be written as in Equations 1 through 5, where 𝑛(𝑣; 𝑡) is the NDF of aggregates of volume 𝑣, 𝐵𝑎(𝑣;𝑡) 𝑎𝑛𝑑 𝐷𝑎(𝑣; 𝑡)are birth and death of aggregates of volume 𝑣 due to aggregation, and 𝐵𝑏(𝑣; 𝑡) 𝑎𝑛𝑑 𝐷𝑏(𝑣;𝑡)are birth and death of aggregates of volume 𝑣 due to breakage [37].
𝜕(𝑛(𝑣; 𝑡)) 𝜕𝑡 = 𝐵𝑎(𝑣; 𝑡) −𝐷𝑎(𝑣; 𝑡) + 𝐵𝑏(𝑣; 𝑡) −𝐷𝑏(𝑣;𝑡)(1)
𝑣 𝐵𝑎(𝑣; 𝑡) = 1
2 ∫𝛼(𝑣−𝑢, 𝑢)𝛽(𝑣−𝑢, 𝑢)𝑛(𝑣 (2)
0 −𝑢; 𝑡)𝑛(𝑢; 𝑡)𝑑𝑢 ∞ (3)
𝐷𝑎(𝑣; 𝑡) = 𝑛(𝑣; 𝑡) ∫𝛼(𝑣, 𝑢)𝛽(𝑣, 𝑢)𝑛(𝑢; 𝑡)𝑑𝑢
0 ∞ (4) 𝐵𝑏(𝑣; 𝑡) = ∫𝑎(𝑣, 𝑢)𝑏(𝑢)𝑛(𝑢; 𝑡)𝑑𝑢 𝑣 𝐷𝑏(𝑣; 𝑡) = 𝑏(𝑣)𝑛(𝑣; 𝑡) (5)
In these equation, 𝛽(𝑣, 𝑢)is the collision frequency of particles of volume 𝑣 𝑎𝑛𝑑 𝑢, 𝛼(𝑣, 𝑢) is the collision efficiency of particles of volume 𝑣 𝑎𝑛𝑑 𝑢, 𝑏(𝑣) is the breakage kernel that represents the break frequency of aggregates of volume 𝑣, and 𝑎(𝑣, 𝑢) is the fragment distribution function that represent the number density function of aggregates of volume 𝑣 produced by breakage of aggregates of volume 𝑢. To involve the fractal dimension into the PBE, Vlieghe proposed the following relationship between volume based NDF (𝑛(𝑣; 𝑡)) and length based NDF (𝑛(𝐿; 𝑡)) [37].
𝑛(𝑣; 𝑡) = 𝑛(𝐿;𝑡) 𝛷𝐷𝑓𝐿𝐷𝑓−1 (6)
3−𝐷𝑓 (7) 𝛷= 𝛷𝑜𝐿𝑜
𝛷𝑜= 𝜋
6 (8) where 𝐷𝑓 is the fractal dimension of the aggregates, 𝐿 is the length of aggregates and 𝐿𝑜 is the initial length of the particles assumed that the aggregates composed of identical particles. 𝛷𝑜geometric shape factor of primary particles assuming that primary particles are perfect spheres. 𝛷geometric factor of the fractal structures formed by aggregation of the primary particles. Applying Equation (6) into Equations (1)–(5), the length-based PBE can be derived as the following as a function of aggregate sizes (𝐿 𝑎𝑛𝑑 𝜆) 𝜕(𝑛(𝐿; 𝑡)) 𝜕𝑡 = 𝐵𝑎(𝐿; 𝑡) −𝐷𝑎(𝐿; 𝑡) + 𝐵𝑏(𝐿; 𝑡) −𝐷𝑏(𝐿; (9) 𝐿 𝐵𝑎(𝐿; 𝑡) = 𝐿𝐷𝑓−1
1 𝐷𝑓, 𝜆). 𝛽(( 𝐿𝐷𝑓
2 ∫𝛼(( 𝐿𝐷𝑓−𝜆𝐷𝑓)
1 𝐷𝑓;𝑥, 𝑡) . 𝑛(𝜆; 𝑥, 𝑡). (( 𝐿𝐷𝑓
−𝜆𝐷𝑓)
1 𝐷𝑓
−1)𝑑𝜆 −𝜆𝐷𝑓) ∞ (11) 𝐷𝑎(𝐿; 𝑡) = 𝑛(𝐿; 𝑡)∫𝛼(𝐿, 𝜆)𝛽(𝐿, 𝜆)𝑛(𝜆; 𝑡)𝑑𝜆
0 ∞ (12) 𝐵𝑏(𝐿; 𝑡) = ∫𝑎(𝐿, 𝜆)𝑏(𝜆)𝑛(𝜆; 𝑡)𝑑𝜆 𝑣 𝐷𝑏(𝐿; 𝑡) = 𝑏(𝐿)𝑛(𝐿; 𝑡) (13)
𝛽(𝑣, 𝑢) = 𝛽(𝐿, 𝜆) 𝛷𝐷𝑓𝐿𝐷𝑓−1 (14)
Moment Transformation
Moment transform can be applied to Equation (9) using the following definition [41, 48]:
∞ (15) 𝑚𝑘= ∫𝐿𝑘𝑛(𝐿; 𝑡)𝑑𝐿
0 in which 𝑚𝑘is the 𝑘𝑡ℎ order moment and the size class L varies from zero to infinity in the transformation. McGraw proposed applying Gaussian quadrature approximation to replace the integration terms by a set of weight and abscissas of the NDF [41].
𝑁𝑞
∞ 𝑘 𝑚𝑘= ∫𝐿𝑘𝑛(𝐿; 𝑡)𝑑𝐿 = ∑𝜔𝑖𝐿𝑖
(16) 𝑖=1 = 𝛺× (𝛤𝑘)𝑇 (𝑘= 0,1, … ,2𝑁𝑞−1)
0 𝛤= [𝐿1, 𝐿2, . . , 𝐿𝑁𝑞] is a vector with each component representing a node in the Gaussian quadrature approximation.𝛺= [𝜔1, 𝜔2, . . , 𝜔𝑁𝑞] is also a vector in which each component is the weight (also the characteristic number density) corresponding to 𝐿𝑖. The superscript T stands for the transpose of a vector. 𝑁𝑞 is the number of quadrature that represents the number of size classes of the aggregates. Using this transformation, Equation (16) can only allow to track three or four size classes that would be sufficient to track the lower order moments. To reasonably produce the PSD curve higher order moments are required. However, tracking higher order moments could produce ill-conditioned problem due to the higher difference between 𝐿1 𝑎𝑛𝑑 𝐿𝑁𝑞 with larger 𝑘, i.e., (𝐿1)1 ≪(𝐿𝑘)𝑘 [49]. This would produce unreliable results i.e. negative weights and/or size that do not have physical meaning. To relax the severity of ill-condition by reducing the difference between (𝐿1)1𝑎𝑛𝑑(𝐿𝑘)𝑘 Su added an adjustable factor, 𝑝 in QMOM and re-defined the adjustable moments as [40].
𝑁𝑞
∞ 𝑚𝑘/𝑝= ∫𝐿𝑘𝑝 ⁄ 𝑛(𝐿; 𝑡)𝑑𝐿 𝑘𝑝 ⁄
= ∑𝜔𝑖𝐿𝑖 (17) 𝑖=1 = 𝛺× (𝛤𝑘𝑝 ⁄ )𝑇 (𝑘= 0,1, … ,2𝑁𝑞−1
0 In case of 𝑝= 1, this could be reduced back to the conventual QMOM as in Equation (16). Applying the transformation in Equation (17), the PBE in Equation (9) is transformed into a set of moment equations (𝑘= 0,1, . . , 𝑀) that are a system of non-linear integro- differential equations (Equation (18)). Applying the quadrature approach transform the integrals into simple summations (Equation (19)).
𝜕(𝑚𝑘/𝑝) 𝜕𝑡 ∞ ∞ = 1
. 𝛽(𝐿, 𝜆)( 𝐿𝐷𝑓
2 ∫𝑛(𝜆; 𝑡) ∫𝛼(𝐿, 𝜆)
0
0 𝑘/𝑝 + 𝜆𝐷𝑓) 𝐷𝑓.𝑛(𝐿; 𝑡)𝑑𝐿𝑑𝜆 ∞
∞ (18) −∫𝐿𝑘/𝑝𝑛(𝐿; 𝑡) ∫𝛼(𝐿, 𝜆) . 𝛽(𝐿, 𝜆)𝑛(𝜆; 𝑡)𝑑𝜆𝑑𝐿
0 Additionally, PSD can be estimated from moments is inverse problem. PSD, which is number density function can be estimated by using the following relationship [41]:
𝑁𝑞
(21) 𝑛(𝐿; 𝑡) ≈∑𝜔𝑖(𝑡)𝛿[𝐿−𝐿𝑖(𝑡)]
𝑖=1 where δ is the Dirac delta function which means at any time t, δ is zero except at 𝐿= 𝐿𝑖(𝑡).
Breakage and Aggregation Kernels
Collision Frequency, β
Collision frequency represents the two number of collisions between two particles of given sizes 𝐿 and 𝜆. There are several expressions for collision frequency in the literature. Basically, collisions result from Brownian diffusion, differential sedimentation or shear flow. However, when particle size is submicron, Brownian diffusion is the dominant mechanism of collision [8, 50]. With aggregation and increase of effective size of aggregates shear flow becomes more significant. For submicron particles, differential sedimentation can be neglected.
(22) (𝐿𝑖+ 𝐿𝑗)2
𝑃𝑒𝑟𝑘𝑖𝑛𝑒𝑡𝑖𝑐: 𝛽𝑝𝑒𝑟(𝐿𝑖, 𝐿𝑗) = 2
𝑘𝐵𝑇
3 𝜇 𝐿𝑖𝐿𝑗
6 (𝐿𝑖+ 𝐿𝑗)3 (23)
𝑂𝑟𝑡ℎ𝑜𝑘𝑖𝑛𝑒𝑡𝑖𝑐: 𝛽𝑜𝑟𝑡ℎ(𝐿𝑖, 𝐿𝑗) = 𝐺
Where 𝑘𝐵 is the Boltzmann constant, 𝑇 is the temperature of the dispersion, 𝜇 is the viscosity of the dispersion, and 𝐺 is the shear rate.
Collision Efficiency, 𝜶
The effect of energy barrier on aggregation is to reduce the rate of aggregation due to electrostatic repulsion. Stability ratio ( 𝑊), the reciprocal of the collision efficiency is simply the ratio of the aggregation rate in the absence of energy barrier to that with energy barrier [8]. The stability ratio and collision efficiency can be calculated using the following:
𝜙𝑇 𝑘𝐵𝑇) ∞ exp ( (24)
𝑊= 2 ∫𝜒(𝜎)
(𝜎+ 2)2 𝑑𝜎
0 𝛼(𝐿𝑖, 𝐿𝑗) = 1/𝑊 Where 𝜙𝑇 is the total electrostatic interaction between particles at separation distance ℎ, and 𝜎 is a function of ℎ and particle size.
$$ \sigma = \frac {2 h}{L _ {i} + L _ {j}} $$
(25) 𝜒(𝜎) is the hydrodynamic effect. As the particles approach close, it becomes increasingly difficult for liquid between them to be drained out the gap and this tends to slow the aggregation process.
𝜒(𝜎) = 6𝜎2 + 13𝜎+ 2
6𝜎2 + 4𝜎 (26) The total electrostatic interaction ( 𝜙𝑇) is the summation of electric double layer repulsion, van der Walls attraction, and in case of silica nanoparticles solvation force can be added to accurately predict the interaction energy. Zeta potential is the main factor that controls the electrostatic interaction [51]. 𝜁
0.85𝑘𝐵𝑇 𝑓(𝜅𝑎𝑝)𝑒(𝑝𝐻𝐼𝐸𝑃−𝑝𝐻)[1 + 𝑣𝜁(𝑇−𝑇0)]
(27 𝑠1 ) = 𝜁𝑐𝑢𝑡−𝑜𝑓𝑓+ 𝑠2 𝑓(𝜅𝐿𝑖) (𝑝𝐻𝑐𝑢𝑡−𝑜𝑓𝑓−𝑝𝐻)[1 + 𝑣𝜁(𝑇−𝑇0 {
Ohshima [52] presented a simple approximate expression for Henry’s function which is applicable for any value of 𝜅𝐿𝑖 [52].
𝑓(𝜅𝐿𝑖) = 1 + 1 (28)
6 [ 2𝐿𝑖𝐿𝑗 ℎ2 + 2𝐿𝑖ℎ+ 2𝐿𝑖𝐿𝑗 ℎ2 + 2𝐿𝑖ℎ+ 2𝐿𝑗ℎ+ 4𝐿𝑖𝐿
𝜙𝑣𝑑𝑤= −𝐴𝐻 (29) + ln ( ℎ2 + 2𝐿𝑖ℎ+ 2𝐿𝑗ℎ ℎ2 + 2𝐿𝑖ℎ+ 2𝐿𝑗ℎ+ 4𝐿𝑖𝐿𝑗
)]
Where 𝐴𝐻is the Hamaker constant [9]
3/2 (30) ) 𝜀 is the dielectric constant, 𝑛 is the refractive index, the subscripts 𝑝 𝑎𝑛𝑑 𝑐 correspond to the properties of the particle and continuous phase, respectively, ℎP is the Planck constant, and 𝜐𝑒 is the characteristic adsorption frequency. Electric double layer repulsion using linearized Poisson-Boltzmann equation [54].
𝜀𝑝+ 𝜀𝑐 (𝑛𝑝2 + 𝑛𝑐2)
16√2 𝜙𝐸𝐷𝐿
2 + 𝜁𝑗
2) 4(𝐿𝑖+ 𝐿𝑗) [ 2𝜁𝑖𝜁𝑗 (𝜁𝑖 = 𝜀0𝐿𝑖𝐿𝑗(𝜁𝑖
2)ln (1 + 𝑒𝑥𝑝(−𝜅ℎ)
1 −𝑒𝑥𝑝(−𝜅ℎ))
2 + 𝜁𝑗 (31) + ln(1 −exp(−2𝜅ℎ)]
Debye length
1/2 𝜅= (𝑒2 ∑𝑧𝑖
2𝑐𝑖0 𝑖 𝜀𝑐𝜀0𝑘𝐵𝑇) (32) Where 𝜀0 is the vacuum permittivity, z is the valence number of the ion, e is the charge of an electron, 𝜁𝑖𝑎𝑛𝑑 𝜁𝑗 are the zeta potentials of aggregates of size 𝐿𝑖 𝑎𝑛𝑑 𝐿𝑗, respectively. 𝜅−1 is the Debye length, and 𝑐𝑖0 is the bulk concentration of ion species i. Hydration repulsion originates from the overlap of structured layer of water molecules at the surfaces of hydrophilic nanoparticles [55]. Hydration force can be expressed by Binks BP, Lumsdon SO, Chapel JP [56, 57].
𝜙𝐻𝑌𝐷= 𝜋𝐿𝑖𝑁𝐴𝐶ℎ𝑐𝑖0ℓ2exp (−ℎℓ) (33) Where 𝐶ℎ is hydration constant, ℓ is the decay length.
Breakup frequency
The breakup frequency including the fractal dimension can expressed by Equation (34) [37]. The breakup frequency depends on the shear rate and the size of the aggregate. Large aggregates are more borne to breakup compared to smaller ones.
𝑏(𝐿𝑖) = 𝑐𝐺5/2(𝐿𝑖 )3−2𝐷𝑓/3 (34) 𝐿0
Where G is the shear rate, c is a fitting parameter that depends on the strength of the aggregate.
Fragment Distribution
Uniform fragmentation distribution is used in this work, meaning that all possibilities are equally probable [37].
𝐷𝑓−1
𝑎(𝐿𝑖, 𝐿𝑗) = 2𝐷𝑓𝐿𝑖
𝐷𝑓 , 𝐿𝑖< 𝐿𝑗 (35)
and the integrated adjustable daughter distribution function can be written as 𝐿𝑗 𝑘/𝑝 2𝐷𝑓 𝑘/𝑝+ 𝐷𝑓 (𝑘/𝑝) = 𝐿𝑖 , 𝐿𝑖< 𝐿𝑗 (36) 𝑎̅(𝐿𝑖, 𝐿𝑗)
Viscosity Model
Modified effective-medium theory can be effectively used to model the viscosity evolution of aggregating dispersions and predicts the initiation of gelation [58, 59].
−𝜑𝑚[𝜇] 2−𝑘0𝜑𝑚 𝜑
1 − (37) 𝜑𝑚 1 −
𝜇= 𝜇0 [ ]
(𝑘0𝜑𝑚−1)𝜑 𝜑𝑚 Where 𝜑 is the particles/aggregates volume fraction and 𝜑𝑚is the maximum packing factor. Intrinsic viscosity [𝜇] = 2.5 . For 𝐷𝑓= 3 , 𝜑= 𝑘𝑉𝑚3 . Where 𝑘𝑉 is the
2𝑘2 volumetric shape factor.Crowding factor 𝑘0 =
[𝜇] −[𝜇]. 𝑘0 is a function of shear rate (𝐺), and the exact relationship between 𝑘0 and 𝐺 is a function of the surface properties of the colloidal particles and the electrolyte concentration. However, in this study 𝑘2 is assumed between 5.2 −6.2 from low to high shear rate. Hence 𝑘0
0 = 3.05 at low shear rate and 𝑘0 ∞= 1.7 at high shear limit. The effect of shear 𝑘00−𝑘0∞ rate can be calculated as the following: 𝑘0 = 𝑘0
1+𝑃𝑒0.35.
∞+
3𝜋𝜇𝐺𝑅𝐻,𝑖𝑅𝐻,𝑗(𝑅𝐻,𝑖+𝑅𝐻,𝑗) Where 𝑃𝑒=
2𝑘𝐵𝑇 and Hydrodynamic
𝑚3 𝑚2 radius, 𝑅𝐻,𝑖=
Numerical Solution
The mathematical model presented in the previous sections is solved numerically to find the evolution of the moments and the viscosity as the following: 1. Knowing the volume fraction of the particles in the initial dispersion and assuming the initial particles has an average size of 150 nm, we can calculate the number of the particles and number density function at the initial conditions.
2. Using wheeler algorithm, the weight and abscissas of the initial moments can be calculated [60]. For more details about wheeler algorithm, readers are referred to Marchisio and Fox.
3. Using the weight and abscissas of the initial moments, the initial source/sink term is then calculated.
4. Sweeping the time steps
4.1. Using initial source/sink term, the moments can be updated using backward Euler time discretization scheme.
4.2. Feeding the updated moments into wheeler algorithm, the updated weights and abscissae’s can be calculated.
4.3. Using the updated the weights and abscissae’s, the source/sink term for the next time step is calculated.
4.4. Using the updated moments, the new viscosity can be calculated.
5. Repeat step 4 and end the simulation when the total time of simulation is reached.
Results and Discussion
The mathematical model presented in this paper is used to study the aggregation and gelation of fumed silica nanoparticles compared to colloidal silica nanoparticles. Several hypothetical cases were run to compare the kinetics of aggregation of both silica nanoparticles at comparable conditions. Modified effective-medium theory is used for calculation of viscosity evolution with aggregation. Several experimental studies show that the maximum packing factor (𝜑𝑚) for fumed silica is ~0.20- 0.3 while for colloidal silica it’s ~ 0.7 [61, 62]. For colloidal silica, the value of the maximum packing factor (𝜑𝑚) is close to the theoretical value of 0.74 for a close packed array of same size spheres. While for fumed silica, 𝜑𝑚 is much smaller due to the fractal structures that prevent tight packing of the primary particles. Two different regimes of aggregation are identified; diffusion limited aggregation (DLCA), and reaction limited aggregation (RLCA) [63]. The network structure of DLCA is more open (𝐷𝑓= 1.8) while that for RLCA is more close and compact ( 𝐷𝑓= 2.2 ) [9]. However, in this study, the fractal dimension is assumed to be 3. In this case, the conservation of mass per unit volume can be verified for 𝑘= 𝐷𝑓= 3. In this section, the simulation results for fumed silica and colloidal silica nanoparticles are presented at different electrolyte concentration represented by the collision efficiency as calculated from Equation (24).
Fumed Silica
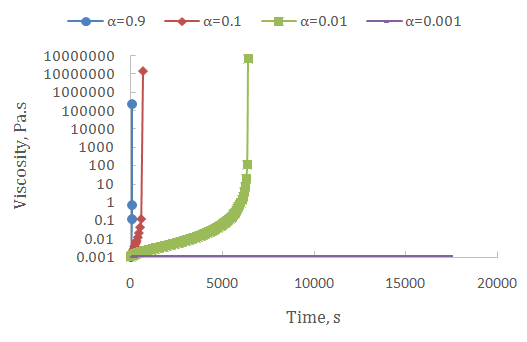
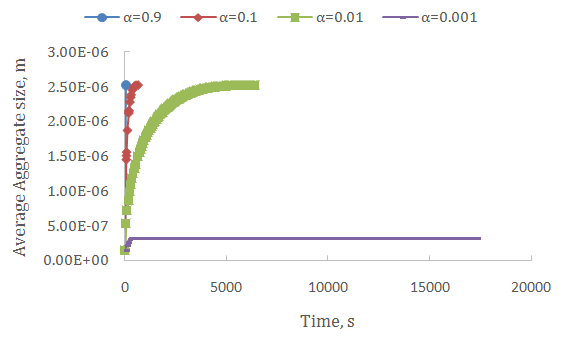
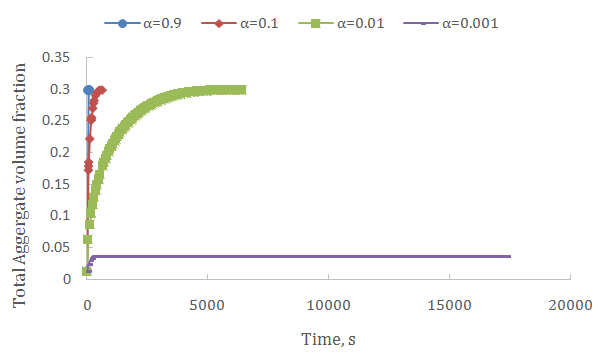
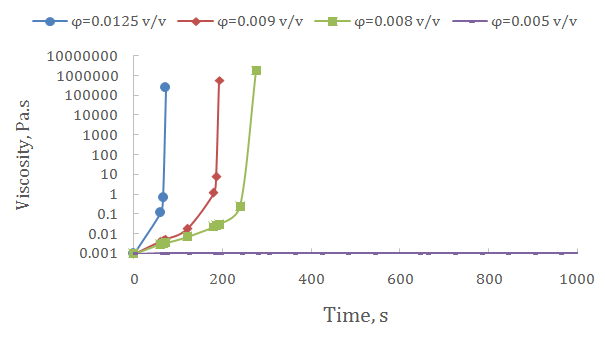
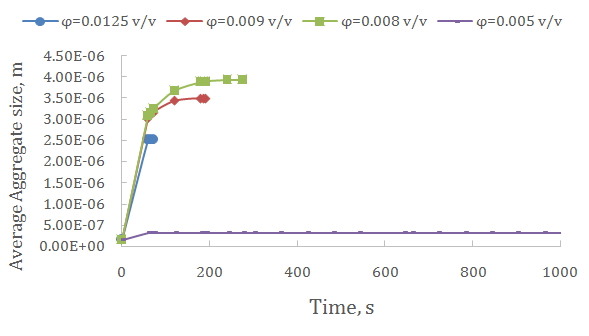
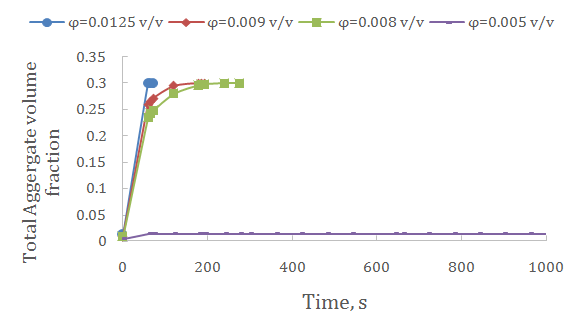
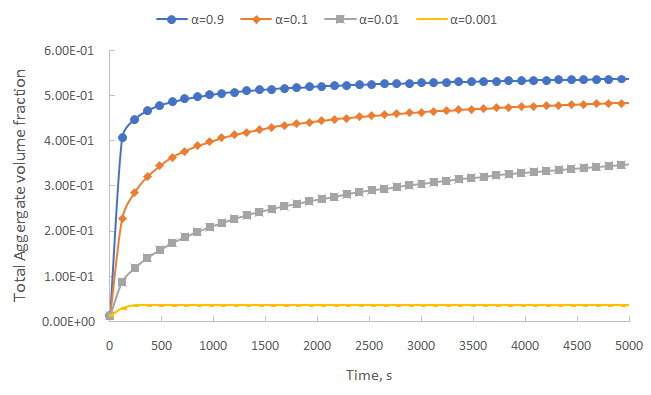
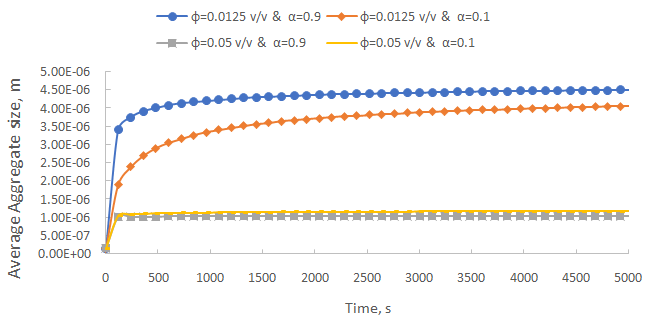
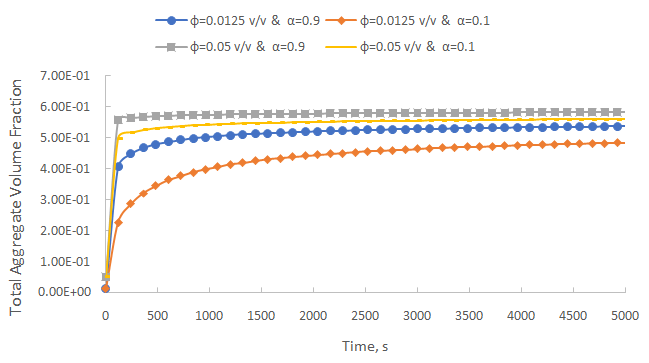
Fumed silica is aggregates of spherical particles fused together on the flame [61]. In this study, it’s assumed that the maximum packing factor (𝜑𝑚) for fumed silica is ~0.3 that is close to the value calculated from aggregation experiments of fumed silica by Smith & Zukoski [61]. The effect of collision efficiency representing different salt concentration is presented in Figure 1-4 for 𝐷𝑓= 3 and 1.25 vol% of fumed silica nanoparticles dispersion. With increasing the salt concentration (i.e. increasing collision efficiency), the gelation time (represented by sharp increase in viscosity) decreases significantly. At low collision efficiency, the gel cannot be formed. This can be explained that at low electrolyte concentration, the electrostatic repulsion between particles is significantly high [51, 64]. This high repulsion forces between particles can prevent the particles approaching each other and maintain the dispersion stability. Figure 2 shows the evolution of aggregate size with time. The aggregate size reaches a stable plateau once gelation is triggered. According to Equation (22), collision frequency depends on the aggregate size and viscosity. Once the effective volume fraction of aggregates reaches 𝜑𝑚, the gel network spans the whole space and the viscosity increases sharply. Hence, the collision frequency will be reduced significantly, and no further aggregation would occur. Figure 4-2 also shows that at low collision efficiency, the aggregate size does not change indicating that the dispersion is highly stable against aggregation. Figure 4-3 shows that volume fraction of the aggregates grows monotonically till it reaches the maximum packing factor beyond which there is no further aggregation and no further increase in volume of the aggregates. The increase of the volume with time is due to the fractal nature of the aggregates. However, the total mass of the aggregates is conserved. This can be checked that the moment at 𝑘= 𝐷𝑓 representing the total mass of the aggregates is constant. Initial concentration of nanoparticles in the dispersion is one of the key factors that control aggregation and gelation. Smith & Zukoski [7] shows that there is a critical concentration of fumed silica nanoparticles below which the gel network cannot be formed [7]. Herein, the study of aggregation and viscosity evolution with time is presented at different concentrations of fumed silica nanoparticles. Figure 4 shows that at concentration as low as 0.5 vol% the gel cannot be formed. Also, Figures 5 & 6 shows that there is a slight increase in the mean aggregate size and the volume fraction at low concentration, respectively. With increasing the concentration of nanoparticles, the gel network starts to form at 0.8 vol% of fumed silica nanoparticles. Above this critical concentration, the viscosity increases much further, and the gelation decreases significantly with increasing the concentration of fumed silica (Figure 4). However, Figure 5 shows that with increasing the concentration above the critical point, the aggregates size decreases significantly. This can be explained that at low concentration the aggregates size needs to grow greatly before it could form the gel network. While at high concentration, the particles are much closer together that larger number of moderate aggregate size can be formed initially before they can interconnect together to form the gel network. This explanation is supported by Figure 6 which shows that high concentration of silica nanoparticles, the volume of aggregates reaches the maximum packing factor at significantly shorter time.
$$ \text{suspension with } D _ {f} = 3 \text{ at different initial concentration.} $$
Colloidal Silica
Unlike fumed silica, colloidal silica is a single spherical particle [62]. In this study, it’s assumed that the maximum packing factor (𝜑𝑚) for colloidal silica is ~0.7. This value is close to the theoretically calculated value for packing of spheres ~ 0.74. Here, we modeled the aggregation and gelation of colloidal silica at similar conditions that presented in the previous section for fumed silica nanoparticles. The fractal dimension of the aggregates is also assumed to be constant and equal to 3. The effect of collision efficiency representing different salt concentration is presented in Figure 7 for colloidal silica nanoparticles concentration of 1.25 vol%. With increasing the salt concentration (i.e. increasing collision efficiency), the viscosity of the dispersion increases significantly. Figure 6 shows the evolution of aggregate size with time. At very low collision efficiency, the viscosity does have much increase beyond the initial viscosity of the stable dispersion. Comparing Figure 7 to Figure 1, colloidal silica does not form the gel network as in the case of fumed silica at 1.25 vol%. The aggregation and the crowing of the dispersion increases the viscosity slowly. However, this low concentration is not enough to form the gel network. Chen [62] shows that colloidal silica can form the gel network at concentration as high as 30 vol% [62]. Figure 8 shows that with increasing the collision frequency the aggregates size increases significantly. However, due to low concentration to form the gel network, the aggregate increases significantly as compared to the fumed silica nanoparticles in Figure 2. The aggregate size plateau explains that there is not further aggregation due to large size of the aggregates and hence the lower the collision frequency. This is also affirmed by Figure 9 that shows that the volume fraction of the aggregates no longer increases after a certain time.
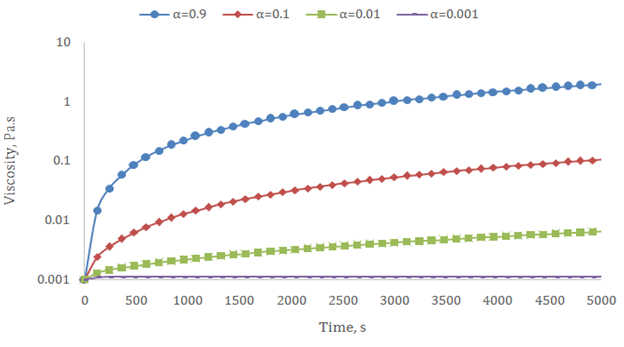
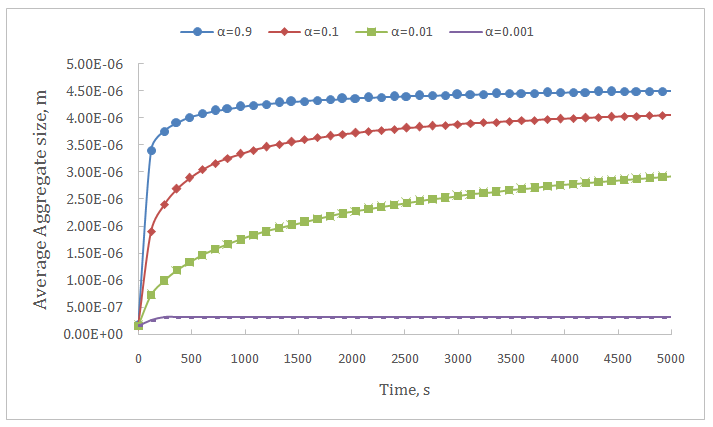
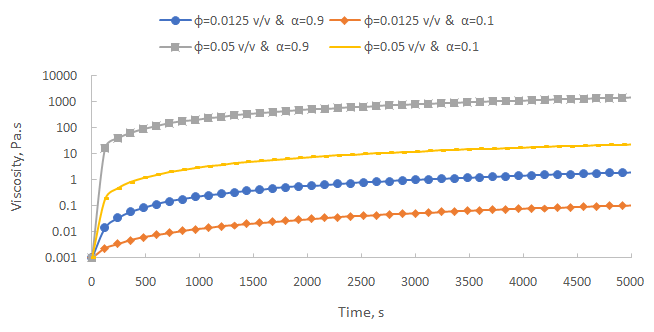
Figure 6: Aggregate volume fraction evolution with time for colloidal silica suspension with 𝐷𝑓= 3 at different collision efficiency. Herein, the effect of colloidal silica concentration is studied at two different collision efficiencies. At concentration of 5 vol%, the viscosity increases significantly compared to 1.25 vol%. However, 5 vol% is not enough to form the gel network as explained earlier. Figure 10 shows that regardless of the collision efficiency, increases the viscosity few orders of magnitude. This is affirmed by Figure 12 that shows that the volume fraction of the aggregates increases significantly with increasing the concentration of the nanoparticles. However, Figure 11 shows that the aggregate size decreases significantly with increasing the concentration of nanoparticles. This is consistent with the results shown in Figure 10 & Figure 12. With increasing the concentration, the number of initial particles is increases that form aggregates with the nearest particles or aggregates. Also as the viscosity increases significantly and the collision frequency decrease consequently. This means that we would have larger number of aggregates with smaller size than in the case of low concentration.
Conclusion
This study shows that the population balance equation and the quadrature method of moments along with the effective medium theory can be used to model the aggregation and in-situ at different conditions of salinity and concentration. The model developed in this study is used to compare between the kinetics of aggregation and gelation of fumed silica and colloidal silica nanoparticles at the same conditions. The case studies presented show that unique behavior of fumed silica over colloidal silica nanoparticles for forming a gel network a significantly low concentration. This is basically due to the fractal structure of the fumed silica nanoparticles that has higher effective volume than the spherical particles of colloidal silica of the same size. The model also shows that there is a critical concentration of salt and nanoparticles above which the viscosity increase, and the gel network can be formed [65]. The model developed in this study can be coupled with a transport model to simulate nanoparticles transport aggregation and sin-situ gelation in porous media.
Acknowledgement
This work is supported by the Abu Dhabi National Oil Company (ADNOC) [grant number 880005].
Nomenclature
𝐴𝐻 Hamaker constant
𝑎(𝐿, 𝜆) fragment distribution function for the diameter-based PBE
𝑎(𝑣, 𝑢) fragment distribution function for the volume-based PBE
𝑏(𝐿) diameter based breakage kernel 𝑏(𝑢) volume-based breakage kernel 𝑐 adjustable parameter in the breakage kernel model 𝐵𝑎(𝐿; 𝑡) birth term due to aggregation in the diameter-based PBE 𝐵𝑏(𝐿; 𝑡) birth term due to breakage in the diameter- based PBE 𝐵𝑎(𝑣;𝑡) birth term due to aggregation in the volume-based PBE 𝐵𝑎(𝑣;𝑡) birth term due to aggregation in the volume-based PBE 𝐷𝑎(𝐿; 𝑡) death term due to aggregation in the diameter -based PBE 𝐷𝑏(𝐿; 𝑡) death term due to breakage in the diameter -based PBE 𝐷𝑎(𝑣; 𝑡) death term due to aggregation in the volume-based PBE 𝐷𝑏(𝑣;𝑡) death term due to breakage in the volume- based PBE 𝐷𝑓 fractal dimension of the aggregates 𝑒 Electronic charge 𝑓(𝜅𝑳𝒊) Henry’s function 𝐺 Shear rate 𝑘𝐵 Boltzmann constant ℎ Separation distance between particles 𝐿𝑖 nodes in the Gaussian quadrature approximation 𝐿0 Initial size of the nanoparticles 𝑚𝑘 the kth order moment 𝑁𝑞 number of quadrature that represent the number of size classes of the aggregates 𝑛(𝐿; 𝑡) diameter-based number density function 𝑛(𝑣; 𝑡) volume-based number density function 𝑝𝐻 pH of the solution 𝑝𝐻𝐼𝐸𝑃 isoelectric point of the nanoparticles 𝑠1, 𝑠2 slopes for the zeta potential function of pH and temperature 𝑇 temperature of the dispersion 𝑇0 initial temperature of the dispersion 𝑊 stability ratio 𝛼(𝐿, 𝜆) collision efficiency of particles of diameter 𝐿 𝑎𝑛𝑑 𝜆 𝛽(𝐿, 𝜆) collision frequency of particles of diameter 𝐿 𝑎𝑛𝑑 𝜆 𝜔𝑖 weight (also the characteristic number density) corresponding to 𝐿𝑖 𝜒(𝜎) hydrodynamic effect 𝜙𝑇 total electrostatic interaction between particles at separation distance ℎ 𝜙𝑣𝑑𝑤 Van der Waals interactions 𝜙𝐸𝐷𝐿 Electric double layer repulsion 𝜙𝐻𝑌𝐷 Hydration force 𝜎 function of separation distance and particle size 𝜁 zeta potential 𝜅 Debye length 𝑧𝑖 valence number of the ion 𝑣𝜁 Constant for temperature effect on zeta potential 𝜀0 vacuum permittivity 𝜀𝑝 dielectric constant of the particles 𝜀𝑐 dielectric constant of the continuous phase ℎP Planck constant 𝜐𝑒 characteristic adsorption frequency 𝑛𝑝 refractive index of the particles 𝑛𝑐 refractive index of the continuous phase 𝑐𝑖0 bulk concentration of ion species i 𝑁𝐴 Avogadro number 𝐶ℎ hydration constant ℓ decay length of the hydration force 𝜇 viscosity of aggregating dispersions 𝜇0 Initial viscosity of the continuous phase [𝜇] intrinsic viscosity 𝜑 particles/aggregates volume fraction 𝜑𝑚 maximum packing fraction 𝑘0 Crowding factor 𝑘2 second virial coefficient
0 Crowding factor at low shear rate 𝑘0 ∞ Crowding factor at high shear rate 𝑘0 𝑃𝑒 Peclet number of the aggregates 𝑅𝐻,𝑖 Hydrodynamic radius of the aggregates
References
-
Liu S (1996) Suspensions: fundamentals and applications in the petroleum industry. Advances in Chemistry, American Chemical Society, Washington, DC, pp: 800.
-
Huang J, Al Mohsin A, Bataweel, M, Karadkar P, Wengang Li, et al. (2017) Systematic Approach to Develop a Colloidal Silica Based Gel System for Water Shut-Off. Society of Petroleum Engineers, SPE Middle East Oil & Gas Show and Conference, Kingdom of Bahrain.
-
Metin CO, Rankin KM, Nguyen QP (2014) Phase behavior and rheological characterization of silica nanoparticle gel. Applied Nanoscience 4(1): 93-101.
-
Jurinak JJ, Summers LE (1991) Oilfield Applications of Colloidal Silica Gel. Society of Petroleum Engineers, SPE Production Engineering 6(4).
-
Iler RK (1979) The chemistry of silica: solubility, polymerization, colloid and surface properties, and biochemistry of silica. New York, willey, pp: 896.
-
Gun'ko VM, Zarko VI, Leboda R, Chibowskic E (2001) Aqueous suspension of fumed oxides: particle size distribution and zeta potential. Advances in Colloid and Interface Science 91(1): 1-112.
-
Smith WE, Zukoski CF (2006) Aggregation and gelation kinetics of fumed silica–ethanol suspensions. Journal of Colloid and Interface Science 304 (2): 359- 369.
-
Elimelech M, Gregory J, Jia X, (2013) Particle deposition and aggregation. In: Williams RA (Ed.), measurement, modelling and simulation, 1st (edn), Butterworth-Heinemann, pp: 458.
-
Russel WB, Saville DA, Schowalter WR (1989) Colloidal dispersions. Cambridge university press.
-
Raghavan SR, Walls HJ, Khan SA (2000) Rheology of Silica Dispersions in Organic Liquids: New Evidence for Solvation Forces Dictated by Hydrogen Bonding. Langmuir 16(21): 7920-7930.
-
Wei W, Cai J, Hu X, Qi Han, Liu S, et al. (2016) Fractal analysis of the effect of particle aggregation distribution on thermal conductivity of nanofluids. Physics Letters A 380(37): 2953-2956.
-
Cai J, Hu X, Xiao B, Zhou Y, Wei W (2017) Recent developments on fractal-based approaches to nanofluids and nanoparticle aggregation. International Journal of Heat and Mass Transfer 105: 623-637.
-
Lee DG, Bonner JS, Garton LS, Andrew N S Ernest, Robin L Autenrieth (2000) Modeling coagulation kinetics incorporating fractal theories: a fractal rectilinear approach. Water Research 34(7): 1987- 2000.
-
Kawaguchi M (2017) Dispersion stabilities and rheological properties of fumed silica suspensions. Journal of Dispersion Science and Technology 38 (5): 642-660.
-
Kawaguchi M, Mizutani A, Matsushita Y, Tadaya Kato (1996) Molecular Weight Dependence of Structures and Rheological Properties for Fumed Silica Suspensions in Polystyrene Solutions. Langmuir 12(26): 6179-6183.
-
Kawaguchi M, Yamamoto T, Kato T (1996) Rheological Studies of Hydrophilic and Hydrophobic Silica Suspensions in the Presence of Adsorbed Poly (N-isopropylacrylamide). Langmuir 12(26): 6184- 6187.
-
Amiri A, Øye G, Sjöblom J (2011) Temperature and pressure effects on stability and gelation properties of silica suspensions. Colloids and Surfaces A: Physicochemical and Engineering Aspects 378(1–3): 14-21.
-
Amiri A, Øye G, Sjöblom J (2009) Influence of pH, high salinity and particle concentration on stability and rheological properties of aqueous suspensions of fumed silica. Colloids and Surfaces A: Physicochemical and Engineering Aspects 349(1–3): 43-54.
-
Hiemenz PC (1986) Principles of colloid and surface chemistry. Vol (188), M Dekker, New York.
-
Israelachvili JN (2011) Intermolecular and Surface Forces. 3rd (edn), Boston, Academic Press, pp: 704.
-
Adamson AW, Gast AP (1967) Physical chemistry of surfaces. Interscience, New York.
-
Yotsumoto H, Yoon RH (1993) Application of Extended DLVO Theory. Journal of Colloid and Interface Science 157(2): 434-441.
-
Van der Linden M, Conchúir BO, Spigone E, Niranjan A, Zaccone A, et al. (2015) Microscopic Origin of the Hofmeister Effect in Gelation Kinetics of Colloidal Silica. J Phys Chem Lett 6 (15): 2881-2887.
-
Okazaki K, Kawaguchi M (2008) Influence of Monovalent Electrolytes on Rheological Properties of Gelled Colloidal Silica Suspensions. Journal of Dispersion Science and Technology 29(1): 77-82.
-
Weston JS, Venkataramani D, Aichele CP, Grady BP, Harwell J, et al. (2014) Pseudosolid, Shear-Thinning Gel Formation in Binary Dispersions of Metal Oxide Nanoparticles at Low Volume Fractions. Langmuir 30 (49): 14982-14990.
-
Dickinson E (2000) Structure and Rheology of Simulated Gels Formed from Aggregated Colloidal Particles. Journal of Colloid and Interface Science 225 (1): 2-15.
-
Family F, Landau DP (1984) Kinetics of aggregation and gelation. 1st (edn), Elsevier, pp: 294.
-
Almdal K, Dyre J, Hvidt S, Kramer O (1993) Towards a phenomenological definition of the term ‘gel’. Polymer Gels and Networks 1(1): 5-17.
-
Raghavan, SR, Khan SA (1995) Shear‐induced microstructural changes in flocculated suspensions of fumed silica. Journal of Rheology 39(6): 1311-1325.
-
Dolz M, González F, Delegido J, Hernández MJ, Pellicer J (2000) A time-dependent expression for thixotropic areas. Application to Aerosil 200 hydrogels. J Pharm Sci 89 (6): 790-797.
-
Marchisio DL, Fox RO (2013) Computational models for polydisperse particulate and multiphase systems. Cambridge University Press.
-
Ramkrishna D (2000) Population balances: Theory and applications to particulate systems in engineering. 1st (edn), Academic press pp: 355.
-
Raychoudhury T, Tufenkji N, Ghoshal S (2012) Aggregation and deposition kinetics of carboxymethyl cellulose-modified zero-valent iron nanoparticles in porous media. Water Research 46(6): 1735-1744.
-
Chatterjee J, Gupta SK (2009) An Agglomeration- Based Model for Colloid Filtration. Environmental Science & Technology 43(10): 3694-3699.
-
Andrew NE, James SB, Robin LA (1995) Determination of Particle Collision Efficiencies for Flocculent Transport Models. Journal of Environmental Engineering 121(4): 320-329.
-
Taghavy A, Pennell KD, Abriola LM (2015) Modeling coupled nanoparticle aggregation and transport in porous media: A Lagrangian approach. Journal of Contaminant Hydrology 172: 48-60.
-
Vlieghe M, Coufort Saudejaud C, Liné A, Frances C (2016) QMOM-based population balance model involving a fractal dimension for the flocculation of latex particles. Chemical Engineering Science155: 65- 82.
-
Yuan C, Fox RO (2011) Conditional quadrature method of moments for kinetic equations. Journal of Computational Physics 230(22): 8216-8246.
-
Su J, Gu Z, Li Y, Feng S, X Yun Xu (2008) An adaptive direct quadrature method of moment for population balance equations. AIChE Journal 54(11): 2872-2887.
-
Su J, Gu Z, Li Y, Feng S, X Yun Xu (2007) Solution of population balance equation using quadrature method of moments with an adjustable factor. Chemical Engineering Science 62(21): 5897-5911.
-
McGraw R (1997) Description of Aerosol Dynamics by the Quadrature Method of Moments. Aerosol Science and Technology 27(2): 255-265.
-
Grosch R, Briesen H, Marquardt W, Wulkow M (2007) Generalization and numerical investigation of QMOM. AIChE Journal 53(1): 207-227.
-
Marchisio DL, Vigil RD, Fox RO (2003) Quadrature method of moments for aggregation–breakage processes. Journal of Colloid and Interface Science 258(2): 322-334.
-
Marchisio DL, Pikturna JT, Fox RO, R Dennis Vigil, Antonello A Barresi (2003) Quadrature method of moments for population-balance equations. AIChE Journal 49 (5): 1266-1276.
-
Marchisio LD, Dennis Vigil R, O Fox R (2003) Implementation of the quadrature method of moments in CFD codes for aggregation–breakage problems. Chemical Engineering Science 58(15): 3337-3351.
-
Shen X, Maa JPY (2015) Modeling floc size distribution of suspended cohesive sediments using quadrature method of moments. Marine Geology 359: 106-119.
-
Shen X, Maa JPY (2016) Numerical simulations of particle size distributions: Comparison with analytical solutions and kaolinite flocculation experiments. Marine Geology 379: 84-99.
-
McGraw R, Saunders JH (1984) A Condensation Feedback Mechanism for Oscillatory Nucleation and Growth. Aerosol Science and Technology 3(4): 367- 380.
-
Gautschi W (1968) Construction of Gauss-Christoffel quadrature formulas. Math Comp 22(102): 251-270.
-
Thomas DN, Judd SJ, Fawcett N (1999) Flocculation modelling: a review. Water Research 33(7): 1579- 1592.
-
Abdelfatah E, Kang K, Pournik M, Shiau B, Harwell J (2017) Study of Nanoparticle Retention in Porous Media: A Perfect Sink Model. 19th European Symposium on Improved Oil Recovery, Stavanger, Norway.
-
Ohshima H (1994) A Simple Expression for Henry's Function for the Retardation Effect in Electrophoresis of Spherical Colloidal Particles. Journal of Colloid and Interface Science 168(1): 269-271.
-
Berg JC (2010) An introduction to interfaces & colloids: the bridge to nanoscience, World Scientific, New Jersey.
-
Hogg R, Healy TW, Fuerstenau DW (1966) Mutual coagulation of colloidal dispersions. Transactions of the Faraday Society 62: 1638-1651.
-
Pashley RM, Israelachvili JN 1(984) Molecular layering of water in thin films between mica surfaces and its relation to hydration forces. Journal of colloid and interface science 101(2): 511-523.
-
Binks BP, Lumsdon SO (1999) Stability of oil-in-water emulsions stabilised by silica particles. Physical Chemistry Chemical Physics 1(12): 3007-3016.
-
Chapel JP (1994) Electrolyte Species Dependent Hydration Forces between Silica Surfaces. Langmuir 10 (11): 4237-4243.
-
Lattuada M, Zaccone A, Wu H, Morbidelli M (2016) Population-balance description of shear-induced clustering, gelation and suspension viscosity in sheared DLVO colloids. Soft Matter 12(24): 5313- 5324.
-
Takamura K, Ven TGM (2010) Comparisons of modified effective medium theory with experimental data on shear thinning of concentrated latex dispersions. Journal of Rheology 54(1): 1-26.
-
Wheeler JC (1974) Modified moments and Gaussian quadratures. Rocky Mountain J Math 4(2): 287-296.
-
Smith WE, Zukoski CF (2004) Flow properties of hard structured particle suspensions. Journal of Rheology 48(6): 1375-1388.
-
Chen S, Øye G, Sjöblom J (2005) Rheological Properties of Aqueous Silica Particle Suspensions. Journal of Dispersion Science and Technology 26(4): 495-501.
-
Sefcik J, Grass R, Sandkühler P, Morbidelli M (2005) Kinetics of Aggregation and Gelation in Colloidal Dispersions. Chemical Engineering Research and Design 83 (7): 926-932.
-
Abdelfatah E, Kang K, Pournik M, Shiau B, Harwell J, et al. (2017) Study of Nanoparticle Adsorption and Release in Porous Media Based on the DLVO Theory. Society of Petroleum Engineers, SPE Latin America and Caribbean Petroleum Engineering Conference, Buenos Aires, Argentina.
-
Hulburt HM, Katz S (1964) Some problems in particle technology. Chemical Engineering Science 19(8): 555- 574.
- Nigeria’s Vulnerability in the Face of Global Energy Policy
- A Simulation Study of Investigation of Optimum Oil Production Performance by Applying Various Gas Injection Methods in Oil Reservoir
- Characterization of Permo-Triassic Reservoirs through Thermal Maturity Assessment of Westphalian Source Rocks in the Cheshire Basin
- Influence of Microwax on the Rheological and Thermal Behaviour of a Wax Crude Oil
- Real-Time Monitoring and Performance Optimization of Steam Injection in Heavy Oil Reservoirs Using Fiber Optic Sensing and Integrated Predictive Simulation Models
- Rapid On-Site Determination of the Total Petroleum Hydrocarbon Content of Soils by Handheld Fourier Transform Near-Infrared Spectroscopy: Development of a Global, Site- and Scanner- Independent Calibration Model