Rapid On-Site Determination of the Total Petroleum Hydrocarbon Content of Soils by Handheld Fourier Transform Near-Infrared Spectroscopy: Development of a Global, Site- and Scanner- Independent Calibration Model
In a previous publication it was demonstrated that hand-held near-infrared (NIR) spectroscopy is an excellent method for the rapid, quantitative determination of total petroleum hydrocarbons (TPHs) in soils and thus contributes significantly to rapid decisions in environmental site assessment projects and exploration work [1]. The soils investigated for these previous investigations were collected at two different US sites with TPH reference values in the range of 350-30,000 ppm and the Locally Weighted-Partial Least Squares (LW-PLS) regression method was applied to develop a calibration model for the prediction of site-independent, unknown samples. Root-Mean-Square errors for calibration/cross validation (RMSEC/ RMSECV) of 687/959 ppm TPH were obtained and the average absolute prediction error of test samples not included in the calibration was 703 ppm TPH. The challenges to the objectives of the present work were twofold: 1. To extend the calibration model from a geographically restricted to a globally applicable one and 2. The calibration model should become independent of hardware fluctuations in the production of the NIR scanner used. To achieve these goals, a total of 314 samples from six different sites in three different countries/continents (USA, Kuwait, Australia) with TPH levels between 6 - 39,000 ppm were analysed. In order to reach independence from the geographical origin of the samples, the LW-PLS algorithm was applied for the calibration model development in analogy to the previous publication. To our knowledge, hardware production variations of the NIR scanner used were compensated for the first time in this study by using eight auxiliary scanners of different serial numbers for the additional measurement of selected, representative calibration and test spectra (> 40% of the total number of spectra). The final calibration based on 412 calibration spectra (286/126 measured with the master/auxiliary scanners) and 46 test spectra (28/18 measured on the master/auxiliary scanners) had RMSEC/RMSECV values of 1336/1983 ppm TPH and the average absolute prediction error of the test samples was 1424 ppm TPH. This promising result ensures that in future it will be possible to equip worldwide-distributed sites with different scanners and use a global master calibration for predicting new, unknown soil samples in any site with an average absolute prediction error < 1500 ppm TPH.
Abbreviations
TPH: Total Petroleum Hydrocarbon; NIR: Near-Infrared (Spectroscopy); MIR: Mid-Infrared (Spectroscopy); FT-NIR: Fourier Transform Near-Infrared; LW-PLS: Locally Weighted Partial Least Squares; GC-FID: Gas Chromatography–Flame Ionization Detection; RMSEC: Root Mean Square Error of Calibration; RMSECV: Root Mean Square Error of Cross Validation; RMSEP: Root Mean Square Error of Prediction; LVs: Latent Variables.
Synopsis
The described technique of handheld NIR spectroscopy allows the rapid, on-site determination of TPH in soil independent of the geographical location of the soil and the serial number of the specified NIR scanner with prediction errors < 1500 ppm.
Introduction
Despite extensive safety protocols, road transportation of hydrocarbon compounds can result in accidental spills, leading to terrestrial soil contamination [1, 2]. In such scenarios, a rapid, on-site method is critical to determine the extent of contamination, guide appropriate remediation strategies, and monitor their effectiveness [3]. Similarly, in remote exploration studies, rapid determination of the total petroleum hydrocarbon (TPH) content in soils is essential for evaluating the site’s environmental status and economic potential. However, traditional laboratory-based techniques—whether spectroscopic or chromatographic— are not suitable for these requirements due to several limitations.
Conventional chromatographic methods, while precise, are time-consuming, require elaborate sample preparation, depend on stationary lab infrastructure, and generate hazardous organic solvent waste. Likewise, even laboratory- based mid-infrared (MIR) and near-infrared (NIR) spectroscopy methods, which are capable of quantifying total carbon, nitrogen, moisture, and hydrocarbon contaminants [4, 5, 6, 7, 8, 9] without extraction, still necessitate the transport of soil samples to centralized facilities thereby introducing delays.
To overcome these constraints, feasibility studies have explored the use of portable MIR and NIR instruments for in-situ TPH quantification [1, 10, 11]. Compared to MIR spectroscopy, recent technological advances have significantly improved the practicality of handheld NIR spectroscopy. Lightweight (<500 g), cost-effective devices now offer optimized ergonomics and operational simplicity, making them especially attractive for field deployment [12]. Importantly, NIR spectroscopy is less susceptible to spectral interference from water than MIR, where hydrocarbon- specific ν(CH) stretching vibrations overlap strongly with broad ν(OH) water absorptions—an issue that complicates quantitative MIR-based TPH analysis in moist soil samples.
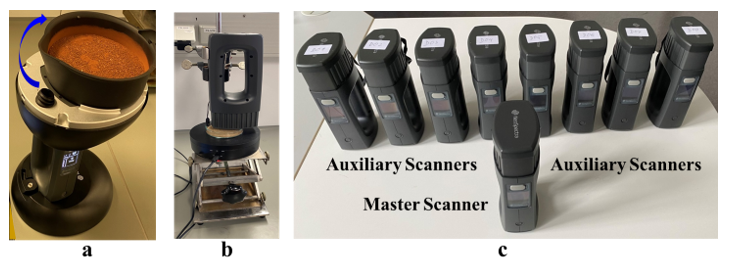
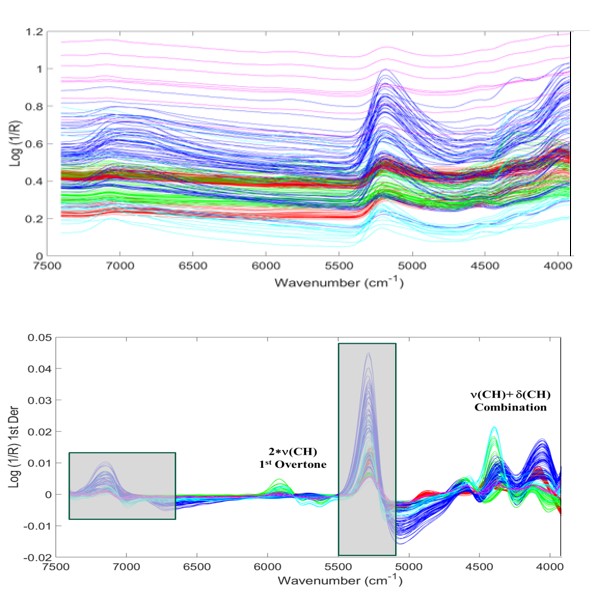
In the present study, we employ NeoSpectra MEMS- based FT-NIR instruments [13] equipped with a single-chip Michelson interferometer in combination with a rotating- dish sampling accessory. This configuration significantly facilitates sample presentation and helps average out soil heterogeneity. The spectrometer spans a broad wavelength range (1350–2500 nm; 7400–4000 cm-1), encompassing key hydrocarbon absorption bands such as the ν(CH2/ CH3) + δ(CH2/CH3) combination bands (4500–4000 cm-1), first overtones of 2ν(CH/CH2/CH3) (6200–5400 cm-1), and 2ν(CH2/CH3) + δ(CH2/CH3) combination bands (7500–7000 cm-1) [14]. The latter region was excluded from calibration due to interference from the first overtone of the 2ν(OH) water absorption.
To develop a robust, site-independent calibration model, the locally weighted partial least squares (LW-PLS) approach was applied, as described in previous studies [15, 16] and illustrated for different agronomic data sets by Lesnoff, et al. [17]. To minimize the impact of device-specific variations in hardware production on model performance, we integrated spectra from eight auxiliary scanners in addition to the master unit. These spectra were used for both calibration and validation, ensuring broader model applicability and prediction accuracy across different instruments.
Materials and Methods
Materials
For the development of the LW-PLS calibration model 314 soil samples from six different globally distributed sites (site#1/AL (98), site#2/GU (64), site#3/MR (9), site#4/LT (32), site#5/KU (23), and site#6/AU (88) were supplied with TPH reference values ranging from 6 – 39,000 ppm by Chevron Technical Center (Richmond, CA, USA). All soil samples have been homogenized to 2 mm by grinding or sieving and their TPH reference values were determined by GC-FID analysis using a commercial laboratory method (US-EPA 8015B).
NIR Instrumentation and Spectra Measurement
Diffuse reflection NIR spectra of each sample were measured at laboratory temperature of 23°C (± 1°C) with the NIR scanner (NeoSpectra, Si-Ware Systems, Cairo, Egypt). Depending on the available amount of sample, the measurements were either made bottom-up with the NeoSpectra rotating-dish accessory (Figure 1a) or top-down by placing the sample in a Petri dish on a table rotating during the measurement (Figure 1b). The specific scanning parameters were 10 s, Happ−Genzel apodization, and 32 K FFT points. The reference measurements were conducted with a 99% Spectralon reflection standard (Labsphere Inc., North Sutton, USA). Due to the heterogeneity of the investigated samples, triplicate (repacks) spectra were measured for each sample and averaged before further processing. In order to compensate hardware variations in the scanner production, selected samples of the different sites were additionally measured with eight auxiliary scanners (Figure 1c) by using the same scanning parameters (144 spectra). The total spectra set (458) was finally split up into a calibration set (412) and a test set (46) for external validation.
Chemometric Software and Spectra Pretreatment
For the development of the LW-PLS calibration model the SOLO 9.2 (2025) software and the PLS Toolbox 8.6.2 (2021) (Eigenvector Research, Inc., Manson, WA 98831, USA) in combination with MatLab 9.0.0.341360 (R2016a) (The Mathworks Inc., Natick, MA, USA) was used. Before final processing the raw spectra were transferred from wavelength to wavenumbers and then baseline shifts and slope differences were corrected by the 1st derivative in combination with Savitzky Golay smoothing (9 data point window, polynomial of 3rd degree), because this pretreatment procedure provided the optimum calibration results. To exclude the interference of moisture variations in the soil samples, water-related wavenumber ranges (7400 –
6263 and 5500 – 4956 cm-1) were truncated. To optimize the calibration performance, 22 outliers were removed and a Venetian Blinds cross-validation [18] was applied for the development of the calibration model.
Results and Discussion
Calibration Spectra Set and Analysis of the LW- PLS Calibration Model
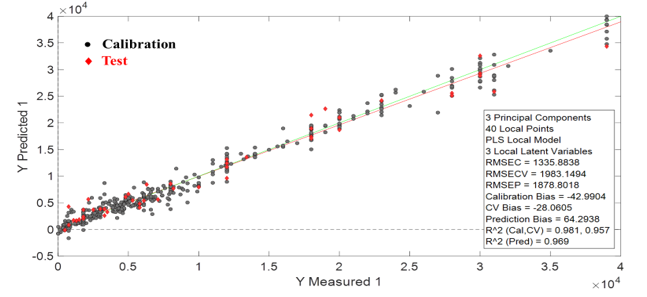
In Figure 2a and 2b the original and pretreated calibration spectra of all sites are shown. The gray-shaded areas in Figure 2(b) represent the truncation ranges to eliminate the interference of moisture variations. Figure 3 shows the Measured/Predicted plot of the generated LW-PLS
model with black and red symbols for calibration and test set, respectively. The insert box includes the most important calibration performance parameters: RMSEC/RMSECV/ RMSEP = 1336/1983/1879 ppm and R2CAL/CV/PRED = 0.981/0.957/0.969. A parameter that has a significant effect on the performance of a calibration model is the number of chosen latent variables (LVs) [18]. Fewer LVs lead to lower accuracy, though to more robust calibrations. Too many LVs frequently induce overfitting with only an apparent improvement of predictive ability.
(a)
(b) Figure 2: (a) Original (b) pretreated calibration spectra (after outlier removal) of all sites (the gray-shaded areas in (b) highlight the truncation ranges).
External Validation of the LW-PLS Calibration Model by Test Spectra
Considering the diverse soil compositions from globally distributed sites, a robust calibration was achieved using only three latent variables (LVs). This outcome is further supported by Table 1, which presents both the actual and predicted TPH (ppm) values for the test samples. Achieving an average absolute prediction error of 1424 ppm across 46 test samples demonstrates strong performance for a global, site- and scanner-independent calibration model.
| #Samples Scanner | Actual (ppm) | Pred (ppm) | Abs Error (ppm) | |
|---|---|---|---|---|
| T1 | D0 | 3300 | 3849 | 549 |
| T2 | D0 | 6300 | 8447 | 2147 |
| T3 | D0 | 8200 | 7685 | 515 |
| T4 | D0 | 1300 | 1660 | 360 |
| T5 | D0 | 1100 | 1726 | 626 |
| T6 | D0 | 480 | -107 | 587 |
| T7 | D0 | 18000 | 21464 | 3464 |
| T8 | D0 | 2500 | 3698 | 1198 |
| T9 | D0 | 13400 | 13569 | 169 |
| T10 | D0 | 1500 | 1851 | 351 |
| T11 | D0 | 5000 | 6651 | 1651 |
| T12 | D0 | 760 | 851 | 91 |
| T13 | D0 | 12000 | 11743 | 257 |
| T14 | D0 | 18000 | 17378 | 622 |
| T15 | D0 | 3500 | 3290 | 210 |
| T16 | D0 | 28000 | 25583 | 2417 |
| T17 | D0 | 20000 | 21002 | 1002 |
| T18 | D0 | 1800 | 2061 | 261 |
| T19 | D0 | 5300 | 5448 | 148 |
| T20 | D0 | 2150 | 5663 | 3513 |
| T21 | D0 | 4800 | 6113 | 1313 |
| T22 | D0 | 7100 | 5637 | 1463 |
| T23 | D0 | 10000 | 7951 | 2049 |
| T24 | D0 | 12000 | 12425 | 425 |
| T25 | D0 | 30000 | 32581 | 2581 |
| T26 | D0 | 19000 | 22648 | 3648 |
| T27 | D0 | 3300 | 2614 | 686 |
| T28 | D0 | 5800 | 4826 | 974 |
| T29 | D1 | 28000 | 25139 | 2861 |
| T30 | D1 | 12000 | 9628 | 2372 |
| T31 | D2 | 39000 | 34355 | 4645 |
| T32 | D2 | 1800 | 2374 | 574 |
| T33 | D3 | 1800 | 3697 | 1897 |
| T34 | D3 | 20000 | 18700 | 1300 |
| T35 | D4 | 5800 | 4117 | 1683 |
| T36 | D4 | 6100 | 5404 | 696 |
| T37 | D5 | 3000 | 3844 | 844 |
| T38 | D5 | 30000 | 29260 | 740 |
| T39 | D6 | 31000 | 25863 | 5137 |
| T40 | D6 | 8000 | 8578 | 578 |
| T41 | D7 | 12000 | 13138 | 1138 |
| T42 | D7 | 23000 | 24204 | 1204 |
| T43 | D7 | 30000 | 28863 | 1137 |
| T44 | D8 | 18000 | 17087 | 913 |
| T45 | D8 | 18000 | 18948 | 948 |
| T46 | D8 | 750 | 4289 | 3539 |
| Average 1424 |
Table 1: Compilation of the Actual/Predicted TPH (ppm) values of the 46 test samples and their absolute errors (D0: master scanne
Conclusions
In this work, the development of a site- and scanner-independent LW-PLS calibration model for the determination of Total Petroleum Hydrocarbons (TPH) in soil using a handheld NIR spectrometer has been successfully demonstrated. Site-independence was achieved by incorporating spectral data from samples collected at six geographically diverse sites across three continents into the calibration model. Furthermore, scanner-independence was ensured by replacing the conventional PLS algorithm with a locally weighted PLS (LW-PLS) approach and integrating spectra acquired from eight auxiliary scanners in addition to the master device.
This comprehensive strategy effectively addressed both sample variability and hardware-induced spectral variation, enabling the creation of a robust global calibration model. As a result, unknown soil samples can be accurately analyzed at any location, using different scanners, with an average absolute prediction error of less than 1500 ppm TPH.
From the perspective of international environmental regulations, this level of predictive accuracy is highly relevant. Regulatory thresholds for TPH in soil vary depending on jurisdiction, land use, and hydrocarbon fraction, but typical remediation or risk assessment trigger levels range from 100 to 3000 ppm. A prediction error of <1500 ppm is therefore well within an acceptable range for industrial applications and may also support preliminary screening in more sensitive residential or environmental settings.
These findings support the practical deployment of handheld NIR spectroscopy, enhanced by LW-PLS modeling, as a reliable and scalable tool for global soil contamination monitoring.
Funding
This research was funded by the Chevron Technology Center.
Conflict of Interest
The authors declare no competing financial interest.
Acknowledgements
The authors gratefully acknowledge the generous instrumental support from Si-Ware Systems, Heliopolis, Cairo, Egypt. The authors also acknowledge the Chevron Technology Center for providing the samples and giving permission to publish this article.
References
-
Miao T, Sihota N, Pfeifer F, McDaniel C, De Gea Neves M, et al. (2023) Rapid Determination of the Total Petroleum Hydrocarbon Content of Soils by Handheld Fourier Transform Near-Infrared Spectroscopy. Anal Chem 95(17): 6888-6893.
-
Agency for Toxic Substances and Disease Registry, ToxFAQsTM Information on Total Petroleum Hydrocarbons.
-
Balba MT, Al-Awadhi N, Al-Daher R (1998) Bioremediation of oil-contaminated soil: microbiological methods for feasibility assessment and field evaluation. J Microbiol Meth 32(2): 155-164.
-
Bachion de Santana F, Daly K (2022) A comparative study of MIR and NIR spectral models using ball-milled and sieved soil for the prediction of a range soil physical and chemical parameters. Spectrochimica Acta Part A: Molecular and Biomolecular Spectroscopy 279: 121441.
-
Vohra ST, Bucholtz F, Nau GM, Ewing KJ, Aggarwal ID (1996) Remote Detection of Trichloroethylene in Soil by a Fiber-Optic Infrared Reflectance Probe. Applied Spectroscopy 50(8): 985-990.
-
Hazel G, Bucholtz F, Aggarwal ID, Nau G, Ewing KJ (1997) Multivariate Analysis of Mid-IR FT-IR Spectra of Hydrocarbon-Contaminated Wet Soils. Applied Spectroscopy 51(7): 984-989.
-
Igne B, Reeves JB, McCarty G, Hively WD, Lund E, et al. (2010) Evaluation of Spectral Pretreatments, Partial Least Squares, Least Squares Support Vector Machines and Locally Weighted Regression for Quantitative Spectroscopic Analysis of Soils. Journal of Near Infrared Spectroscopy 18(3): 167-176.
-
Genot V, Colinet G, Bock L, Vanvyve D, Reusen Y, et al. (2011) Near Infrared Reflectance Spectroscopy for Estimating Soil Characteristics Valuable in the Diagnosis of Soil Fertility. Journal of Near Infrared Spectroscopy 19(2): 117-138.
-
Bellon-Maurel V, McBratney A (2011) Near-infrared (NIR) and mid-infrared (MIR) spectroscopic techniques for assessing the amount of carbon stock in soils – Critical review and research perspectives. Soil Biology and Biochemistry 43(7): 1398-1410.
-
Webster GT, Soriano-Disla JM, Kirk J, Janik LJ, Forrester ST, et al. (2016) Rapid prediction of total petroleum hydrocarbons in soil using a hand-held mid-infrared field instrument. Talanta 160: 410-416.
-
Altinpinar S, Sorak D, Siesler HW (2013) Near Infrared Spectroscopic Analysis of Hydrocarbon Contaminants in Soil with a Hand-Held Spectrometer. Journal of Near Infrared Spectroscopy 21(6): 511-521.
-
Yan H, Siesler HW (2018) Handheld Raman, Mid-Infrared and Near Infrared Spectrometers: State-of-the-Art Instrumentation and Useful Applications. Spectroscopy 33(11): 6-16.
-
Si-Ware Systems, Innovative Sensing Platform For a World That Makes More Sense.
-
Workman J, Weyer L (2012) Practical Guide and Spectral Atlas for Interpretive Near-Infrared Spectroscopy. 2nd (Edn.), CRC Press Boca Raton, FL, USA.
-
Naes T, Isaksson T (1992) Appl Spectrosc 46: 34-43.
-
Kim S, Kano M, Nakagawa H, Hasebe S (2011) Estimation of active pharmaceutical ingredients content using locally weighted partial least squares and statistical wavelength selection. Int J Pharm 421: 269-274.
-
Lesnoff M, Metz M, Roger JM (2020) Comparison of locally weighted PLS strategies for regression and discrimination on agronomic NIR data. J Chemom 34: e3209.
-
Naes T, Isaksson T, Fearn T, Davies T (2002) A User- Friendly Guide to Multivariate Calibration and Classification. 1st(Edn.), NIR Publications, UK, Chichester.
- Nigeria’s Vulnerability in the Face of Global Energy Policy
- A Simulation Study of Investigation of Optimum Oil Production Performance by Applying Various Gas Injection Methods in Oil Reservoir
- Characterization of Permo-Triassic Reservoirs through Thermal Maturity Assessment of Westphalian Source Rocks in the Cheshire Basin
- Influence of Microwax on the Rheological and Thermal Behaviour of a Wax Crude Oil
- Real-Time Monitoring and Performance Optimization of Steam Injection in Heavy Oil Reservoirs Using Fiber Optic Sensing and Integrated Predictive Simulation Models
- Isothermic, Kinetic and Thermodynamic Studies of Chromium (VI) Ions Adsorption on Composite Adsorbent of Chitosan- Eggshell Activated Carbon