Isothermic, Kinetic and Thermodynamic Studies of Chromium (VI) Ions Adsorption on Composite Adsorbent of Chitosan- Eggshell Activated Carbon
The removal of heavy metals such as chromium (VI) ions from wastewater is indispensable for the accomplishment of safeguarding the environment and human health. Hence, the adsorption properties of Cr (VI) ions on synthesized, characterized composite adsorbent of chitosan–eggshell activated carbon are investigated in this study. Excellent agreements were achieved between the predicted optimum values of yield and DDA of the extracted chitosan from the St. Peter’s fish scales, the predicted optimum values of the yield and surface area of eggshell activated carbon and their corresponding experimental values, with % error < 5. For the first time, exhaustive isothermic, kinetic and thermodynamic studies were carried out wherein thirteen 2–parameter (p), two 3–p isotherms and 9 kinetic models were employed with 3 kinetic models to establish the phenomenon of Cr (VI) ions adsorption. The 2–p Langmuir isotherm, which indicates monolayer coverage on the synthesized composite adsorbent and with maximum adsorption capacity of 4.0717 mg/g, and the pseudo second–order kinetic model are the most suitable for correlating the adsorption equilibrium and kinetic data of Cr (VI) ions adsorption respectively, based on the highest regression coefficient, R2 and lowest values of error functions. The adsorption of Cr (VI) ions on the composite adsorbent was film-diffusion controlled and chemisorbed. The thermodynamic studies reveal that Cr (VI) ions adsorption is spontaneous and exergonic since ΔG0 values are negative, endothermic since ΔH 0 = +1.7293 J/mol, and ΔS 0 = +63.7684 J/(mol K) indicating feasibility of the adsorption process with high affinity of adsorbate on adsorbent.
Olafadehan OA¹*, Aminu FU², Adewunmi OV¹, Kabiawu AI¹, Akinyanju AS¹, Amokun MK¹, Bello AM¹ and Olafadehan QO³
¹Department of Chemical and Petroleum Engineering, University of Lagos, Nigeria ²Department of Chemical Engineering, Lagos State University, Nigeria ³College of Natural Sciences and Mathematics, University of Denver, USA
Introduction
One of the considerable challenges being encountered worldwide is water pollution/ contamination for reason of indiscriminate discharge of urban and domestic wastewaters, agricultural wastes and industrial effluents into water courses. A significant influence of such pollution and contamination is due to the humongous volume of heavy metals (such as chromium, lead, nickel, zinc, copper, cadmium, iron, amongst others) in effluents from numerous industries, which can pose grave environmental and health challenges. However, the annual total amount of iron chromium oxide (i.e., chromite ore) produced globally is several millions of tonnes [1]. The direct reduction of the ore produces ferrochromite while electrolysis of chromium (III) oxide or aluminothermic process produces chromium as metal. Cr and its compounds are widely employed in the textile industries, in the preparation of chromate, electroplating, finishing of metal and leather tanning [2]. Two valence states of Cr in aqueous solution are trivalent and hexavalent, which are chemically represented by [Cr3+
2 2 7 Cr O −, − 4 HCrO or − 2 4 CrO , amongst others) respectively, and are very stable in the natural environment hence, they constitute grave environmental and health challenges. Almost all the latter compounds are carcinogenic (as reported by the International Agency for Research on Cancer), mutagenic and toxic to humans, e.g., and Cr(OH)2+] and (
2 2 7 Cr O
− [3, 4]. Owing to its higher mobility, higher water solubility (and thus it can be readily absorbed into the body) than Cr3+, and its ease of reduction to Cr3+ ions via free radicals’ formation [5]. Cr6+ ion has a hundred-fold larger toxicity than Cr3+ [6]. Its oxidizing characteristic lends credence to its toxicological effect. The World Health Organization recommended 0.05 mg/L as the toxic limit of Cr6+ ions in wastewater and the total industrial discharge of Cr3+ and Cr6+ ions and other species should be less than 2 mg/L [7]. Hence, these heavy metals removal from wastewater is not inessential for the aim of keeping the environment and human health safe.
lung cancer can be caused by The conventional approaches employed for the treatment of industrial wastewater-containing chromium include reduction cum chemical precipitation [8], electrolytic reduction (Seaman et al., 1999), membrane separation [10], ion-exchange [11], liquid-liquid extraction [12], electrochemical precipitation [13], foam separation [14], evaporation [15], and ultra filtration [1, 16], amongst others. These orthodox processes for the removal of chromium are expensive, inefficient or ineffectual at low concentrations. Hence, adsorption is being recommended as a practicable separation or unit operation for heavy metals removal in general from industrial wastewater without compromising the high quality of potable water [17–23] owing to its flexibility, simplicity, cost effectiveness as raw materials are readily available chiefly from natural and waste materials [24], and feasibility [25]. Adsorption has other advantages that include high tolerance for organics and capability of regeneration and reuse of biosorbent, high versatility, void of requirements of nutrients, selectivity of metal and overall performance with no dependence on concentration [26].
Much research has intensified efforts in the development of an eco-friendly material, adsorbent, that can perform excellently in the removal of heavy water, especially chromium (VI) ions, from contaminated or polluted water courses [27, 28]. Amongst the adsorbent reported in the literature for the removal of chromium (VI) ions from aqueous solutions include brown seaweed [29], rich husk [30], maize bran [31], Zea mays [32], corn husk biomass (Zea mays) [33], tamarind seeds [34], groundnut hull [35], walnut hull [36], limonia acidissima hull powder [37], ragi husk powder [1], green adsorbent- based biomass [38].
Fish scales are notable byproducts of the fish processing industry, and as such can proffer a feasible replacement source for chitin and chitosan syntheses [39]. They are chief sources of garbage from globe’s thriving fishing industries that operate with an abundance of water resources. The 2024 edition of The State of World Fisheries and Aquaculture (SOFIA) did report that global production of fisheries and aquaculture in 2022 increased suddenly to 2.232 × 10⁸tonnes, which represent an increase of 4.4% from the year 2020 [40]. Production constitutes 3.78 × 10⁷ and 1.854 ×10⁸ tonnes of algae and aquatic animals respectively. This will ultimately lead to scales making up a sizable amount on annual basis. Yet, they are presently merely used in limited quantities, chiefly for low-value applications like fertilizer or animal feed [41]. This underutilization of a widely accessible resource offers a substantial window of opportunity for the manufacture of chitosan sustainably. Utilizing this waste material to synthesize a valuable biomaterial (chitin and/or chitosan) is a wise economic and environmental decision [42]. Chitin, 2-acetamido-2-deoxy-β-D-glucose-(N- acetylglucan), is a naturally occurring polysaccharide that is dominant in the exoskeletons of crustaceans, anthropoids and the shells of some fungi. It is the second highly plenteous natural biopolymer after cellulose [43]. The α –, β – and γ –chitin are the three crystalline polymorphic forms of chitin that have been identified in shrimp and crab shells, squid pen, and in the stomach cuticles of Cephalopoda respectively [44]. Chitosan is a linear polysaccharide that comprises recurring units of N-acetyl-2-amino-2-D-glucopyranose and 2-amino- 2-deoxy-D-glucopyranose. These units are connected by β-(1→4)-glycosidic linkages. Chitosan is obtained from chitin. Industrially, chitosan can be synthesized via chemical deacetylation of chitin with sodium hydroxide. It is equally produced by enzymatic deacetylation of chitin using snailase, chitin deacetylase, neutral lysozyme, and neutral protease [45]. Its rare qualities, such as its antibacterial activity, biocompatibility, biodegradability and non-toxicity, have drawn significant attention from a variety of applications in pharmaceuticals, food preservation, agriculture, medicine, and biomaterials. At low values of pH, chitosan’s solubility is somewhat limited and thus creates challenges in commercial uses. It has sorption capacity for various heavy metal ions, though its soft active sites for binding are readily unavailable for sorption. However, these sites can form gel or agglomerate in aqueous solutions. For the transport of metal contaminants to these sites, it is, therefore, necessary to provide physical support and increase the accessibility of the metal binding sites for process applications [46, 47]. The use of chitosan as adsorbent for the treatment of industrial and municipal wastewaters has gained much attention in the literature [48–55]. Superior adsorption capacity can be obtained by impregnation of activated carbon obtained from biomass on chitosan [16, 46, 47, 56, 57].
Activated carbon from carbonaceous materials is applied industrially for the treatment of liquid and gaseous effluents for reason of its porous surface area, controllable pore structure, thermo–stability and low acid/base reactivity [58]. Commercial activated carbon is commonly produced from resources such as coal, lignite and peat, and thus, it is expensive, environmentally unfriendly and its high production and regeneration costs limit its application on a large scale. Alternatively, variety of low-cost materials such as rice husk [59], coconut shell [60], walnut shell [16], walnut and coconut shell [61], corncob [62], groundnut and eggshell [63], amongst others, have been utilized as precursors in the preparation of activated carbon for water and wastewater treatment [64]. Eggshell (ES) is a waste material that is obtained from food manufacturing facilities, restaurants, bakeries, homes, and poultry in large quantities and its disposal is not only costly but equally associated with environmental challenges. ES is regarded as a hazardous waste by the European Union regulations. However, its abundance and low cost makes it a good source for the production of activated carbon. Hence, the production of activated carbon from eggshells will ultimately add value to it. It will also help to reduce the cost of waste disposal, and will provide a potentially cheap alternative adsorbent to the commercial carbonaceous adsorbents due to its porous nature (about 700 to 1,700 pores present on the surface), good mechanical properties and thermal stability [65]. ES is majorly composed of calcium carbonate (about 94%), sulphates and phosphates of calcium and magnesium, organic matter and traces of Na, K, Mn, Fe, Cu, Sr metals [66]. Numerous studies have demonstrated the use of ES as an adsorbent for the removal of different pollutants including heavy metals [67], dyes, phenol, oxalic acid, surfactants, pharmaceutics, and polycyclic aromatic hydrocarbons (PAHs), both in their natural and chemically modified forms [66].
Since it is imperative to improve and enhance the mechanical and physical properties of chitosan through a modification process, the design of this study is to impregnate the extracted chitosan from St. Peter’s fish or Hawaiian fish (i.e., Tilapia fish) (Oreochromis niloticus) scales on eggshell activated carbon to synthesis composite adsorbent of chitosan–eggshell activated carbon for the treatment of simulated wastewater containing chromium (VI) ions. The preparation of chitosan/activated carbon composite can improve the mechanical strength, chemical stability, surface area and adsorption performance of chitosan [68]. The optimal conditions of the preparation variables for the chitosan and eggshell activated carbon were carried out using the Design Expert desirability function. The extracted chitosan, eggshell activated carbon and chitosan–eggshell activated carbon were characterized using analytical techniques of Fourier Transform Infrared (FTIR) within the 4000–400 cm-1 range for the spectral bands, Scanning Electronic Morphology (SEM) at different magnification of ×8,000, ×10,000, and ×12,000, Electron Dispersive X-ray Spectroscopy (EDS), and X-ray diffraction (XRD). For the first time, exhaustive isothermic models (thirteen 2–parameter (p) and two 3–p isotherms), 9 kinetic models and thermodynamics were investigated to describe the adsorption of chromium (VI) ions on the synthesized composite adsorbent. However, 3 kinetic models, intraparticle diffusion, Boyd and chemisorption- diffusion, are employed to identify the mechanism involved in the adsorption system, while the thermodynamic studies reveal the spontaneity, exergonic, endothermic and feasibility of the adsorption process.
Methodology
Materials
The St. Peter’s fish or Hawaiian fish (i.e., Tilapia fish) (Oreochromis niloticus) scales were obtained from a fish processing plant in Lagos State, Nigeria. The chemicals utilized in this study were of analytical grade, purchased from Sigma Aldrich in Germany and used as received. These included potassium dichromate (VI) dihydrate (K2Cr2O7.2H2O) of molar mass 330.22 g/mol (99%) for the synthesis of the industrial wastewater, NaOH (98%) and hydrochloric acid (99%) for the preparation of chitosan, and sodium hypochlorite (NaOCl) (99.9%) for the preparation of chitosan gel.
Extraction of Chitosan
The St. Peter’s fish scales were thoroughly washed with tap water to remove any adhering tissue, blood, or other impurities and then rinsed with distilled water. The cleaned scales were dried in an oven (GENLAB MIN 015) at 60oC for an hour. The dried fish scales were then ground into fine powder to increase surface area and improve solvent penetration. For the demineralization process, dried St. Peter’s fish scales were immersed in 1.0 M HCl with a solid-to solution ratio of 1:10 (w/v) at room temperature for 24 h. The acid treatment hydrolyses the calcium (II)
trioxocarbonate (CaCO3) present in the fish scales thereby releasing the organic matric (chitin) into solution. The sample was washed with distilled water until a pH of 7 (neutrality) to remove residual acid, after filtration. Then, it was oven-dried at 60°C for 1 hour to obtain demineralized sample. The dried chitin extract was then subjected to deproteinization using 1.0 NaOH solution with a solid- to-solution of 1:10 (w/v) at room temperature for 2 h to remove residual proteins and organic matter. It was then filtered and washed with distilled water until a neutral pH as achieved. The deproteinized chitin as dried thoroughly. The chitin was deacetylated using sodium hydroxide (4- 10% w/v) with a solid-to-solution ratio of 1:10 (w/v) at 60– 100 oC for 1 to 4 h. After filtering, the sample was washed with distilled water until neutral pH was obtained. After the deacetylation of chitin to chitosan, the chitosan was purified by dissolving it in sodium hypochlorite (NaOCl), after which, the chitosan was oven-dried at 60oC to obtain a fine powder. The yield of the resulting chitosan, YCH, was computed using Equation (1):
$$ Y _ {C H} = \left(w _ {C H} / w _ {c h}\right) \times 1 0 0 \tag {1} $$
where wCH and wch are the respective weights of chitosan
and chitin.
The degree of deacetylation (DDA) of the synthesized chitosan was determined by potentiometric titration described by Czechowska-Biskup, et al. [69]. Dried chitosan (0.2 g) was dissolved in 20 mL of 0.1 M hydrochloric acid and 25 mL deionized water and, which was then stirred for 30 min. Another 25 mL of deionized water was added, and stirring was maintained for 30 min. Using a burette, the solution was titrated with 0.1 M sodium hydroxide once the chitosan had fully dissolved. The DDA of the chitosan was calculated using Equation (2):
$$ D D A = \left[ \left(2. 0 3 / m\right) + 0. 0 0 4 2 \right] \left(V _ {2} - V _ {1}\right) \tag {2} $$
where m is the weight of sample, the factor 0.0042 the
coefficient resulting from the difference between molecular
weights of chitin and chitosan monomer units, the factor
2.03 the coefficient resulting from the molecular weight
of chitin monomer unit,
1 V and 2
V the volumes of 0.1 M
sodium hydroxide solution corresponding to the deflection
points.
The viscosity molecular weight of the prepared chitosan was determined by using the equation of Mark- Houwink-Sakurada for viscosity measurements at different concentrations, given by Paul and Lodge, [70]:
$$ \eta = k M ^ {\alpha_ {1}} \tag {3} $$
where η and M are the respective intrinsic viscosity
and molecular weight of chitosan, k and
Experimental Design for Chitosan Production
A Box-Behnken experimental design was used to optimize the chitosan production conditions by taking into account three variables with five centre points. The independent variables were concentration of NaOH ( A ), deacetylation temperature ( B ) and deacetylation time (C ), and the response variables were yield (YCH) and degree of deacetylation ( DDA). The independent variables and values used to optimize the production of chitosan are shown in Table 1. A total of 17 experimental points were determined, and model fitting was then performed. The design of experiment was performed using statistical software Design Expert (version 11.0). An analysis of variance (ANOVA) was performed in the response surface methodology (RSM) model to assess the statistical validity and predictive quality of the proposed model.
| Variables | Codes | Levels | ||
|---|---|---|---|---|
| -1.0 | 0.0 | +1.0 | ||
| Concentration of NaOH (%) | A | 4 | 7 | 10 |
| Deacetylation temperature (oC) | B | 60 | 80 | 100 |
| Deacetylation time (h) | C | 1 | 2.5 | 4 |
Table 1: Independent variables and values used for optimization of chitosan production.
Preparation of Activated Carbon from Eggshell
Eggshells were collected from different locally available sources in Lagos State, Nigeria. They were washed with tap water before rinsing with distilled water to remove surface impurities. The eggshells were sun-dried for 5 h and oven-dried at 110oC for 3 h and then allowed to cool. The dried eggshells were blended using HomeFlower HFB- 3489 and sieved to 100-125 µm. 15 g of powdered egg shell was impregnated with tetraoxophosphate (V) acid (i.e., phosphoric acid, H3PO4) (1M) at impregnation ratio of 1–3. The solution was stirred for 1 h and kept overnight for activation process. The solution was filtered with Whatman No. 1 filter paper (150 mm diameter, Cat No. 1001 150), then oven-dried at 110oC for 2 h to remove moisture and thus obtain the impregnated material. After being transferred into a crucible, the material was heated at varying temperatures (400–500oC) and time (60–120 min) in a muffle furnace. Thereafter, the activated material was allowed to cool, washed with distilled water to pH of 6.5–7, and dried in an oven at 105oC to constant weight. Thus, the activated carbon obtained was stored in a desiccator for further analysis and usage. The yield of the eggshell activated carbon, EAC Y , was computed thus:
$$Y_{EAC} = \left( \frac{w_c}{w_e} \right) \times 100$$
where $w_c$ and $w_e$ are the weights of activated carbon and raw eggshell respectively.
Sear’s method was used to determine the specific surface area of the prepared activated carbon from eggshell [16, 62, 71]. 1.5 g of activated carbon was acidified with diluted hydrochloric acid until a pH of 3–3.5. 30 g of sodium chloride was added to the solution with constant stirring using magnetic stirrer (Stuart SB 162) and the volume made up to 150 mL with distilled water. The resulting solution was titrated with 0.1M sodium hydroxide till a pH of 9 was attained and the volume of sodium hydroxide, $V_{OH}$, used to raise the pH to 9 was recorded. The surface area, $S_{EAC}$, of the prepared eggshell activated carbon was calculated thus:
$$S_{EAC} = 32V_{OH} - 25$$
**Preparation and Characterization of Chitosan–Eggshell Activated Carbon Composite**
The surface modification of eggshell activated carbon with chitosan gel was carried out by immersing 2 g of chitosan in 2% acid (v/v) and the sample was mechanically agitated at 200 rpm to form a homogenized mixture. 2 g of the egg shell activated carbon was slowly added to 100 mL chitosan solution and the mixture was continuously agitated at 200 rpm for 6 h at 50°C. After filtering and washing with distilled water, the composite chitosan–egg shell activated carbon (CH–EAC) was oven-dried for 2 h at 105°C, cooled to room temperature and kept in a desiccator [16, 72].
The CH-EAC composite was characterized using Brunaüer-Emmett-Teller (BET) method to determine the specific surface area and pore characteristics. The surface functional groups were determined using Shimadzu Fourier transform infrared (FTIR) 8400 Spectrometer. The morphology of the CH-EAC surface was examined by scanning electron microscope (JSM 7600F) equipped with energy dispersive X-ray analyzer (SEM-EDS; Phenom Prox).
**Preparation of Synthetic Wastewater**
Stock solution of chromium (VI) was prepared by dissolving a known quantity of potassium dichromate (VI) $(K_2Cr_2O_7 \cdot 2H_2O)$ in distilled water to achieve a concentration of 1000 mg/L.
The stock solution was then diluted to obtain working solutions of different initial concentrations of 10, 55, 100 mg/L. The pH of each solution was adjusted using dilute HCl and NaOH. The pH values investigated are 3, 6 and 9. Blank experiments were conducted to ensure that no adsorption occurred on the walls of the apparatus used.
**Batch Adsorption Experiment**
The batch adsorption studies were carried out at 30°C using the synthesized composite chitosan–eggshell activated carbon for the removal of chromium (VI) ions in the simulated industrial wastewater 100 mg/L of $K_2Cr_2O_7 \cdot 2H_2O$ was prepared by diluting 100 mL of 1000 mL $K_2Cr_2O_7 \cdot 2H_2O$ solution with distilled water in 1000 mL volumetric flask. 100 mL of this aqueous solution was measured into 250 mL Erlenmeyer flasks containing measured amounts of the different dosages of the composite chitosan–eggshell activated carbon of 0.5, 1.0 and 1.5 g in each flask. The mixture was mechanically agitated with a basic reciprocating shaker at 150 rpm for 2 h and left undisturbed for 30 min to allow the system to equilibrate. The mixture was filtered to separate the adsorbent from the liquid phase, and the residual chromium (VI) ion concentration in the filtrate was determined at 0 ≤ t ≤ 150 min using Atomic Absorption Spectrophotometer (Perkins Elmer Model 3100). The equilibrium chromium (VI) ions uptake, $q_e$ (mg/g), adsorption percentage, $\theta$ (i.e., the percentage removal of chromium (VI) ions, $R_{cr}$ and adsorption capacity values, $q_t$ (mg/g) at time $t$ (min) were calculated using Equations (6)–(8) respectively:
$$q_e = \left( \frac{c_0 - c_e}{m} \right) V$$
$$\theta = \frac{c_0 - c_e}{c_0} \times 100$$
$$q_t = \left( \frac{c_0 - c_t}{m} \right) V$$
while the distribution ratio, $K_d$, was determined thus:
$$K_d = \frac{amount of Cr in adsorbent}{amount of Cr in solution} \times 100$$
The adsorption percentage, $\theta$, and $K_d$ was correlated thus:
$$\theta = \frac{100K_d}{K_d + V/m}$$
All the adsorption experiments were duplicated to ensure accuracy, reliability and reproducibility of the adsorption data. Relative error did not exceed ±0.01.
**Adsorption Isotherms**
The equilibrium adsorption isotherm is one of the most important concepts in the investigation of adsorption.
mechanism. It provides useful information on the adsorption capacity, surface properties and affinity of an adsorbent. It is a useful tool for predicting the design of batch adsorption systems. Isothermal modeling is a prerequisite for evaluating the distribution of the adsorbates between the aqueous and solid phases and the nature of the adsorbate–adsorbent interactions. In a bid to explain the distribution of the adsorbate molecules on the adsorbent, fifteen isotherms comprising thirteen 2-parameter (p) and two 3-p isotherms were employed in this study, as presented in Table 2.
| S/No. | Isotherm | Non–linear form | References |
|---|---|---|---|
| 1. | Freundlich | 1 q =k c N e F e | [73] |
| 2. | Langmuir | q K c q = max L e e 1+K c L e | [74,75] |
| 3. | Temkin | R T q = u (In A +Inc ) e b T e T | [76] |
| 4. | Dubinin-Radushkevich (D– R) | q =q exp(−βε2) e DR ε=RT In(1+c−1) E=1 2β where e and | [75] |
| 5. | Jovanovic | q =q exp(−K c ) e J J e | |
| 6. | Harkins-Jura (H–J) | A q = HJ e B −logc HJ e | |
| 7. | Frenkel-Halsey-Hill (F–H–H ) | In K −Inc q =exp FHH e e n FHH | |
| 8. | Elovich | q q =q K exp− e c e E E q e E | |
| 9. | Flory-Huggins (F–H) | θ = K (1−θ)nFH c FH 0 ∆G0=−R T In K u FH | |
| 10. | Fowler-Guggenheim (F–G) | θ 2θW K c = exp FG e 1−θ R T u | |
| 11 | Kiselev | θ K c = v1 e (1−θ)(1+K θ) v2 | [75,77] |
| 12. | Hill-De Boer | K θ θ c = HD exp −K θ e R T(1−θ) 1−θ EC u | [78–81] |
| 13. | Hasley | q =(K c )1 n e H e H | [82] |
| 14. | Khan | (q ) α c q = m K K e e β (1+α c ) K K e | [54,75,83,84] |
| 15. | Modified BET | q K c q = m s e e (1−K c )(1−K c +K c ) BET e BET e s e | [55,75,85] |
Table 2: Isothermic models used for chromium (VI) ions adsorption.
where F k is Freundlich adsorption capacity, constant, ( )
$$ (m g) ^ {1 - \frac {1}{N}} L ^ {\frac {1}{N}} $$
/g), N the degree of homogeneity of
the system, dimensionless, qmax the Langmuir maximum
adsorption capacity for the solid phase loading, mg/g,
L K
the energy constant related to the heat of adsorption [=] L/
mg, Tb the Temkin constant, which is related to the heat of adsorption, J/mol, T A the Temkin isotherm constant, L/g, u R the universal gas constant, (J/(mol K)), T the temperature of adsorption (K), qDR the Dubinin-Radushkevich maximum adsorption capacity, (mg/g), β the Dubinin-Radushkevich isotherm inherent parameter, ε the Polanyi potential (unit), E the mean free energy per molecule of adsorbate, J/molecule, j K the Jovanovic isotherm constant, AHJ, BHJ the Harkins-Jura isotherm constant parameters, FHH n , FHH K the Frenkel-Halsey-Hill (FHH) isotherm parameters, E q the Elovich maximum adsorption capacity, mg/g, E K the Elovich equilibrium constant, L/mg, nFH the Flory-Huggins exponent, which gives the number of adsorbate molecules occupying adsorption sites, KFH the Flory-Huggins equilibrium constant, KFG the Fowler–Guggenheim equilibrium constant, L/mg, W the interaction energy between adsorbed molecules, kJ/mol, 1 v K the Kiselev equilibrium constant, L/mg,
2 v K the equilibrium constant for the formation of complex between adsorbed molecules, KHD the energetic constant of the interaction between adsorbed molecules, Pa, KEC the Hill-De Boer constant, dimensionless, H K , H n the Hasley isotherm constants, K m q ) ( the Khan isotherm maximum adsorption capacity, mg/g, K a the Kahn isotherm exponent, dimensionless, K b the Khan isotherm constant, L/mg, BET K the equilibrium constant of adsorption of upper layers in BET isotherm, L/mg, and s K the equilibrium constant of adsorption for 1st layer in Langmuir and BET isotherms, L/mg.
In Table 2, the Langmuir separation factor isotherm, L R , is given by [86]:
1 1 L L R K c = + (11) which can be used to describe the nature of adsorption thus: unfavourable, linear, favourable or irreversible for
0
1 > L R , 1 = L R , 1 0 < < L R and 0 < L R respectively [87].
Batch Reactor Design
The goal of the prototype is to ascertain the mass, m , of adsorbent needed to remove the adsorbate from solution of volume, V, at near real environmental initial concentration of 0_c_ to relatively allowable levels of concentration, ec . However, the design of monocomponent batch adsorption system can be eased by adsorption isotherms and equilibrium data. Based on the applicable adsorption isotherm, the mass of adsorbent required to realize specified percentage removal efficiency from aqueous solution of volume V for a known initial concentration of the adsorbate, except for 100% removal efficiency, is derived in this study, using Equations (6)–(8).
From Eq. (7), we obtain:
$$ c _ {e} = c _ {0} \left(1 - R _ {C r} / 1 0 0\right) \tag {12} $$
Combining Equations (6) and (7), we have:
$$ q _ {e} = R _ {C r} V c _ {0} / 1 0 0 m \tag {13} $$
Equations (12) and (13) can now be used in the isotherm that correlates the equilibrium adsorption data of chromium (VI) ions to determine the mass of composite adsorbent of chitosan–eggshell activated carbon required to achieve certain percentage removal of adsorbate from solutions of varied volumes (say, 1–20 L) at ambient temperature in a mono-solute batch reactor system.
Kinetic Study
To ascertain the equilibrium time and the mass transfer model with a view to giving insight into the mechanism of the adsorption process, kinetic studies are carried out [88, 89]. The uptake rate of solute is described by adsorption kinetics, which, in turn, controls the residence time of the adsorbate uptake at the solid-solution interface. Thus, it is imperative to understand the reaction mechanism and design appropriate for sorption treatment plants. So, the adsorption kinetics is a major issue in the design of a treatment system using adsorbent. Moreover, it is used to establish the controlling step in an adsorption process. Thus, adsorption kinetics can provide guidance to relational industry operators and planners to effectively treat the contaminated wastewater by adsorption since rapid adsorption of the solute in an adsorption system is advantageous and not undesirable for real or industrial applications. The various adsorption kinetics that were used in this study to draw inferences on the adsorption of chromium (VI) ions on the synthesized composite adsorbent are presented in Table 3.
| S/No. | Kinetic model | Non-linear Equation | Linear equation form | Reference |
|---|---|---|---|---|
| 1. | Fractional power model | q = k tv t f | Inq =Ink +vInt t f | [16,75,90–92] |
| 2. | Lagergren pseudo first– order kinetic model | dq t =k (q −q ) dt 1 e t | In (q −q )=Inq −k t e t e 1 | [16,75] |
| 3. | Pseudo second–order kinetic model | dq t =k (q −q )2 dt 2 e t | t 1 t = + q k q2 q t 2 e e | |
| 4. | Kuo–Loise kinetic model | 1 q =k c t α mF t mF e | In q =In (k c ) +(1α )In t t mF e mF | [93] |
| 5. | Blanchard kinetic model | k q t+αq −1 q = B e B e t k t+α B B | 1 = k t+α q −q B B e t | [94] |
| 6. | Elovich kinetic model | dq t =αexp(−βq ) dt t | 1 1 q = In(αβ)+ Int t β β | [75] |
| 7. | Avrami kinetic model | q =q [1 − t e exp(−k tnAV ) AV | q In−In1− t q e =Ink +n Int AV AV | [75,95 – 98] |
| 8. | Sobkowsk–Czerwi kinetics | q k t q = e SC t 1+k t SC | q 1 e = t+1 q k t SC | [75,99] |
| 9. | Behnajady– Modirshahla–Ghanbery (BMG) | t q =q 1− t e m+bt | t =m+bt q 1− t q e | [100] |
Table 3: Linear and non-linear kinetic models.
where tq is the amount of solute adsorbed per weight of adsorbent at time t , mg/g; fk the fractional power kinetic model constant, mg/(g min_v_), t the time of adsorption, min,
1_k_ the Lagergren pseudo first-order rate constant, min-1, 2 k is the specific reaction rate constant for the pseudo second- order kinetics, g/(mg min), kmf the apparent adsorption rate constant, L/(g min mF α − ), mF α the Kuo–Lotse constant, B k the Blanchard kinetic rate constant, g/(mg min), B α the Blanchard model constant, g/mg, α , β the Elovich
constants, AV k
the Avrami rate constant, min
$$ n ^ {- n _ {A V}}, n _ {X} \text {t h e} $$
Avrami constant, dimensionless,
SC k the Sobkowsk-Czerwi
second order kinetic rate constant [=] min-1, b and m are
two Behnajady-Modirshahla-Ghanbery (BMG) characteristic
constants relating to the reaction kinetics and adsorption
capacities.
To establish the diffusion mechanism involved in adsorption process of chromium (VI) ions on the synthesized adsorbent, the following kinetic models were also investigated:
Intraparticle Diffusion (IPD) (or Weber–Morris) Model
The intraparticle diffusion (IPD) (or Weber and Morris) model is given by:
$$ q _ {t} = k _ {I P D} \sqrt {t} + C \tag {14} $$
is the intraparticle diffusion rate constant
(mg/(g min½)) and C is a constant (mg/g).
Boyd Model
Theoretically, the Boyd, et al. [101] diffusion model was developed to explain the kinetics of ion-exchange. However, it had been used to address adsorption problems efficaciously [16,90–92] with a view to determining the actual rate- controlling step involved in the adsorption process. This is due to the involvement of the two-mass transfer of solute (both film and pore diffusion) in adsorption process. The inherent assumption in Boyd model is that the boundary layer in the periphery of the adsorbent has a pronounced effect on the solute diffusion. The Boyd’s model is given by:
6 1 ( ) 1 exp t B n e
q F t n Bt q n π ∞
( ) 2 2 2 1
$$ ) = \frac {q _ {t}}{q _ {e}} = 1 - \frac {6}{\pi^ {2}} \sum_ {n = 1} ^ {\infty} \frac {1}{n ^ {2}} \exp \left(- n\right) $$ (15) where ) (t FB is dimensionless fraction of solute adsorbed at time t, 2 2 p R D B π = : D the effective intraparticle diffusion coefficient (m2/s) and p R the radius of adsorbent particle (m).
Reichenberg [102] obtained approximate expressions given by Equations (16) and (18) via the application of Fourier transform and then integration of Equation (15):
$$ F _ {B} (t) = 1 - \frac {6}{\pi^ {2}} \exp (- B t), F _ {B} (t) > 0. 8 5 $$
(16) $$ \begin{array}{l} B t = - \ln \left[ 1 - F _ {B} (t) \right] - 0. 4 9 7 7, F _ {B} (t) > 0. 8 5 (17) \\ B t = \left(\sqrt {\pi} - \sqrt {\pi - \frac {\pi^ {2} F _ {B} (t)}{3}}\right) ^ {2}, F _ {B} (t) \leq 0. 8 5 (18) \\ \end{array} $$ $$ B t = \left(\sqrt {\pi} - \sqrt {\pi - \frac {\pi^ {2} F _ {B} (t)}{3}}\right) ^ {2}, F _ {B} (t) \leq 0. 8 5 \tag {18} $$
Diffusion-Chemisorption Model
The inherent assumption in the diffusion-chemisorption model is that the adsorbate uptake is under the influences of both diffusion and chemisorption. The diffusion- chemisorption model is given by:
q k t q q q = + − (19)
2 e DC e e t
( ) where kDC is the diffusion-chemisorption parameter (mg/(g min-0.5)) related to the initial sorption rate, ik (mg/ (g min)) by assuming a linear region as 0 → t using the empirical relationship:
$$ k _ {i} = k _ {D C} ^ {2} / q _ {e} \tag {20} $$
The linear form of Equation (19) amenable for the
determination of kDC and
eq by the method of linear
regression is expressed in Equation (21):
| 1 | t |
|---|
t e DC (21)
Thermodynamics Study
In a bid to comprehend the nature of the process of chromium (VI) adsorption on the synthesized composite adsorbent of chitosan–eggshell activated carbon, the thermodynamic parameters such as changes in standard enthalpy, 0 H ∆ , standard entropy, 0 S ∆ , and standard Gibbs free energy, 0 G ∆ , are computed and inferences drawn.
The adsorption (or thermodynamic) equilibrium constant, e K , is computed using the relation [16]:
$$ q _ {e} = K _ {e} c _ {e} \tag {22} $$
The change in Gibb’s free energy,
, 0 G ∆
is given by:
$$ \Delta G = - R _ {u} T \ln K _ {e} \tag {23} $$
$$ \Delta G = - R _ {u} T \ln K _ {e} \tag {24} $$
Combining Equations (23) and (24), we have:
$$ = \frac {\Delta S ^ {0}}{R} - \frac {\Delta H ^ {0}}{R T} $$
T R H R S K In
u u e (25) Applying linear regression analysis to Equation (25), changes in enthalpy, 0 H ∆ , and entropy, 0 S ∆ , can be estimated, and the variation of e K with temperature obtained. Equally, 0 G ∆ can be computed from Equation (23) or (24).
Error Functions
The bias, Bi, value between the experimental adsorption data and predictive value was estimated thus [103]:
$$ I = e x p \left[ \frac {1}{N _ {e}} \sum_ {i = 1} ^ {N _ {e}} I n \left(\frac {Y _ {i , e}}{Y _ {i , p}}\right) \right] $$ $$ B i = e x p \left[ \frac {1}{N _ {e}} \sum_ {i = 1} ^ {N _ {e}} I n \left(\frac {Y _ {i , i}}{Y _ {i , i}}\right) \right. $$
1 e N i e ,
1 , i e i p (26) The predictive accuracies of the isotherms and kinetic models are independently investigated via the computation of the various error functions, given in Equations (27)–(42) [75,103–107], which are used to compare the experimental data of chromium (VI) ions adsorption on the synthesized adsorbent matrix with the corresponding predicted values.
N ( ) e ∑
2 , , 2 1 Y Y R
$$ ^ {2} = 1 - \frac {\sum_ {i = 1} ^ {N _ {e}} \left(Y _ {i , e} - Y\right)}{\sum_ {i = 1} ^ {N _ {e}} \left(Y _ {i}\right)} $$ i p i e i
1 = N $$ \sum_ {i = 1} ^ {N _ {e}} \left(Y _ {i, p} - Y _ {e}\right) ^ {2} $$
2 , Y Y − i e p i
1 = (27)
| 100 | 2 N Y −Y e ∑ i,e i,p Y i=1 i,p |
|---|---|
| N e |
(28) Y Y − = e N
, , 100 ∑ = p i e i
N ARD e Y
1 , i e i $$ \begin{array}{l} N _ {e} - _ {i = 1} \left| Y _ {i, e} \right| (29) \\ S = \sum_ {i = 1} ^ {N _ {e}} \left| Y _ {i, e} - Y _ {i, p} \right| (30) \\ \end{array} $$ e N i p i e i Y Y EABS
1 , , (30) e N
$$ Q = \sum_ {i = 1} ^ {N _ {e}} \left(Y _ {i, e} - Y _ {i, p}\right) ^ {2} $$
2 , , i p i e i Y Y ERRSQ
1 $$ \begin{array}{l} \sum_ {i = 1} ^ {N _ {e}} \left(Y _ {i, e} - Y _ {i, p}\right) ^ {2} (31) \\ = \sum_ {i = 1} ^ {N _ {e}} \frac {\left(Y _ {i , e} - Y _ {i , p}\right) ^ {2}}{Y _ {i , e}} (32) \\ \end{array} $$
2 , , Y Y HYBRID
− = e N p i e i Y
1 , i e i $$ \begin{array}{l} \frac {1}{i = 1} Y _ {i, e} (32) \\ E = \frac {1}{N _ {e}} \sum_ {i = 1} ^ {N _ {e}} \left| Y _ {i, e} - Y _ {i, p} \right| (33) \\ \end{array} $$ e N
1 , , 1 i p i e i e Y Y N MAE
(33) Y Y − = e N
, , 100 ∑ = p i e i
N MPE e Y
1 , i p i (34)
Y Y $$ \Sigma = \frac {1}{N} \sum^ {N _ {e}} \left(\frac {Y _ {i , e} - Y}{Y}\right) $$ e N , , 1 $$ - \sum_ {i = 1} ^ {N _ {e}} \left(\frac {Y _ {i , e} - Y _ {i , p}}{Y _ {i , e}}\right) $$ p i e i N MAPE e Y
1 , i e i (35)
2 $$ 0 = \sum^ {N _ {e}} \left(\frac {Y _ {i , e} - Y}{Y}\right) $$
Y Y MPSD e N $$ = \sum_ {i = 1} ^ {N _ {e}} \left(\frac {Y _ {i , e} - Y _ {i , p}}{Y _ {i , e}}\right) ^ {2} $$ , , p i e i Y
1 i e i , (36)
N ( ) $$ P = 1 0 0 \sqrt {\frac {\sum_ {i = 1} ^ {N _ {e}} \left(Y _ {i , e} - Y\right)}{N}} $$
2 , , 100 Y Y NSD
i p i e i N
e (37) N ( ) $$ E = \sqrt {\frac {\sum_ {i = 1} ^ {N _ {e}} \left(Y _ {i , p} - Y\right)}{N}} $$
2 , , Y Y RMSE
i e i p i N
e (38) N ( ) e
$$ E = \sqrt {\frac {\sum_ {i = 1} ^ {N _ {e}} \left(Y _ {i , e} - Y\right)}{N - 1}} $$
2 , , Y Y SEE
i p i e i
1
2 N − e (39) ( ) 100 × = eY RMSE SEP (40)
2 $$ \left[ \sum^ {N _ {e}} \left(Y _ {i, e} - Y _ {i, p}\right) - 1 \right. $$ N ( ) e $$ E = \sqrt {\frac {\left[ \sum_ {i = 1} ^ {N _ {e}} \right]}{} $$ ARE Y Y
1 , , i p i e i
SRE
1 N − e $$ \begin{array}{l} N _ {e} - 1 (41) \\ = \sum_ {i = 1} ^ {N _ {e}} \left[ \frac {\left(Y _ {i , e} - Y _ {i , p}\right) ^ {2}}{Y _ {i , p}} \right] (42) \\ \end{array} $$ $$ = \sum^ {N _ {e}} \left[ \frac {\left(Y _ {i , e} - Y\right)}{V} \right. $$
2 , , 2 χ Y Y
e N p i e i Y
1 , i p i (42) where p iY , and e iY , are the predicted values and experimental data respectively, eY the mean value of experimental data, e N the number of the experimental data, 2 R the coefficient of determination, ARE the average relative error, ARD the absolute relative deviation percent, EABS the sum of absolute errors, ERRSQ the sum of error squares, HYBRID the hybrid fractional error function, MAE the mean absolute error, MPE the mean percentage error, MAPE the mean absolute percentage error, MPSD the Marquardt’s percent standard deviation, NSD the normalized standard deviation, RMSE the root mean square error, SEE the standard error of estimate, SEP the standard error prediction, SRE the standard deviation of relative error, and 2 χ the normalized chi-square function.
Appraisal of Model Prediction Accuracy
The appraisal of the predictive powers of the independent investigated isothermic and kinetic models is carried out with a view to determining the feasibility of using the models for prediction and estimation of the adsorption data of chromium (VI) ions on the synthesized composite adsorbent.
The Theil inequality coefficient, TIC, is a systematic measure of accuracy of any prediction from a model, and is given by Olafadehan [75]:
N
1 ( ) e ∑
2 , , Y Y N TIC
− k e k p k e
1 = = N N
1 1 e e ∑ ∑
2 , 1
2 , Y N Y N
+ k p k e k e k e
1 = = (43) If the fitness was justified based on the fact the 2 R values are close to unity, the standard deviation, SD, is used to infer the validity of the adsorption isotherm and kinetic model, and is given by Olafadehan, [75]:
2 = − ∑
Y SD N Y =
100 1 e N i p ,
1 , i e i e (44)
Durbin-Watson Statistic
The establishment of the correlation between the predicted model and the experimental data is based on the statistical function such as the Durbin-Watson Test (DWT). The Durbin-Watson statistic is obtained as follows [75]:
$$ D W T = S D S / S E S \tag {45} $$
N $$ S = \sum_ {k = 1} ^ {N _ {e}} \left(Y _ {k, e} - Y _ {k, p}\right) ^ {2} = \varepsilon_ {1} ^ {2} + \varepsilon_ {2} ^ {2} + \varepsilon_ {3} ^ {2} + \dots + \varepsilon_ {N _ {e} - 1} ^ {2} + \varepsilon $$ e
2 2 1 2 3 2 2 2 1 2 , , .... ε ε ε ε ε k N N p k e k Y Y SES
e e
1 (46) $$ S D S = \left(\varepsilon_ {2} - \varepsilon_ {1}\right) ^ {2} + \left(\varepsilon_ {3} - \varepsilon_ {2}\right) ^ {2} + \left(\varepsilon_ {4} - \varepsilon_ {3}\right) ^ {2} + \dots + \left(\varepsilon_ {N _ {e}} - \varepsilon_ {N _ {e} - 1}\right) ^ {2} \tag {47} $$
Results and Discussion
Molecular Weight of Extracted Chitosan
The viscosity average molecular weight of the extracted chitosan from St. Peter’s fish scales is obtained to be 680 kiloDalton (kDa) with viscosity at 20oC being 25.55 cP. The molecular weight value obtained in this study reveals that a medium molecular weight chitosan has been extracted from the St. Peter’s fish scales since for low, medium and high molecular weight chitosan, the range should be < 150 kDa, 150–700 kDa and > 700 kDa respectively. The utilization of medium molecular weight chitosan in solution form abounds in numerous applications owing to its high solution viscosity. Hence, the justification for its use in synthesizing the composite adsorbent of chitosan–eggshell activated carbon.
Regression Model Equations for Yield and DDA of Extracted Chitosan
The Box-Behnken design was used to find the optimal conditions for the preparation of chitosan from the St Peter’s fish scales. The yield and degree of deacetylation (DDA) of the extracted chitosan are the design responses while the independent factors (or variables) that influence its synthesis are concentration of NaOH ( A ), deacetylation temperature ( B ) and deacetylation time (C ). Table 4 shows the results of the experimental matrix.
| Run | Independent factors | Experimental design responses | |||
|---|---|---|---|---|---|
| A (%) | B (oC) | C (h) | Y (%) CH ,expt | DDA (%) expt | |
| 1 | 4 | 60 | 2.5 | 14.67 | 75.39 |
| 2 | 10 | 80 | 1.0 | 23.67 | 85.95 |
| 3 | 10 | 100 | 2.5 | 22.33 | 85.26 |
| 4 | 7 | 80 | 2.5 | 22.67 | 83.19 |
| 5 | 7 | 80 | 2.5 | 22.00 | 83.53 |
| 6 | 4 | 80 | 4.0 | 17.00 | 77.55 |
| 7 | 10 | 80 | 4.0 | 21.00 | 84.58 |
| 8 | 7 | 80 | 2.5 | 22.00 | 83.19 |
| 9 | 7 | 60 | 4.0 | 16.00 | 79.68 |
| 10 | 7 | 80 | 1.0 | 20.33 | 83.88 |
| 11 | 4 | 100 | 2.5 | 15.00 | 75.83 |
| 12 | 4 | 80 | 1.0 | 19.33 | 78.97 |
| 13 | 7 | 80 | 2.5 | 22.50 | 83.53 |
| 14 | 10 | 60 | 2.5 | 18.00 | 82.49 |
| 15 | 7 | 80 | 2.5 | 22.67 | 83.19 |
| 16 | 7 | 60 | 1.0 | 17.33 | 80.39 |
| 17 | 7 | 100 | 4.0 | 18.33 | 81.09 |
Table 6: Experimental design of chitosan with design responses.
In Table 4, the yield of chitosan obtained from the St. Peter’s fish scales ranged from 14.67 to 23.67% while the chitosan DDA varied between 75.39 to 85.95%. DDA ranges between 30% and 95%, depending on the available source and procedure of extraction of chitosan [108]. 100% DDA is very hardly attained, with commercial chitosan of $$ 75 \% \leq D D A \leq 85 \% $$
. The value of DDA obtained in this
study is thus in the range for commercial chitosan as well
as the values given by Di Martino, et al. [108]. So, from
this study, it can be inferred that St. Peter’s fish (Hawaiian
fish, i.e., Tilapia fish) (Oreochromis niloticus) are viable
alternative sources of chitosan. The determination of the $$
Y _ {C H, p r e d} = 2 2. 3 7 + 2. 3 8 A +
alternative sources of chitosan. The determination of the $$ Y _ {C H, p r e d} = 2 2. 3 7 + 2. 3 8 A + 1. 2 5 B - 1. 0 4 C + 1. 0 0 A B - 0. 0 8 5 A C - 0. 1 6 7 5 B C - 1. 3 1 A ^ {2} - 3. 5 6 B ^ {2} $$ $$ D D A _ {p r e d} = 8 3. 3 3 + 3. 6 9 A + 1. 1 4 B - 0. 7 8 6 2 C + 0. 3 3 2 5 A B + 0. 0 1 2 5 A C - 0. 5 2 B C - 1. 4 2 A ^ {2} - 1. 9 2 B ^ {2} $$ In Equations (48) and (49), the negative and positive signs signify antagonistic and synergetic effects of the factors respectively.
The design of experiments gives optimum values of 24.14% and 86.40% for the yield and DDA of the extracted chitosan from the St. Peter’s fish shell at NaOH concentration, deacetylation temperature and deacetylation time of 9.5%, 88oC and 1.4 h respectively. Experimental validation was conducted to ascertain the optimal conditions given by optimal conditions of the preparation variables was carried out via the optimization of the extraction process using the Design Expert desirability function. The quadratic regression models for the yield of chitosan ( , CH pred Y ) and pred DDA are given in Equations (48) and (49) respectively.
$$ - 0. 8 1 0 3 C ^ {2} \tag {48} $$
$$ - 0. 1 4 8 0 C ^ {2} \tag {49} $$
RSM. The yield and DDA of extracted chitosan obtained at the preparation conditions were 24.40 % and 86.31% respectively. Figures 1A and 1B show the respective plots of actual values versus the predicted values for yield and DDA of chitosan. Hence, excellent agreement was obtained between the experimental and predicted values of the yield and DDA of the extracted chitosan, with % error being ± 1.07 and ± 0.10% respectively, which are within the acceptable limits of ± 5%.
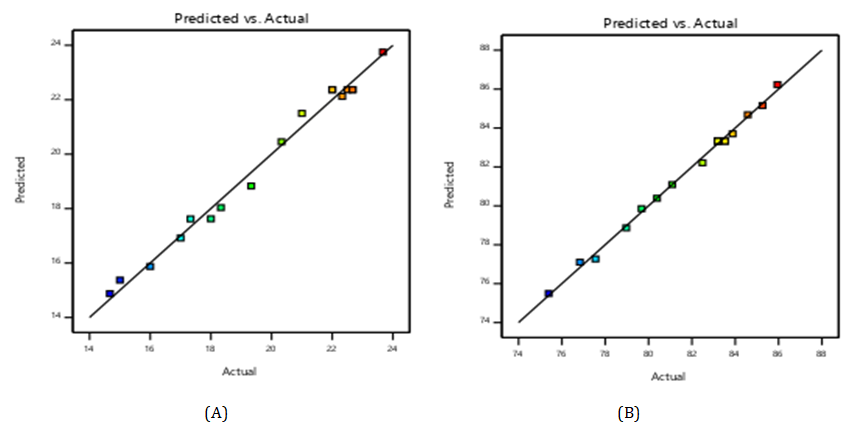
Table 5 shows the model summary statistics for the yield and DDA of the extracted chitosan from St. Peter’s fish scales.
| Response | R2 | Adjusted R2 | Predicted R2 | Std. Dev. | Mean | C.V. (%) | Adeq. Precision |
|---|---|---|---|---|---|---|---|
| Yield | 0.9889 | 0.9747 | 0.9713 | 0.4703 | 19.70 | 2.39 | 24.6052 |
| DDA | 0.9964 | 0.9917 | 0.9553 | 0.2803 | 81.69 | 0.3432 | 49.9317 |
Table 7: Model summary statistics for chitosan yield and _DDA_.
The coefficient of determination (or regression coefficient) ( 2 R ) was used to evaluate the degree to which the regression model fits the experimental data for this study. The changes described by the model to the overall changes are referred to as coefficient of determination ( 2 R ). Therefore, the closer 2 R value is to 1, the fitted model power is greater to explain the response changes as a function of the independent variables. In Table 5, the values of the coefficient of determination, 2 R , show that the dataset fits the regression models exceedingly well, with 98.89% and 99.64% of the total variations of the yield and DDA explained by regression models in Equations (48) and (49); only 1.11% and 0.46% of the total variations could not be explained by the models. The predicted 2 R is in agreement with the adjusted 2 R for both yield and DDA, which suggests that the model’s predictions are highly consistent and reliable. Furthermore, the Adequate Precision measures the signal to noise ratio and its value of more than 4 is highly desirable.
In the present study, the adequate precision values for the yield and DDA of the extracted chitosan were found to be 24.6052 and 49.9317 respectively, which is greater than 4, indicating that the model prediction is significant.
Regression Model Equations for Yield and Surface Area of Eggshell Activated Carbon
The Design Expert (version 11.0) was employed to analyze the dataset obtained from the dependent variables (i.e., yield and surface area of eggshell activated carbon). Utilizing the Box-Behnken design, the optimal conditions for the production of eggshell activated carbon were determined by selecting yield and surface area as the design responses while the independent factors (or variables) are impregnation ratio ( 1 A ), activation temperature ( 1 B ) and activation time ( 1 C ). Table 6 shows the results of the experimental matrix.
| Run | Independent factors | Experimental design responses | |||
|---|---|---|---|---|---|
| A (%) 1 | B (oC) 1 | C (min) 1 | Y (%) EAC ,expt | S EAC ,expt (m2/g) | |
| 1 | 1 | 500 | 90 | 68.00 | 1095 |
| 2 | 2 | 500 | 60 | 47.33 | 1191 |
| 3 | 3 | 500 | 90 | 10.00 | 1223 |
| 4 | 2 | 400 | 120 | 50.67 | 999 |
| 5 | 2 | 450 | 90 | 51.33 | 1079 |
| 6 | 2 | 450 | 90 | 51.67 | 1095 |
| 7 | 1 | 450 | 120 | 71.30 | 887 |
| 8 | 3 | 400 | 90 | 14.00 | 935 |
| 9 | 2 | 450 | 90 | 49.33 | 1063 |
| 10 | 3 | 450 | 60 | 12.00 | 903 |
| 11 | 3 | 450 | 120 | 11.30 | 983 |
| 12 | 1 | 450 | 60 | 73.30 | 791 |
| 13 | 2 | 500 | 120 | 39.33 | 1255 |
| 14 | 10 | 60 | 2.5 | 18.00 | 82.49 |
| 15 | 7 | 80 | 2.5 | 22.67 | 83.19 |
| 16 | 7 | 60 | 1.0 | 17.33 | 80.39 |
| 17 | 7 | 100 | 4.0 | 18.33 | 81.09 |
Table 8: Experimental design for the production of eggshell activated chitosan (EAC) and design responses.
In Table 6, the yield of eggshell activated carbon (EAC) ranged from 10 to 74.7% while its surface area was found to vary from 775 and 1255 m2/g. Optimization of the preparation process was carried out to determine the optimal conditions of the inherent process variables using the Design Expert
2 , 1 1 1 1 1 1 1 1 1 1 50.67 30.00 3.84 2.00 0.6750 0.3250 0.6675 7.67 EAC pred Y A B C A B AC B C A = − − − + + − − desirability function. The quadratic regression models for the yield of eggshell activated carbon ( pred EAC Y , ) and its surface area, pred EAC S , , are given in Equations (50) and (51) respectively.
2 2 1 1 1.32 1.02 B C − − (50)
$$ S _ {E A C, p r e d} = 1 0 7 9 + 6 2. 0 0 A _ {1} + 1 5 2. 0 0 B _ {1} + 5 0. 0 0 C _ {1} - 8. 0 0 A _ {1} B _ {1} - 4. 0 0 A _ {1} C _ {1} - 2 4. 0 0. B _ {1} C _ {1} - 1 2 6. 0 0 A _ {1} ^ {2} + 5 4. 0 0 B _ {1} ^ {2} - 6 2. 0 0 C _ {1} ^ {2} \tag {51} $$ The design of experiments gives optimum values of 35.02% and 1213 m2/g for the yield of eggshell activated carbon and its surface area respectively at impregnation ratio of 2.65, activation temperature of 496°C, and activation time of 70 min. Experimental validation was conducted to ascertain the optimal conditions given by RSM. The yield and surface area of the eggshell activated carbon at the preparation conditions were 36.67% and 1207 m2/g respectively. Figures
2(A) and 2(B) show the respective plots of actual values versus the predicted values for yield and surface area of the eggshell activated carbon. Hence, excellent agreement was obtained between the experimental and predicted values of the yield and DDA of the extracted chitosan, with % error being ± 4.45 and ± 0.5% respectively, which are within the acceptable limits of ± 5%.
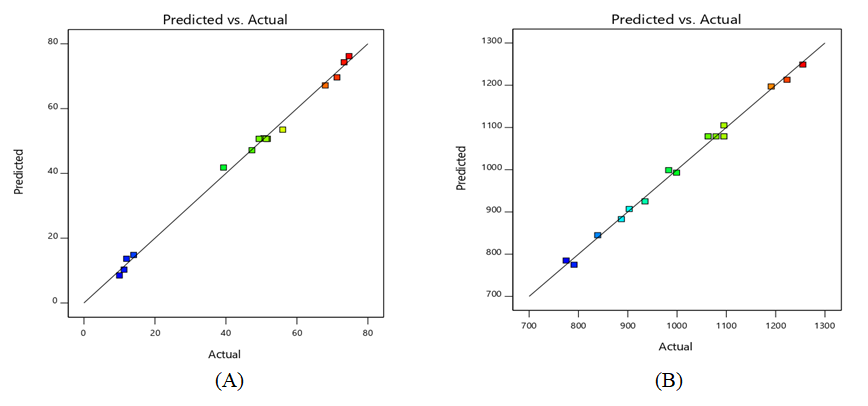
Table 7 shows the model summary statistics for the yield and surface area of the eggshell activated carbon.
| Response | R2 | R2 Adjusted | R2 Predicted | Std. Dev. | Mean | C.V. % | Adeq. Precision |
|---|---|---|---|---|---|---|---|
| Yield | 0.9958 | 0.9905 | 0.9448 | 2.13 | 45.96 | 4.64 | 41.3803 |
| Surface area | 0.9937 | 0.9856 | 0.9433 | 0.37 | 1015.94 | 1.71 | 35.5799 |
Table 9: Model summary statistics for the yield and surface area of the eggshell activated carbon.
In Table 7, the values of the coefficient of determination, 2 R , show that the dataset fits the regression models exceedingly well, with 99.58% and 99.37% of the total variations of the yield and surface area of the eggshell activated carbon explained by regression models in Equations (50) and (51); only 0.42% and 0.63% of the total variations could not be explained by the models. The predicted 2 R value is in excellent agreement with the adjusted 2 R value for both yield and surface area, which suggests that the model’s predictions are highly consistent and reliable. Furthermore, the Adeq Precision measures the signal to noise ratio. The Adeq Precision for both yield and surface area of the eggshell activated carbon were 41.3803 and 35.5799 respectively. However, a ratio above 4 is generally considered desirable, indicating a strong signal. In this case, the significantly higher ratios for both responses indicate that the signal in the model is much stronger than the noise. Consequently, the model proves to be well-suited for navigating the design space, providing valuable insights and reliable predictions.
Characterization Results of Chitosan, Eggshell Activated Carbon and Chitosan–Eggshell Activated Carbon
Fourier Transform Infrared (FTIR)
The peaks showing in the FTIR spectra of the chitosan from St. Peter’s fish scales (C), eggshell activated carbon (AC) and the composite adsorbent of chitosan–eggshell activated carbon (CAC) used in this study for adsorption studies were assigned to various functional groups according to their respective wave numbers as reported in the literature. Various absorption bands within the 4000–400 cm-1 range were recorded in the FTIR spectra of these materials. The FTIR spectra in Figure 3 show the transmittance across different wavelengths.
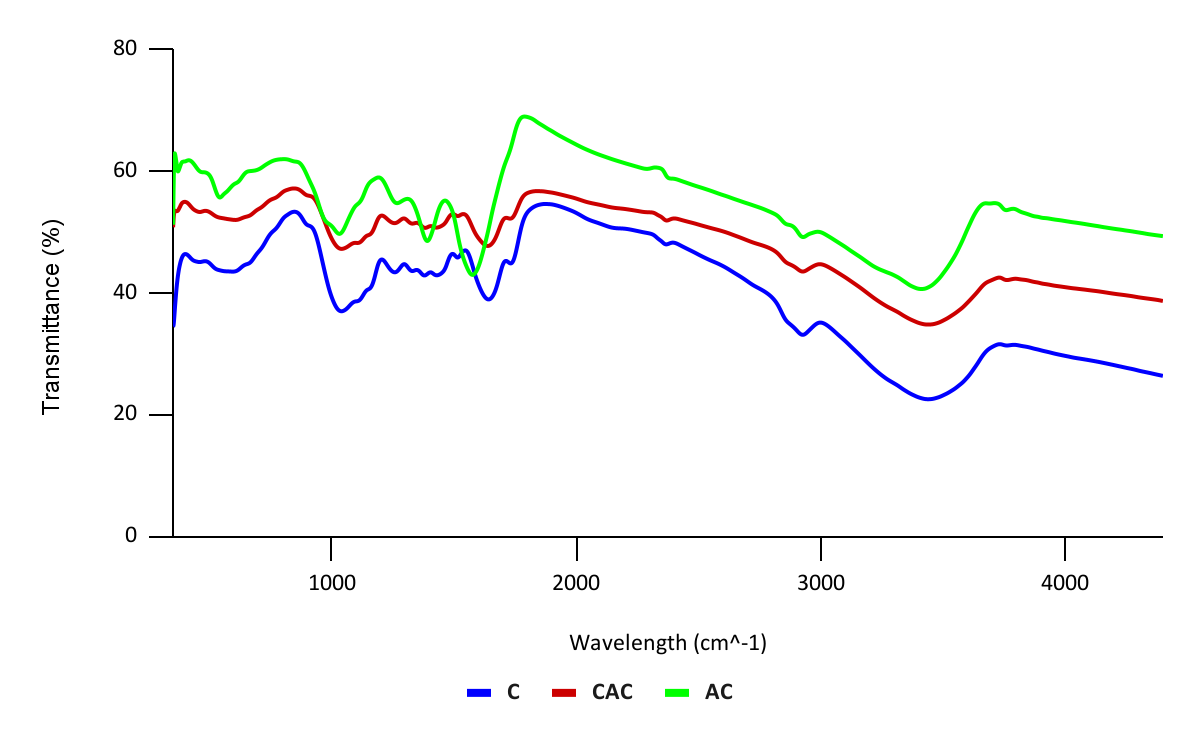
The broad peaks around 3200–3500 cm-1 present in the three spectra show the O–H stretching vibration, which is a characteristic of hydroxyls group present in chitosan and eggshell activated carbon. The peaks around 2800–3000 cm-1 show the C–H stretching vibrations, which are present in organic materials like chitosan and eggshell activated carbon. The peak around 1650 cm-1 in spectra shows the N–H stretching vibrations in chitosan, indicating the presence of amide group which are present in pure chitosan. The peaks showing the O–H and N–H stretching vibration are less pronounced in the chitosan–eggshell activated carbon in comparison to the pure chitosan, which can be related to the possible changes in the structure due to activation.
SEM and EDS
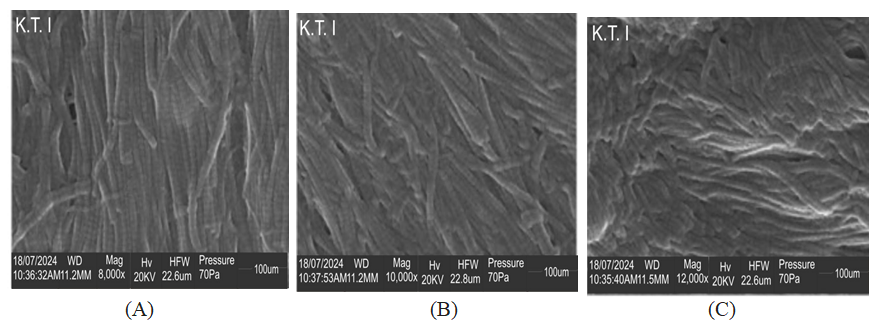
The Scanning Electronic Morphology was employed to assess the morphological features and ascertain the surface nature of the extracted chitosan from St. Peter’s fish scales, eggshell activated carbon and the composite adsorbent of chitosan–eggshell activated carbon. Figures 4(A), 4(B) and 4(C) show the SEM images for the extracted chitosan at different magnifications of ×8,000, ×10,000 and ×12,000 respectively. The images displayed in Figure 4 revealed the fibrous structure of chitosan, with a network of tightly packed fibers.
Figures 5(A), 5(B) and 5(C) show the SEM images for the eggshell activated carbon at different magnifications of ×
8,000, ×10,000 and ×12,000 respectively.
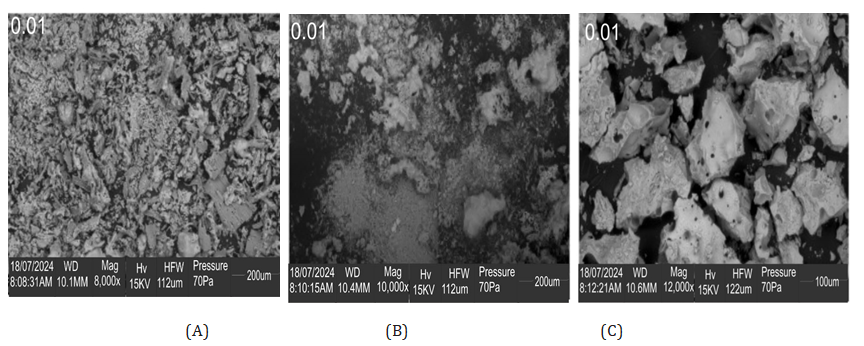
The images displayed in Figure 5 show a porous surface structure of the prepared eggshell activated carbon with various particle sizes and shapes and the 12,000× magnification shows larger and more distinct pores and cracks within the structure than at ×10,000 and ×12,000. This high porous structure indicates activation.
Figures 6(A), 6(B) and 6(C) show the SEM images for chitosan–eggshell activated carbon at different magnifications of ×8,000, ×10,000 and ×12,000 respectively. The images displayed in Figure 6 showed a fibrous structure with visible cavities, pores and surface texture. The surface appears rough, indicating the presence of a porous network, which is a feasible property of a standard and commercial adsorbent.
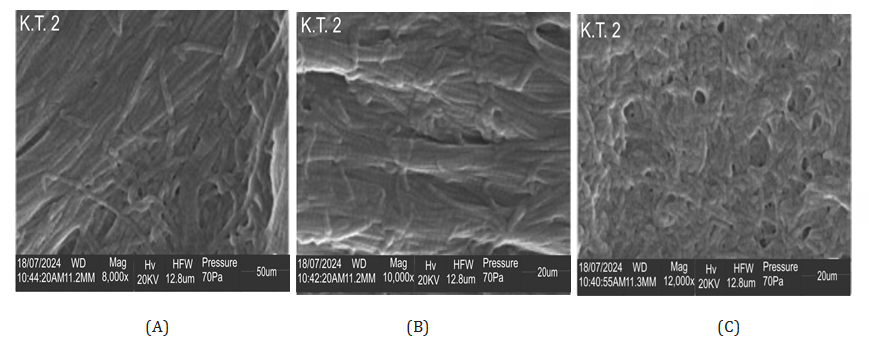
Table 8 shows the summary of the surface characteristics of the synthesized composite chitosan-eggshell activated carbon (CH–EAC) used as adsorbent in this study. The surface area of CH–EAC obtained from BET measurement was 1067.98 m2/g, which is lower than that of the eggshell activated carbon prepared in this study (1207 m2/g). Similar results were obtained by Sharififard, et al. [109], Fatombi, et al. [110] and Mashile, et al. [111]. This might be due to chitosan filling the pores of activated carbon.
| Parameter | S (cm2/g) BET | Pore size (nm) | V (cm3/g) p | V (cm3/g) µ | V (cm3/g) M |
|---|---|---|---|---|---|
| Value | 1067.98 | 2.118 | 0.213 | 0.152 | 0.061 |
Table 10: Surface characteristics of the prepared chitosan-eggshell activated carbon.
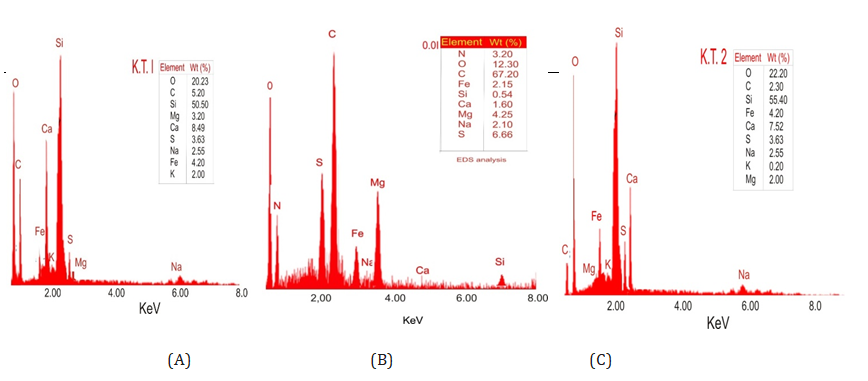
where BET S is the BET surface area, p V , µ V and M V are the total pore, micropore and mesopore volumes respectively The Electron Dispersive X-ray Spectroscopy (EDS) spectra and the distribution of chemical elements in the extracted chitosan from St. Peter’s fish scales, eggshell activated carbon and the composite adsorbent of chitosan– eggshell activated carbon are shown in Figures 7(A), 7(B) and 7(C) respectively.
The elements identified in Figure 7(A) for the extracted chitosan include oxygen, carbon, silicon, magnesium, calcium, sulphur, sodium, iron and potassium with their atomic concentration indicated.
The highest atomic concentration of calcium (8.49%) was observed for the extracted chitosan in comparison to the % obtained for eggshell activated carbon (1.60) (Figure 7(B)) and chitosan–eggshell activated (7.52) (Figure 7(C) for the reason of chitosan being a precursor of calcium in the form of CaCO3, which equally informed the higher atomic concentration of calcium in the composite adsorbent than in the eggshell activated carbon.
The presence of other elements like sulphur, magnesium and sodium in the extracted chitosan may be due to it being a component of amino acids or proteins in the original fish scales or contamination during the extraction process.
Also, in Figure 7(B), the highest atomic concentration of carbon (67.20%) was observed for eggshell activated carbon, with extracted chitosan and chitosan–eggshell activated carbon giving 5.20 and 2.30%, as seen in Figures 7A, 7B and 7C respectively.
This is expected for the reason of eggshell activated carbon being the carbon precursor.
Its high carbon concentration is indicative of the formation of a carbonaceous material occasioned by raw eggshell chemical treatment.
XRD
The X-ray diffraction (XRD) technique was employed to examine the crystalline nature and phase composition of the extracted chitosan from St. Peter’s fish scales, eggshell activated carbon and the composite adsorbent of chitosan– eggshell activated carbon, as shown in Figures 8A, 8B and 8C respectively.
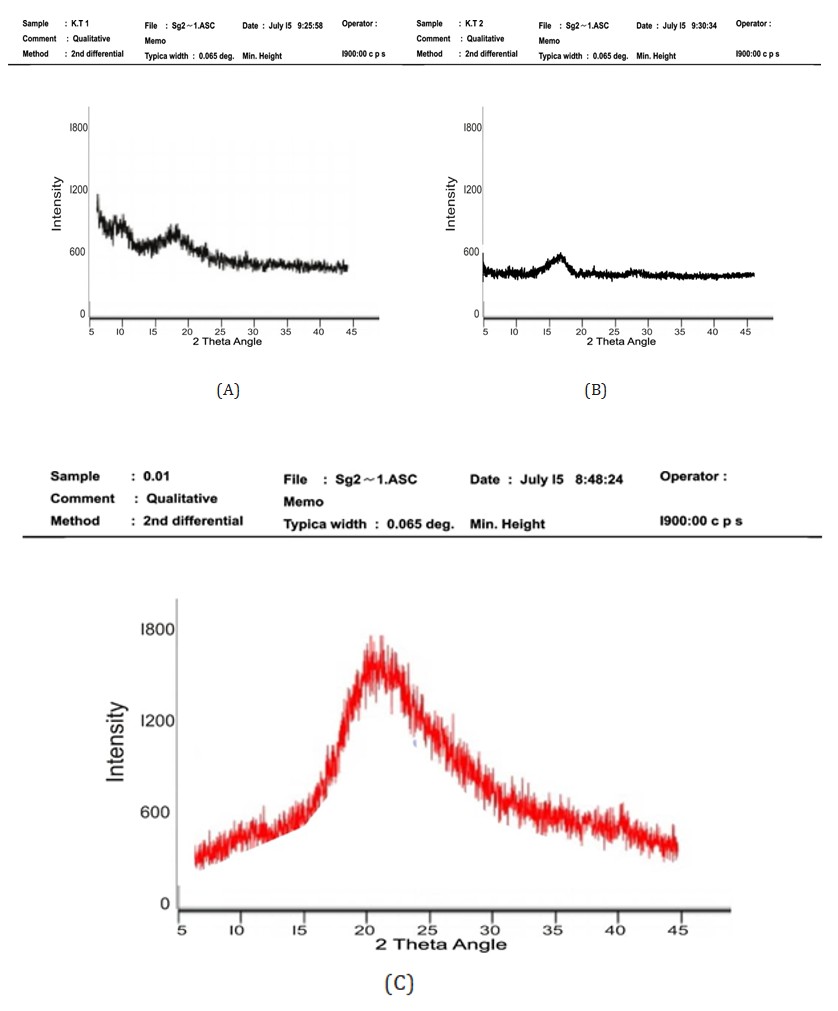
Figure 8(A) shows defined peaks that indicate the presence of crystalline regions. Chitosan has a semi-crystalline structure, with peaks that correspond to its polysaccharide chains. These peaks show that the chitosan has a level of ordered structure due to its molecular arrangement. Figure 8(B) shows a broad peak centered around 2θ = 20–30°. This broad peak, in the absence of any sharp peak, indicates an amorphous structure, which suggests that the activated carbon has a low degree of crystallinity. This is typical for activated carbon due to the disordered structure that arises from the activation process. Figure 8(C) shows a broad peak that is similar to that of activated carbon, indicating some amorphous structure, which still having sharper peaks that indicate residual crystallinity from the chitosan. Hence, the synthesized adsorbent of chitosan-eggshell activated carbon exhibits a mix of amorphous and crystalline characteristics, reflecting its composite nature as both chitosan and carbon.
Estimation of Isotherm Parameters for Chromium (VI) Adsorption on Composite Adsorbent of Chitosan-Eggshell Activated Carbon
The method of linear least squares (or linear regression analysis) was used to determine the inherent isotherm parameters of the thirteen 2-p and two 2-p adsorption isotherms in Table 2. Table 9 shows the results obtained for a total of 15 adsorption isotherms investigated in this study, as well as the values of Biot, B , and coefficient of determination,
2 R . The 2 R values, and error functions, given in Equations
(28)–(42), whose values are given in Table 10, were used to select the best adsorption isotherm that can be used to correlate the experimental data of chromium (VI) adsorption on the synthesized adsorbent matrix.
| 2-p Freundlich | N | -0.7769 | |
|---|---|---|---|
| (mg)1−1 L1 k N N F /g | 74.5150 | ||
| Bi | 1.0001 | ||
| R2 | 0.8943 | ||
| 2-p Langmuir | q max (mg/g) | 4.0717 | |
| K (L/mg) L | -0.3907 | ||
| R L | -2.6267×10⁻² | ||
| Bi | 1.0057 | ||
| R2 | 0.9988 | ||
| 2-p Temkin | A (L/g) T | 9.6912 ×10⁻² | |
| b (J/mol) T | -1.7922 ×10⁵ | ||
| Bi | 1.0128 | ||
| R2 | 0.7838 | ||
| 2-p Dubinin-Radushkevich | q DR (mg/g) | 4.2883 | |
| β (molecule/J)2 | 3.0 ×10⁻⁶ | ||
| E (J/molecule) | 4.0825 ×10² | ||
| Bi | 1.0633 | ||
| R2 | 0.9858 | ||
| 2-p Jovanovic | q (mg/g) J | 32.2075 | |
| K J | 0.2343 | ||
| Bi | 0.9999 | ||
| R2 | 0.8091 | ||
| 2-p Harkins-Jura | AHJ | -15.2439 | |
| BHJ | 0.4771 | ||
| Bi | 0.9978 | ||
| R2 | 0.9946 | ||
| 2-p Frenkel-Halsey-Hill | n FHH | 0.7769 | |
| K FHH | 28.4854 | ||
| Bi | 1.0001 | ||
| R2 | 0.8943 | ||
| 2-p Elovich | q (mg/g) E | -7.1276 | |
| K (L/mg) E | -6.4404×10⁻² | ||
| Bi | 1.0002 | ||
| R2 | 0.9145 | ||
| 2-p Flory-Huggins | n FH | -0.0548 | |
| K FH | 0.8039 | ||
| Bi | 0.9992 | ||
| R2 | 0.9830 | ||
| 2-p Fowler-Guggenheim | W (J/mol) | -4.9171 ×10⁴ | |
| K (L/mg) FG | 3.2653 ×10⁻¹⁶ | ||
| Bi | 1.0152 | ||
| R2 | 0.9855 | ||
| 2-p Kiselev | K V1 | -142.07 | |
| K V2 | -1.0893 | ||
| Bi | 1.0660 | ||
| R2 | 0.8553 | ||
| 2-p Hill-De Boer | K EC | 419.07 | |
| K (J/mol) HD | 4.1064 ×10166 | ||
| Bi | 1.0039 | ||
| R2 | 0.9429 | ||
| 2-p Hasley | n H | -0.7769 | |
| K H | 3.5106 ×10⁻¹² | ||
| Bi | 1.0001 | ||
| R2 | 0.8943 | ||
| 3- p Khan | (q ) m K (mg/g) | 4.08 | |
| α K | -0.3874 | ||
| β K | 1.0131 | ||
| Bi | 1.0018 | ||
| R2 | 0.9942 | ||
| Modified 3-p BET | q m (mg/g) | K S | K BET |
| 4.6366 | -0.3674 | 9.05 ×10⁻³ | |
| -4.6366 | 0.3674 | 0.3765 | |
| Bi = 1.0021 | |||
| R 2 = 0.9918 |
Table 11: Values of the inherent parameters in the adsorption isotherms for chromium (VI) ions.
For all the 15 isotherms investigated, the computed bias, Bi, values are somewhat close to unity, which are indicative of the fact that the errors between the experimental and predicted equilibrium chromium (VI) ions uptake are normally distributed. For the Freundlich isotherm, the empirical constant, N , indicates adsorption intensity, which depends on the temperature and properties of the adsorbate and the adsorbent. In Table 9, the value of N obtained for the chitosan–eggshell activated carbon– chromium (VI) ions is less than zero, which implies that the Freundlich adsorption isotherm is not suitable for the correlation of the adsorption data of the system being investigated since N is not greater than 1. This is buttressed by the fact that the regression coefficient obtained, 2 R (= 0.8943), is not close to unity and the error functions values, shown in Table 10, reveal that there is no agreement between the experimental adsorption data and their predicted values. However, the magnitude of the exponent, 1/N, gives an adsorption nature. Thus, the adsorption is indicative of chemisorption since 1 1 0 < < N , where N 1 obtained in this study is −1.2871.
In Table 9, the highest 2 R value of 0.9988 was obtained for the Langmuir isotherm as against the 2 R values for the other adsorption isotherms investigated in this study. Moreover, the Langmuir separation factor isotherm, L R , was found to be -2.6267×10⁻², which is less than zero. Hence, this depicts an irreversible isotherm. However, the Langmuir maximum adsorption capacity, qmax, for the solid phase loading was found to be 4.0717 mg/g at an ambient temperature of 303 K. Equally in Table 9, the results obtained for the adsorption isotherms of Temkin ( 2 R = 0.7838), Jovanovic ( 2 R = 0.8091), Frenkel–Hasley–Hill (FHH) ( 2 R = 0.8943), Elovich ( 2 R = 0.9145), Kiselev (( 2 R = 0.8553), Hill- De Boer ( 2 R = 0.9429), and Hasley ( 2 R = 0.8943) reveals
2 R values that are not relatively within 95% confidence level.
Hence, these isotherms cannot be used to correlate the experimental data of Cr (VI) ions removal from the simulated wastewater using the synthesized composite adsorbent of chitosan–eggshell activated carbon, with the decreasing order of correlation being Hill–De Boer > Elovich > Freundlich, FHH, Hasley > Kiselev > Jovanovic > Temkin. Hence, Temkin isotherm performs worst amongst the 15 isotherms investigated in this study. It can also be deduced from the results in Table 9 that the values of coefficients of determination for the isotherms of Dubinin–Radushkevich (D–R) ( 2 R = 0.9858), Harkins–Jura (H–J) ( 2 R = 0.9946), Flory–Huggins (F-G) ( 2 R = 0.9830), Fowler–Guggenheim (F–G) ( 2 R = 0.9855), 3-p Khan ( 2 R = 0.9942), and modified 3- BET ( 2 R = 0.9918) are relatively within 95% confidence level. Hence, these isotherms can be decisively used to correlate the experimental data of Cr (VI) ions removal from the simulated wastewater using the synthesized composite adsorbent of chitosan–eggshell activated carbon, with the decreasing order of correlation to the experiment adsorption data being H–J > 3–p Khan > modified 3–p BET > D–R > F–G > F–H. It ought to be emphasized in this study that the negative value of W in the Fowler–Guggenheim (F–G) isotherm implies that the interaction amongst the adsorbed molecules of chromium (VI) is repulsive so that the heat of adsorption decreases with loading. The F–G isotherm is only applicable when the surface coverage, θ , is less than 0.6, which is not the case of the adsorption process investigated in this study.
Table 10 shows the comprehensive computed values of the error functions given in Equations (28)–(42) obtained via comparison of the experimental equilibrium data of chromium (VI) ions on the synthesized composite adsorbent with their predicted values. The goodness of fit of Langmuir isotherm to the experimental equilibrium data of Cr (VI) ions was corroborated by the very least values of the error functions in comparison to the values obtained for the other isotherms.
The lower values of TIC obtained for the 3-p Khan, 3-p
modified BET and 2-p Langmuir isotherm than the values for the other isotherms, as can be seen in Table 10, reveal the high predictive powers of these three isotherms. However, judging
2 R for 2-p Langmuir isotherm, it is adjudged to be feasible for the prediction of the adsorption data of chromium (VI) ions on the synthesized composite adsorbent.
from the high value of
| Isotherm | Values of Error Functions | |||||||||||||||||
|---|---|---|---|---|---|---|---|---|---|---|---|---|---|---|---|---|---|---|
| ARE (%) | ARD (%) | EABS | ERRSQ | HYBRID | MAE | MPE (%) | MAPE | MPSD | NSD | RMSE | SEE | SEP (%) | SRE | χ2 | TIC | SD | DWT | |
| Freundlich | 5.94 | 11.90 | 6.68 | 13.78 | 0.99 | 1.34 | 12.01 | -0.009 | 0.086 | 166.01 | 1.66 | 2.14 | 14.97 | 0.57 | 1.04 | 0.25 | 1.71 | 1.21 |
| Langmuir | 1.55 | 2.86 | 1.70 | 0.87 | 0.07 | 0.34 | 2.90 | 0.005 | 0.006 | 41.76 | 0.42 | 0.54 | 3.77 | 1.65 | 0.07 | 0.06 | 0.11 | 1.68 |
| Temkin | 11.51 | 20.53 | 10.20 | 23.84 | 2.22 | 2.04 | 22.17 | -0.013 | 0.2463 | 218.35 | 2.18 | 2.82 | 19.69 | 0.64 | 2.40 | 0.33 | 4.93 | 1.38 |
| D–R | 3.93 | 6.60 | 4.44 | 8.07 | 0.47 | 0.88 | 7.27 | 0.058 | 0.0306 | 127.06 | 1.27 | 1.64 | 11.46 | 2.43 | 0.54 | 0.19 | 0.61 | 0.51 |
| Jovanovic | 8.12 | 15.67 | 8.92 | 26.12 | 1.83 | 1,78 | 15.93 | -0.016 | 0.1531 | 228.56 | 2.29 | 2.95 | 20.61 | 0.40 | 2.00 | 0.35 | 3.06 | 1.14 |
| H–J | 2.15 | 3.72 | 2.60 | 2.55 | 0.16 | 0.52 | 3.77 | -0.003 | 0.011 | 71.44 | 0.71 | 0.92 | 6.44 | 1.75 | 0.17 | 0.11 | 0.22 | 2.54 |
| F–H–H | 5.94 | 11.90 | 6.68 | 13.78 | 0.99 | 1.34 | 12.01 | -0.009 | 0.086 | 166.01 | 1.66 | 2.14 | 14.97 | 2.00 | 1.04 | 0.25 | 1.71 | 1.21 |
| Elovich | 8.87 | 18.76 | 9.85 | 23.70 | 2.08 | 1.97 | 18.19 | -0.021 | 0.224 | 217.71 | 2.18 | 2.81 | 19.63 | 0.49 | 1.97 | 0.33 | 4.48 | 1.59 |
| F–H | 2.15 | 4.22 | 0.01 | 2.29 ×10⁻⁵ | -0.0005 | 0.002 | 3.16 | -0.002 | 0.011 | 0.214 | 0.002 | 0.003 | -4.24 | 1.02 | -0.001 | 0.001 | 0.22 | 1.60 |
| F–G | 3.72 | 6.12 | 0.33 | 0.027 | -0.0232 | 0.065 | 6.45 | 0.012 | 0.029 | 7.32 | 0.073 | 0.095 | -5.00 | 0.94 | -0.02 | 0.083 | 0.58 | 1.52 |
| Kiselev | 18.85 | 23.45 | 4.63 | 5.13 | 1.162 | 0.925 | 30.04 | 0.017 | 0.386 | 101.25 | 1.013 | 1.307 | 19.06 | 5.97 | 1.42 | 0.22 | 7.72 | 1.44 |
| Hill–De Boer | 3.58 | 7.03 | 7.24 | 12.71 | -0.5884 | 1.448 | 7.13 | 0.001 | 0.031 | 159.43 | 1.594 | 2.058 | -7.02 | 3.36 | -0.59 | 0.28 | 0.61 | 1.48 |
| Hasley | 5.94 | 11.90 | 6.68 | 13.78 | 0.9929 | 1.336 | 12.01 | -0.009 | 0.086 | 166.01 | 1.66 | 2.14 | 14.98 | 0.38 | 1.04 | 0.25 | 1.71 | 1.21 |
| Khan | 1.41 | 2.43 | 1.26 | 0.62 | 0.0538 | 0.252 | 2.45 | 0.001 | 0.005 | 35.16 | 0.35 | 0.45 | 3.17 | 0.08 | 0.05 | 0.05 | 0.10 | 2.75 |
| Modified BET | 1.57 | 3.18 | 1.78 | 0.82 | 0.0689 | 0.356 | 3.18 | 0.002 | 0.006 | 40.50 | 0.41 | 0.52 | 3.65 | 23.49 | 0.07 | 0.06 | 0.12 | 1.77 |
Table 12: Computed values of the error functions for adsorption isotherms.
The DWT parameter shows the value of residual (i.e., the difference in value between each experimental data point and the model predicted value). Essentially, the relation between residual data is determined by this parameter. The value of Durbin-Watson statistic lies between 0 and 4 (Bello and Olafadehan 2022). In Table 10, 13 isotherms, except H–J and 3–p Khan isotherms, indicate positive autocorrelation in the residuals from a statistical regression analysis since
2 0 < < DWT
. There is no autocorrelation detected
in the sample if
$$ D W T = 2. $$
. But the H–J and 3–p Khan
isotherms indicate negative autocorrelation in the residuals
since their DWT values range from 2 to 4. Since all the
isotherms investigated in this study, except D-R isotherm,
have 1 > DWT
, they portend a good model since DWT
value must be at least 1.0 for a good model (Bello and Olafadehan 2022). However, judging by their relative 2 R values, the most fitted adsorption isotherm for correlating the equilibrium adsorption data of chromium (VI) ions on the synthesized composite adsorbent is Langmuir, though a thumb rule is that the test statistic values in the range of 1.5 to 2.5 are relatively normal.
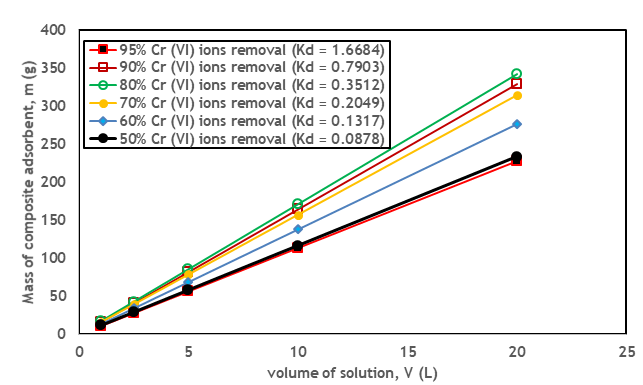
Since the Langmuir isotherm is determined to correlate the equilibrium adsorption data of chromium (VI) ions in this study, the mass of the composite adsorbent of chitosan– eggshell activated carbon needed to achieve certain percentage removal of adsorbate from solutions of varied volumes at ambient temperature of 30oC in a mono-solute batch reactor system is obtained by using Equations (12) and (13) in the Langmuir isotherms obtained in this study to yield Equation (52)
( ) ( )
1 1 100 R Vc K c R m q K c R
$$ i = \frac {R _ {C r} V c _ {0} \left[ 1 + K _ {L} c _ {0} \left(1 - R _ {C r} / 1 0 0\right) \right]}{1 0 0 q _ {\max } K _ {L} c _ {0} \left(1 - R _ {C r} / 1 0 0\right)} \tag {52} $$
and the results are presented in Figure 11, which shows
that the mass of the synthesized composite adsorbent
increases with volume of solution for 50–95% removal of
chromium (VI) ions from the synthetic wastewater. This can
be applied for the design of batch adsorption system for Cr
(VI) ions on the synthesized composite adsorbent.
0 0 Cr L Cr
100 1 100
0 max L Cr
Estimation of Kinetic Parameters for Chromium (VI) ions Adsorption on Composite Adsorbent of Chitosan-Eggshell Activated Carbon
Equally, the method of linear least squares was used to determine the inherent kinetic parameters of the 12 kinetic models investigated in this study. Table 11 shows the results obtained, as well as the values of Biot, Bi, coefficient of determination, 2 R , and 2 of the error functions while the remaining error functions’ values are presented in Table 12. The 2 R and error functions’ values are used to select the best kinetic model and thus identify the diffusion mechanism involved in adsorption process of chromium (VI) ions on the synthesized adsorbent. In Table 11, the value of the exponent, v , of the fractional power model is obtained as 0.0854, which is less than unity. This is indicative of the time-dependence characteristic of Cr (VI) ions adsorption on the synthesized composite adsorbent of this study. Relatively high values of regression coefficients, 2 R = 0.9763, 2 R = 0.9763, and 2 R = 0.9968, which are close to unity, are obtained for fractional power law, Kuo–Loise and Elovich kinetic models respectively, and thus they provide a satisfactory suitability to the kinetic data of chromium (VI) ions on the synthesized composite adsorbent of this study. As presented in Table 11, it is worthy of note that higher 2 R values are obtained with two kinetic models. The Lagergren pseudo first–order kinetic model reveals 2 R value of 0.9214, which is not close to unity and also less than the values obtained for some kinetic models, as presented in Table 11. Equally, the predicted value of eq (= 2.6749 mg/g) using the Lagergren pseudo first–order kinetic model is not in excellent agreement with the experimental value of eq (= 9.7943 mg/g). Hence, the Lagergren pseudo first–order kinetic model is not suitable to predict the kinetic data of Cr (VI) ions on the synthesized composite adsorbent of this study.
| Kinetic Models | Parameters | Values |
|---|---|---|
| Fractional power model | v mg/(g minv) | 0.0854 |
| k f mg/(g minv) | 6.0672 | |
| Bi | 1.0002 | |
| R2 | 0.9763 | |
| ARE (%) | 0.2933 | |
| ARD (%) | 0.7814 | |
| Lagergren pseudo first–order | k 1 (min–1) | 0.0225 |
| q (mg/g) e | 2.6749 | |
| Bi | 0.9475 | |
| R2 | 0.9214 | |
| ARE (%) | 1.8804 | |
| ARD (%) | 5.5432 | |
| Pseudo second–order | k 2 (g/(mg min)) | 1.2261×10⁻² |
| q (mg/g) e | 9.8135 | |
| Bi | 1.0015 | |
| R2 | 0.9994 | |
| ARE (%) | 0.030 | |
| ARD (%) | 0.0748 | |
| Kuo–Loise | α mF | 11.7096 |
| k mF (L/(g min −α mF )) | 0.8966 | |
| Bi | 0.9978 | |
| R2 | 0.9763 | |
| ARE (%) | 0.2903 | |
| ARD (%) | 0.7363 | |
| Blanchard | α B (g/mg) | –0 .1364 |
| k B (g/(mg min)) | 0.0195 | |
| Bi | 0.9987 | |
| R2 | 0.9126 | |
| ARE (%) | 1.0432 | |
| ARD (%) | 1.9549 | |
| Elovich | α | 1.6395×10³ |
| β | 1.3693 | |
| Bi | 0.9968 | |
| R2 | 0.9698 | |
| ARE (%) | 0.3259 | |
| ARD (%) | 0.8244 | |
| Avrami | n AV | 0.3347 |
| k (min−n AV AV ) | 1.6977 | |
| Bi | 1.0545 | |
| R2 | 0.9190 | |
| ARE (%) | 2.0867 | |
| ARD (%) | 5.1439 | |
| Sobkowsk–Czerwi | k (min-1) SC | -625 |
| Bi | 1,0027 | |
| R2 | 0.9435 | |
| ARE (%) | 0.3421 | |
| ARD (%) | 0.8394 | |
| Behnajady–Modirshahla–Ghanbery | b | 23.72 |
| m | -863.74 | |
| Bi | 0.9543 | |
| R2 | 0.9029 | |
| ARE (%) | 4.1795 | |
| ARD (%) | 8.1946 | |
| IPD | k IPD | 0.1973 |
| C | 6.9991 | |
| Bi | 1.0009 | |
| R2 | 0.9918 | |
| ARE (%) | 0.1669 | |
| ARD (%) | 0.3808 | |
| Diffusion–Chemisorption | q e (mg/g) | 10.5153 |
| k DC (mg/(g min–1)) | 6.3898 | |
| Bi | 1.0003 | |
| R2 | 0.9972 | |
| ARE (%) | 0.2636 | |
| ARD (%) | 0.6666 |
Table 13: Values of the inherent parameters in the kinetic models for chromium (VI) ions adsorption The Blanchard and Avrami kinet
Table 11: Values of the inherent parameters in the kinetic models for chromium (VI) ions adsorption The Blanchard and Avrami kinetic models reveal 2 R values of 0.9126 and 0.9190 respectively, which are not close to unity and thus these two isotherms are unsuitable to predict the kinetic data of Cr (VI) ions on the synthesized composite adsorbent of this study.
Though the Sobkowsk–Czerwi kinetic model reveals 2 R value of 0.9435, which can be considered at times to be close to unity, a constant of 1.2584, which ought to be 1 in the model, does not present the model as a candidate for a fairly suitability in correlating the kinetic data of Cr (VI) ions on the synthesized composite adsorbent of this study.
The Behnajady–Modirshahla–Ghanbery (BMG) kinetic model reveals the lowest 2 R value of 0.9029 amongst all the kinetic models investigated in this study and hence, it is the worst in correlating the kinetic data of Cr (VI) ions on the synthesized composite adsorbent of this study.
The pseudo second-order kinetic model performs excellently in correlating the kinetic data of Cr (VI) ions on the synthesized composite adsorbent of this study since its
2 R value of 0.9994 is approximately unity and excellent agreement is achieved between its predicted eq value of 9.8135 mg/g and the experimental eq value of 9.7943 mg/g, with % error being ± 0.20, which is less than the permissible error margin of ± 5%. Hence, using the 2 R values, the increasing order of the kinetic models investigated to correlate the kinetic data of Cr (VI) ions on the synthesized composite adsorbent of this study is BMG < Blanchard < Avrami < Lagergren pseudo first–order < Sobkowsk–Czerwi < fractional power, Kuo–Loise < Elovich < pseudo second– order.
| Kinetic model | Values of Error Functions | |||||||||||||||
|---|---|---|---|---|---|---|---|---|---|---|---|---|---|---|---|---|
| EABS | ERRSQ | HYBRID | MAE | MPE (%) | MAPE | MPSD | NSD | RMSE | SEE | SEP (%) | SRE | χ2 | TIC | SD | DWT | |
| Fractional power law | 0.6639 | 0.0593 | 0.0071 | 0.0664 | 0.7829 | 1.5168 ×10⁻⁴ | 8.5266 ×10⁻⁴ | 7.0150 | 0.0770 | 0.0861 | 0.8837 | 0.1235 | 0.0071 | 0.0044 | 0.0085 | 1.4951 |
| Lagergren pseudo first- order | 3.8665 | 1.9195 | 0.2204 | 0.4833 | 5.2338 | -0.0554 | 0.0254 | 48.9829 | 0.4898 | 0.5656 | 5.5938 | 0.7507 | 0.2082 | 0.0272 | 0.3169 | 0.0195 |
| Pseudo second-order | 0.5304 | 0.0456 | 0.0052 | 0.06663 | 0.7452 | -0.0028 | 5.8450 ×10⁻⁴ | 7.5525 | 0.0755 | 0.0872 | 0.8625 | 0.0871 | 0.0051 | 0.0043 | 0.0073 | 0.9629 |
| Kuo-Loise | 0.5116 | 0.0405 | 0.0047 | 0.0639 | 0.7344 | -0.0022 | 5.4283 ×10⁻⁴ | 7.1134 | 0.0711 | 0.0821 | 0.8123 | 0.0836 | 0.0047 | 0.0041 | 0.0068 | 0.5272 |
| Blanchard | 1.3232 | 0.4291 | 0.0521 | 0.1654 | 1.9952 | -0.0017 | 0.0063 | 23.1585 | 0.2316 | 0.2674 | 2.6447 | 0.1058 | 0.0545 | 0.0132 | 0.0793 | 0.8329 |
| Elovich | 0.5715 | 0.0509 | 0.0059 | 0.0714 | 0.8210 | -0.0032 | 6.8618 ×10⁻⁴ | 7.9785 | 0.0798 | 0.0921 | 0.9111 | 0.0928 | 0.0059 | 0.0045 | 0.0086 | 0.4383 |
| Avrami | 3.6693 | 1.9874 | 0.2198 | 0.4587 | 5.3694 | 0.0514 | 0.0243 | 49.8423 | 0.4984 | 0.5755 | 5.6920 | 0.5982 | 0.2353 | 0.0292 | 0.3042 | 0.0330 |
| Sobkowsk- Czerwi | 0.5799 | 0.0553 | 0.0064 | 0.0725 | 0.8421 | 0.0027 | 7.4448 ×10⁻⁴ | 8.3154 | 0.0832 | 0.0960 | 0.9496 | 0.0899 | 0.0064 | 0.0047 | 0.0093 | 0.9922 |
| BMG | 5.3617 | 14.5521 | 1.8138 | 0.6702 | 6.4205 | -0.0578 | 0.2261 | 134.8711 | 1.3487 | 1.5574 | 15.4022 | 0.4468 | 1.2690 | 0.0747 | 2.8263 | 1.4117 |
| IPD | 0.2641 | 0.0130 | 0.0015 | 0.0330 | 0.3806 | 8.6921 ×10⁻⁴ | 1.7928 ×10⁻⁴ | 4.0337 | 0.0403 | 0.0466 | 0.4606 | 0.0367 | 0.0015 | 0.0023 | 0.0022 | 1.6672 |
| Diffusion- chemisorption | 0.4633 | 0.0326 | 0.0038 | 0.0579 | 0.6675 | 2.3852 ×10⁻⁴ | 4.4229 ×10⁻⁴ | 6.3851 | 0.0639 | 0.0737 | 0.7292 | 0.0755 | 0.0038 | 0.0036 | 0.0055 | 0.9568 |
Table 14: Computed values of the error functions for kinetic models.
The diffusion mechanism involved in the adsorption process of chromium (VI) ions on the synthesized adsorbent is identified by the consideration of intraparticle diffusion (IPD) (or Weber–Morris), Boyd and diffusion–chemisorption models. A high coefficient of determination, 2 R , value of 0.9918, which is close to unity, is obtained for IPD model. The higher the C value in the model, the larger the boundary layer thickness and conversely [113]. However, a high value of C (= 6.9991) is obtained, which ought to be zero if IPD model could be used to describe the adsorption kinetics of Cr (VI) ions on the synthesized composite adsorbent of this study. Hence, it can be deduced that the intraparticle diffusion along the pores of the synthesized composite adsorbent is not the rate–determining (or controlling) in the adsorption process of Cr (VI) ions having a small degree of a boundary layer diffusion. It can thus be misregarded in arriving at a robust comprehension of the kinetic characteristic of the adsorption process being investigated. Hence, the kinetic data of Cr (VI) ions on the synthesized composite adsorbent of this study are further investigated via the Boyd model, given in Eq (20)/(21), chiefly because of the limitations of the inability of the pseudo second–order kinetic model to accurately predict the governing step in the adsorption process. The value of B is computed according to Equation (17) or (18) for each value of ) (t FB , depending on the conditions for the experimental run, and then plotted against time, t, to construct the Boyd plot [16, 55, 114] for the Cr (VI) ions adsorption. The distinction between intraparticle transport-controlled and external transport (film diffusion) rates of adsorption is explored using the linearity of the plot [16, 55, 115]. The adsorption process is controlled by film diffusion if a straight line that does not pass through the origin is obtained; otherwise, it is limited by intraparticle diffusion [16, 55, 92, 116, 117]. Since Boyd plot obtained, though not depicted here, is neither linear nor passes through the origin, it implies that film diffusion is the rate-limiting in the adsorption process of Cr (VI) ions on the synthesized composite adsorbent.
This is in consonance with the earlier result aforementioned here that IPD model is not the rate–determining (or controlling) in the adsorption process of Cr (VI) ions.
The diffusion–chemisorption model reveals 2 R value of 0.9972, which is close to unity, and predicted eq value of 10.5153 mg/g, which is in good agreement with the experimental eq value of 9.7943 mg/g. Hence, the Cr (VI) adsorption on the synthesized composite adsorbent of this study is under the influences of both film diffusion, as determined using Boyd kinetics, and chemisorption (a chemical adsorption) that involves valance forces through ion exchange between the Cr (VI) ions and the active binding sites that exist in the synthesized composite adsorbent.
In Table 12, for all the kinetic models investigated in this study, the computed bias, Bi, values are somewhat close to unity, which are indicative of the fact that the errors between the experimental and predicted equilibrium kinetic data of chromium (VI) ions uptake are normally distributed. The values of the error functions reveal that almost all the kinetic models investigated are suitable to correlate the kinetic data of Cr (VI) ions on the synthesized composite adsorbent of this study if the error margin was within ± 10%. However, the values of the error functions computed for BMG kinetic model, in comparison with other kinetic models, as presented in Table 12, buttress the previous conclusion reached that BMG is the worst in correlating the kinetic data of Cr (VI) ions. Moreover, some kinetic models are rejected based on their qualitative and quantitative descriptions as enumerated previously, even though the values of their error functions are small. Hence, it can be concluded that pseudo second- order kinetics is reliably suitable to correlate the kinetic data of Cr (VI) ions on the synthesized composite adsorbent of this study. The relatively low values of the error functions obtained for diffusion–chemisorption kinetic model lend credence to its suitability to describe vividly the kinetics of the adsorption system investigated herein as chemisorption.
The extremely low values of TIC obtained for all the kinetic models investigated, as revealed in Table 12, show a certain degree of the predictive powers of these kinetics. Equally, all the kinetic models investigated show positive autocorrelation in the residuals from a statistical regression analysis since 2 0 < < DWT . However, judging from the highest value of 2 R for the pseudo second–order kinetics coupled with its relative low values of the error functions, it is adjudged to be feasible for the prediction of the kinetic data of chromium (VI) ions on the synthesized composite adsorbent.
Thermodynamic Studies of Cr (VI) Ions Adsorption The Cr (VI) ions adsorption on the synthesized composite adsorbent increases with increase in temperature from 303 to 333 K. This was achieved at a volume of 100 mL, a pH of 6
and an adsorbent dosage of 1.5 g. The increased capacity of adsorption can be attributed to the increased pore size and adsorbent surface activation with temperature. An increase in temperature also reduced the solubility of the Cr (VI) ions, hence increasing adsorption. This is further explained by an increase in the number of molecules acquiring enough energy to undergo interaction with an active site at the adsorbent surface, therefore, attributing the increase in adsorption capacity with an increase in temperature partially to chemisorption. The spontaneity and feasibility of the adsorption of Cr (VI) ions on the synthesized composite adsorbent is determined by the value of 0 G ∆ . In Table 13, the values of 0 G ∆ at temperatures between 303 and 333 K are negative. Hence, the adsorption of Cr (VI) ions is spontaneous in nature since positive values of 0 G ∆ are indications of the non-spontaneity of the adsorption process. In addition, the adsorption process of Cr (VI) ions can be described to be exergonic for negative 0 G ∆ values. The positive value of 0 H ∆ in Table 13 is indicative of the endothermic adsorption process of chromium (VI) ions since the negative value of
0 H ∆ indicates exothermicity of the adsorption process. For the measure of the degree of randomness, the positive value of 0 S ∆ obtained for the adsorption of Cr (VI) ions gives an impression of high affinity of Cr (VI) ions (adsorbate) on the synthesized composite adsorbent; much randomness at the interface of the adsorbent/adsorbate thus leading to significant changes in the structural framework of the two parties [118]. However, if 0 S ∆ were nearly zero, this implies equilibrium conditions were established during the adsorption experiment and the limiting value of zero being reached only by a reversible process.
| Temperature (K) | ∆G0 (J/mol) | ∆H0 (J/mol) | ∆S0 (J/(mol K)) | R2 |
|---|---|---|---|---|
| 303 | –2.0287×10³ | 1.7293×10³ | 63.7684 | 0.9999 |
| 313 | –2.6684×10³ | |||
| 323 | –3.3041×10³ | |||
| 333 | –3.9418×10³ |
Table 15: Values of thermodynamic parameters for adsorption of Cr (VI) ions on synthesized composite adsorbent at different temper
Conclusion
Composite adsorbent of chitosan–eggshell activated carbon was synthesized using chitosan from St. Peter’s fish scales and eggshell for the adsorption of chromium (VI) ions from simulated industrial wastewater. The optimum values of 24.14% and 86.40% for the yield and DDA of the extracted chitosan from the St. Peter’s fish scales using response surface methodology (RSM) were in excellent agreements with their respective experimental values of 24.40% and 86.31%, with % error being ± 1.07 and ± 0.10% respectively at 9.5% NaOH concentration, deacetylation temperature of 88oC and deacetylation time of 1.4 h. Equally, the design of experiments give optimum values of 35.02% and 1213 m2/g for the yield of eggshell activated carbon and its surface area, which are in excellent agreement with their respective experimental values of 36.67% and 1207 m2/g , with % error being ± 4.45 and ± 0.5% respectively, at impregnation ratio of 2.65, activation temperature of 496°C, and activation time of 70 min.
The extracted chitosan, eggshell activated carbon and chitosan–eggshell activated carbon were characterized using analytical techniques of FTIR, SEM, EDS, XRD. Comprehensive isothermic, kinetic and thermodynamic studies of Cr6+ ions adsorption on the synthesized composite adsorbent were carried out. The 2–p Langmuir isotherm with maximum adsorption capacity of 4.0717 mg/g, and the pseudo second– order kinetic model are the most suitable for correlating the adsorption equilibrium and kinetic data of Cr (VI) ions adsorption respectively, based on the highest value of 2 R , and lowest values of error functions investigated in this study.
Equally, the adsorption of Cr (VI) ions on the synthesized composite adsorbent was determined to be film-diffusion controlled and chemisorbed. The thermodynamic studies reveal that Cr (VI) ions adsorption on the synthesized composite adsorbent is spontaneous in nature and exergonic since 0 G ∆ values are negative, endothermic since 0 H ∆ = +1.7293×10³ J/mol, and 0 S ∆ = +63.7684 J/(mol K) indicating feasibility of the adsorption process with high affinity of adsorbate on adsorbent.
Statements and Declarations
Funding
The authors received no specific funding for this work. Hence, the corresponding author confirms that there are no financial and personal relationships with other people or organizations that could inappropriately influence this study.
Data Availability
Datasets generated or analyzed during the current study will be made available on request.
Compliance with Ethical Standards
Ethical The current study did not include any human or animal subjects. Thus, this study is not subject to an ethics review committee and does not require any informed consent.
Conflict of Interest
The authors declare that they have no known competing financial interests or personal relationships that could have appeared to influence the work reported in this paper.
References
-
Krishna D, Sree RP (2014) Artificial neural network and response surface methodology approach for modeling and optimization of chromium (VI) adsorption from waste water using ragi husk powder. Indian Chemical Engineer 55(3): 1-23.
-
Kowalshi Z (1994) Treatment of chromic tannery wastes. Journal of Hazardous Materials 37(1):137-144.
-
Sikaily AE, Nemr AE, Khaled A, Abdelwahab O (2007) Removal of toxic chromium from waste water using green alga _Ulva lactuca_ and its activated carbon. Journal of Hazardous Materials 148(1-2): 216-228.
-
Li H, Li Z, Liu T, Xiao X, Peng Z, Deng L (2008) A novel technology for biosorption and recovery hexavalent chromium in wastewater by bio-functional magnetic beads. Bioresource Technology 99(14): 6271–6279.
-
Das AK (2004) Micellar effect on the kinetics and mechanism of chromium (VI) oxidation of organic substrates. Coordination Chemistry Reviews 248(1-2): 81-99.
-
Gomez V, Callo MP (2006) Chromium determination and speciation since 2000. TrAC–Trends in Analytical Chemistry 25(10): 1006-1015.
-
World Health Organization (2004) Guidelines for Drinking Water Quality. 3rd(Edn.), Geneva 1: 334.
-
Zhou X, Korenaga T, Takahashi T, Moriwake T, Shinoda S (1993) A process monitoring/ controlling system for the treatment of waste water containing chromium (VI). Water Research 27(6): 1049-1054.
-
Seaman JC, Bertsch PM, Schwallie L (1999) In-situ Cr (VI) reduction within coarse-textured oxide coated soil and aquifer systems using Fe (II) solutions. Environmental Science & Technology 33(6): 938-944.
-
Chakravathi AK, Chowadary SB, Chakrabarty S, Chakrabarty T, Mukherjee DC (1995) Liquid membrane multiple emulsion process of chromium (VI) separation from waste waters. Colloids and Surfaces A: Physicochemical and Engineering Aspects 103(1-2): 59- 71.
-
Tiravanti G, Petruzzelli D, Passino R (1997) Pretreatment of tannery wastewaters by an ion exchange process for Cr (III) removal and recovery. Water Science & Technology 36(2-3): 197-207.
-
Pagilla KR, Canter LW (1999) Laboratory studies on remediation of chromium-contaminated soils. Journal of Environmental Engineering 125(3): 243-248.
-
Kongsricharoern N, Polprasert C (1996) Chromium removal by a bipolar electro-chemical precipitation process. Water Science & Technology 34(9): 109-116.
-
Huang SD, Fann CF, Hsiech HS (1982) Foam separation of chromium (VI) from aqueous solution. Journal of Colloid and Interface Science 89(2): 504-513.
-
Aksu Z, Ozer D, Ekiz HI, Kutsal T, Calar A (1996) Investigation of biosorption of chromium (VI) on _Cladophora crispata_ in two-staged batch reactor. Environmental Technology 17(2): 215-220.
-
Olafadehan OA, Akpo OY, Enemuo O, Amoo KO, Abatan OG (2018) Equilibrium, kinetic and thermodynamic studies of biosorption of zinc ions from industrial wastewater using derived composite biosorbents from walnut shell. African Journal of Environmental Science & Technology 12(9): 335-356.
-
Adesola B, Ogundipe K, Sangosanya KT, Akintola BD, Oluwa A, et al. (2016) Comparative study on the biosorption of Pb(II), Cd(II) and Zn(II) using Lemon grass (Cymbopogon citratus): kinetics, isotherms and thermodynamics. Chemical International 2(2): 89-102.
-
Babarinde A, Onyiaocha GO (2016) Equilibrium sorption of divalent metal ions onto groundnut (Arachis hypogaea) shell: kinetics, isotherm and thermodynamics. Chemical International 2(1): 37-46.
-
Iqbal M, Bhatti IA (2015) Gamma radiation/H2O2 treatment of a nonylphenol ethoxylates: degradation, cytotoxicity, and mutagenicity evaluation. Journal of Hazardous Materials 299: 351-360.
-
Iqbal M, Iqbal N, Bhatti IA, Ahmad N, Zahid M (2016) Response surface methodology application in optimization of cadmium adsorption by shoe waste: a good option of waste mitigation by waste. Ecological Engineering 88: 265-275.
-
Iqbal M, Khera RA (2015) Adsorption of copper and lead in single and binary metal system onto Fumaria indica biomass. Chemical International 1(3): 157b-163b.
-
Mushtaq M, Bhatti HN, Iqbal M, Noreen S (2016) Eriobotrya japonica seed biocomposite efficiency for copper adsorption: isotherms, kinetics, thermodynamic and desorption studies. Journal of Environmental Management 176: 21-33.
-
Rashid A, Bhatti HN, Iqbal M, Noreen S (2016) Fungal biomass composite with bentonite efficiency for nickel and zinc adsorption: a mechanistic study. Ecological Engineering 91: 459-471.
-
Dash SN, Murthy CVR (2010) Preparation of carbonaceous heavy metal adsorbent from Shorea robusta leaf litter using phosphoric acid impregnation. International Journal of Environmental Science 1(3): 296-313.
-
Foo KY, Hameed BH (2010) Insights into the modelling of adsorption isotherm systems. Chemical Engineering Journal 156(1): 2-10.
-
Volesky B (1990) Biosorption of heavy metals. In: bioadsorbents and biosorption of heavy metals. In: Volesky (Ed.) B, CRC Press, Boca Raton, FL 221-238.
-
Park D, Yun YS, Park JM (2010) The past, present and future trends of biosorption. Biotechnology and Bioprocess Engineering 15: 86-102.
-
Mohan D, Pittman CU (2006) Activated carbon and low- cost adsorbents for remediation of tri- and hexavalent chromium from water. Journal of Hazardous Materials 137(2): 762-811.
-
Park D, Yun YS, Lee DS, Lim SR, Park JM (2006) Column study on Cr (VI)-reduction using the brown seaweed ecklonia biomass. Journal of Hazardous Materials 137(3): 1377-1384.
-
El-Shafey EI (2005) Behavior of reduction–sorption of chromium (VI) from an aqueous solution on a modified sorbent from rice husk. Water, Air, and Soil Pollution 163: 81-102.
-
Hasan SH, Singh KK, Prakash O, Talat M, Ho YS (2008) Removal of Cr (VI) from aqueous solutions using agricultural waste maize bran. Journal of Hazardous Materials 152(1): 356-365.
-
Abhishek K, Raj KR, Arora JK, Srivastava S (2011) ANN modeling on predictions of biosorption efficiency of _Zea_ _mays_ for the removal of Cr (III) and Cr (VI) from waste water. International Journal of Mathematics Trends and Technology 2(1): 23-29.
-
Zarur JN, Tovar CT, Ortíz AV, Acevedo D, Tovar RT (2018) Thermodynamics, kinetics and equilibrium adsorption of Cr (VI) and Hg (II) in aqueous solution on corn husk (Zea Mays). International Journal of ChemTech Research 11(05): 265-280.
-
Gupta S, Babu BV (2009) Utilization of waste product (tamarind seeds) for the removal of Cr (VI) from aqueous solutions: equilibrium, kinetics and regeneration studies. Journal of Environmental Management 90(10): 3013-3022.
-
Qaiser S (2009) Biosorption of lead (II) and chromium (VI) on groundnut hull: equilibrium, kinetics and thermodynamics study. Electronic Journal of Biotechnology 12(4).
-
Song WX, Zhong LH, Rong TS (2009) Removal of chromium (VI) from aqueous solution using walnut hull. Journal of Environmental Management 90(2): 721-729.
-
Krishna D, Sree RP (2012) Removal of chromium (VI) from aqueous solution by _Limonia acidissima_ hull powder as adsorbent. Journal on Future Engineering and Technology 7(4): 27-38.
-
Kebir M, Tahraoui H, Chabani M, Trari M, Noureddine N, et al. (2023) Water cleaning by a continuous fixed bed column for Cr (VI) Eco-adsorption with green adsorbent- based biomass: an experimental modelling study. Processes 11(2): 363.
-
Bakshi PS, Selvakumar D, Kadirvelu K, Kumar NS (2022) Applications of chitin and chitosan as natural biopolymer: potential sources, pretreatments, and degradation pathways. Biomass Conversion and Biorefinery 12(2): 1005-1021.
-
(2024) Food and Agriculture Organization of the United Nations.
-
Iber BT, Kasan NA, Torsabo D, Omuwa JW (2022) A review of various sources of chitin and chitosan in nature. Journal of Renewable Materials 10(4): 1097-1123.
-
Adekanmi AA, Dapo OA, Adeniyi AS, Olaniran VO, Akinkunmi OO, et al. (2020) Production and characterization of chitosan from fish scales. International Journal of Academic Multidisciplinary Research 4(6): 117-129.
-
Bahavarnia F, Hasanzadeh M, Bahavarnia P, Shadjou N (2024) Advancements in application of chitosan and cyclodextrins in biomedicine and pharmaceutics: recent progress and future trends. RSC Advances 14: 13384- 13412.
-
Jang M, Kong B, Jeong Y, Lee CH, Nah J (2004) Physicochemical characterization of α-chitin, β-chitin, and γ-chitin separated from natural resources. Journal of Polymer Science Part A: Polymer Chemistry 42(14): 3423-3432.
-
Cai J, Yang J, Du Y, Fan L, Qiu Y, et al. (2006) Enzymatic preparation of chitosan from the waste _Aspergillus níger_ mycelium of citric acid production plant. Carbohydrate Polymers 64(2): 151-157.
-
Amuda OS, Giwa AA, Bello IA (2007) Removal of heavy metal from industrial wastewater using modified activated coconut shell carbon. Biochemical Engineering Journal 36(2): 174-181.
-
Nomanbhay SM, Palanisamy K (2005) Removal of heavy metal from industrial wastewater using chitosan coated oil palm shell charcoal. Electronic Journal of Biotechnology 8(1): 43-53.
-
Muzzarelli RAA (1997) Some modified chitosan and their niche applications. Chitin Handbook, European Chitin Society, Italy, 47-52.
-
Schmuhl R, Krieg HM, Keizer K (2001) Adsorption of Cu (II) and Cr (VI) ions by chitosan: kinetics and equilibrium studies. Water South Africa 27(1): 1-8.
-
Vold IMN, Vårum KM, Guibal E, Smidsod O (2003) Binding of ions to chitosan - selectivity studies. Carbohydrate Polymers 54(4): 471-477.
-
Karthikeyan R, Vijayalakshmi S, Balasubramanian T (2004) Seasonal distribution of heavy metals in the sediments from Uppanar Estuary (East coast of India). Journal of Aquatic Biology 19: 119-122.
-
Bamgbose JT, Adewuyi S, Bamgbose O, Adetoye AA (2010) Adsorption kinetics of cadmium and lead by chitosan. African Journal of Biotechnology 9(17): 2560- 2565.
-
Wan MW, Kan CC, Rogel BD, Dalida MLP (2010) Adsorption of copper (II) and lead (II) ions from aqueous solutions on chitosan coated sand. Carbohydrate Polymers 80(3): 891-899.
-
Olafadehan OA, Amoo KO, Oyedeko KFK, Bello AM, Bello VE, et al. (2022) Binary adsorption of phenol and 2-chlorophenol on chitosan derived from pink shrimp shell. Petroleum and Petrochemical Engineering Journal 6(1): 1-18.
-
Olafadehan OA, Bello VE, Amoo KO, Bello AM (2022) Isotherms, kinetic and thermodynamic studies of methylene blue adsorption on chitosan flakes derived from African giant snail shell. African Journal of Environmental Science & Technology 16(1): 37-70.
-
Wu Y, Luo H, Wang H, Wang C, Zhang J, et al. (2013) Adsorption of hexavalent chromium from aqueous solutions by graphene modified with cetyltrimethylammonium bromide. Journal of Colloid and Interface Science 394: 183-191.
-
Ding P, Huang K, Li G, Liu Y, Zeng W (2006) Kinetics of adsorption of Zn (II) ion on chitosan derivatives. International Journal of Biological Macromolecules 39(4-5): 222–227.
-
Mohan D, Singh KP (2002) Single- and multi-component adsorption of cadmium and zinc using activated carbon derived from bagasse – an agricultural waste. Water Research 36(9): 2304-2315.
-
Yakout SM, Daifullah AAM, El-Reefy SA (2013) Adsorption of naphthalene, phenanthrene and pyrene from aqueous solution using low-cost activated carbon derived from agricultural wastes. Adsorption Science & Technology 31(4): 293-302.
-
Song C, Wu S, Cheng M, Tao P, Shao M, et al. (2013) Adsorption studies of coconut shell carbons prepared by KOH activation for removal of lead (II) from aqueous solutions. Sustainability 6(1): 86-98.
-
Sedghi A, Mafifard N, Mahjobi A (2016) Optimization of activated carbons fabricated from agricultural wastes. Indian Journal of Fundamental and Applied Life Sci 6(S1): 481-493.
-
Akuso SA, Ajinomoh CS, Olawale AS, Abubakar G, Ayilara SI, et al. (2019) Optimization of activated carbon preparation from corncob for wastewater treatment. Nigerian Research Journal of Chemical Science 6: 155- 166.
-
Onawumi OOE, Sangoremi AA, Bello OS (2021) Preparation and characterization of activated carbon from groundnut and egg shells as viable precursors for adsorption. Journal of Applied Science & Environmental Management 25(9): 1707-1713.
-
Menya E, Olupot PW, Storz H, Lubwama M, Kiros Y (2018) Production and performance of activated carbon from rice husks for removal of natural organic matter from water: A review. Chemical Engineering Reseach and Design 129: 271-296.
-
Hassan Z, Abdul Jabbar M (2020) Utilization of eggshell and activated carbon as adsorbents for removal salicylic acid from aqueous solution. Kufa Journal of Engineering 11(2): 1-9.
-
Mittal A, Mittal J, Malviya A, Gupta VK (2010) Removal and recovery of Chrysoidine Y from aqueous solutions by waste materials. Journal of Colloid and Interface Science 344(2): 497-507.
-
Harripersadth C (2021) Evaluating the performance of an eggshell-bagasse biosorption system in removing lead and cadmium from aqueous solutions. MEng Thesis, Department of Chemical Engineering, Durban University of Technology.
-
Ahmed MJ, Hameed BH, Hummadi EH (2020) Review on recent progress in chitosan/chitin-carbonaceous material composites for the adsorption of water pollutants. Carbohydrate Polymers 116690.
-
Czechowska-Biskup R, Wach RA, Rosiak JM, Ulański P (2018) Procedure for determination of the molecular weight of chitosan by viscometry. Progress on Chemistry and Application of chitin and its derivatives 23: 45-54.
-
Paul HC, Logde PT (2007) Polymer Chemistry. 2nd(Edn.), Boca Raton, CRC, pp: 336-339.
-
Alzaydian AS (2009) Adsorption of methylene blue from aqueous solution onto a low-cost natural Jordanian Tripoli. American Journal of Applied Science 6(6): 1047- 1058.
-
Xie J, Li C, Chi L, Wu D (2013) Chitosan modified zeolite as a versatile adsorbent for the removal of different pollutants from water. Fuel 103: 480-485.
-
Freundlich HMF (1906) Uber die Adsorption in Losungen. Zeitschrift für Physikalische Chemie 57: 385-470.
-
Langmuir I (1918) The adsorption of gases on plane surfaces of glass, mica and platinum. Journal of American Chemical Society 40(9): 1361-1403.
-
Olafadehan OA (2021) Fundamentals of Adsorption Processes. LAP Lambert Academic Publishing, OmniScriptum DUE GmbH.
-
Temkin MI, Pyzhev V (1940) Kinetics of ammonia synthesis on promoted iron catalyst. Acta Physicochimica 12: 327-356.
-
Weber TW, Chakravorti RK (1974.) Pore and solid diffusion models for fixed-bed adsorbers. AIChE Journal 20(2): 228-238.
-
Hill TL (1946) Statistical mechanics of multimolecular adsorption II. Localized and mobile adsorption and absorption. The Journal of Chemical Physics 14(7): 441- 453.
-
Hill TL (1962) An Introduction to Statistical Thermodynamics. Addison-Wesley, Reading, MA.
-
De Boer JH (1953) The Dynamical character of adsorption, Oxford University Press, Oxford, England.
-
Tornquist A, Valencia E, Alzamora L, Cortes J (1978) The Hill-de Boer equation in the adsorption of water on quartz. Journal of Colloid and Interface Science 66(3): 415-420.
-
Ayawei N, Ekubo AT, Wankasi D, Dikio ED (2015) Adsorption of Congo red by Ni/Al-CO3: equilibrium, thermodynamic and kinetic studies. Oriental Journal of Chemistry 31(30): 1307-1318.
-
Amrhar O, Nassali H, Elyoubi MS (2015a) Two and three- parameter isothermal modeling for adsorption of crystal violet dye onto natural Illitic clay: nonlinear regression analysis. Journal of Chemical and Pharmaceutical Research 7(9): 892-903.
-
Amrhar O, Nassai H, Elyoubi MS (2015b) Application of nonlinear regression analysis to select the optimum adsorption isotherm for methylene blue adsorption onto natural Illitic clay. Bulletin de la Société Royale des Sciences de Liège 84: 116-130.
-
Ebadi A, Soltan Mohammadzadeh JS, Khudiev A (2009) What is the correct form of BET isotherm for modeling liquid phase adsorption? Adsorption 15(1): 65-73.
-
Mahmoud ME, Nabil GM, El-Mallah NM, Bassiouny HI, Kumar S, et al. (2016) Kinetics, isotherm, and thermodynamic studies of the adsorption of reactive red 195 A dye from water by modified switchgrass biochar adsorbent. Journal of Industrial and Engineering Chemistry 37: 156-167.
-
Zhai Y, Wei X, Zeng O, Zhang D, Chu K (2004) Study of adsorbent derived from sewage sludge for the removal of Cd2+, Ni2+ in aqueous solutions. Separation Purification and Technology 38(2): 191-200.
-
Feng X, Liu Y, Liu H (2022) RSM, ANN-GA and ANN-PSO modelling of SDBS removal from grey water in rural area via Fe2O3–coated volcanic rocks. RSC Advances 12: 6265- 6278.
-
Muslim WA, Albayati TM, Al-Nasri SK (2022) Decontamination of actual radioactive waste water containing 137Cs using bentonite as a natural adsorbent: equilibrium, kinetics, and thermodynamics studies. Scientific Reports 12(13837): 1-13.
-
Morrison RT, Boyd RN (2004) Organic Chemistry, Pearson Education, Singapore.
-
Castillejos-López E, Rodríguez-Ramos I, Sánchez MS, Muñoz V, Guerrero Ruiz A (2011) Phenol adsorption from water solutions over microporous and mesoporous carbon surfaces: a real time kinetic study. Adsorption 17: 483-488.
-
El-Khaiary MI, Malash GF (2011) Common data analysis errors in batch adsorption studies. Hydrometallurgy 105(3-4): 314-320.
-
Yeddou AR, Nadjemi B, Halet F, Ould-Dris A, Capart R (2010) Removal of cyanide in aqueous solution by oxidation with hydrogen peroxide in presence of activated carbon prepared from olive stones. Minerals Engineering 23(1): 32-39.
-
Blanchard G, Maunaye M, Martin G (1984) Removal of heavy metals from waters by means of natural zeolites. Water Research 18(12): 1501-1507.
-
Kolmogorov A, Petrovskii I, Piskunov N (1937) A Study of the Diffusion Equation with Increase in the Amount of Substance, and Its Application to a Biological Problem. Bulletin of Moscow University Mathematics and Mechanics 1(6): 1-26.
-
Avrami M (1939) Kinetics of phase change. I. General theory. The Journal of Chemical Physics 7(12): 1103- 1112.
-
Avrami M (1940) Kinetics of phase change. II. Transformation-time relations for random distribution of nuclei. The Journal of Chemical Physics 8(2): 212-224.
-
Avrami M (1941) Kinetics of phase change. III. Granulation, phase change, and microstructure. The Journal of Chemical Physics 9(2): 177-184.
-
Sobkowski J, Czerwinski A (1974) Kinetics of carbon dioxide adsorption on a platinum electrode. Journal of Electroanalytical Chemistry and Interfacial Electrochemistry 55930: 391-397.
-
Behnajady MA, Modirshahla N, Ghanbary F (2007) A kinetic model for the decolorization of C.I. acid yellow 23 by Fenton process. Journal of Hazardous Materials 148(1-2): 98-102.
-
Boyd GE, Adamson AW, Myers LS (1947) The exchange adsorption of ions from aqueous solutions by organic zeolites 2. J Am Chem Soc 69(11): 2836-2847.
-
Reichenberg D (1953) Properties of ion-exchange resins in relation to their structure. III. kinetics of exchange. Journal of the American Chemical Society 75(3): 589-597.
-
Olafadehan OA, Amoo KO, Oyedeko KFK, Adesina AJ (2024) Dynamic studies of binary adsorption system in fixed beds using orthogonal collocation on finite element method. International Journal of Applied & Computational Mathematics 10(108): 1-26.
-
Yaseen ZM, Ebtehaj I, Kim S, Sanikham H, Asadi H, et al. (2019) Novel hybrid data-intelligence model for forecasting monthly rainfall with uncertainty analysis. Water 11(502): 1-23.
-
Shreyas AS, Shanbhag S, Sumanth M, Rao N, Borkovcova K, et al. (2020) Removal of nickel and lead from pharmaceutical waste water using agricultural waste. International Journal of Pharmaceutical Research 12(3): 807-813.
-
Bello VE, Olafadehan OA (2021) Comparative investigation of RSM and ANN for multi-response modeling and optimization studies of derived chitosan from _Archachatina marginata_ shell. Alexandria Journal of Engineering 60(4): 3869-3899.
-
Abonyi MN, Nwabanne JT, Ohale PE, Nwadike EC, Igbonekwu LI, et al. (2023) Application of RSM and ANFIS in the optimal parameter evaluation for crude oil degradation in contaminated water amended with PES. Case Studies in Chemical and Environmental Engineering 8: 1-9.
-
Di Martino A, Sittinger M, Risbud MV (2005) Chitosan: A versatile biopolymer for orthopaedic tissue- engineering. Biomaterials 26(30): 5983-5990.
-
Sharififard H, Shahraki ZH, Rezvanpanah E, Rad SH (2018) A novel natural chitosan/activated carbon/ iron bio-nanocomposite: sonochemical synthesis, characterization, and application for cadmium removal in batch and continuous adsorption process. Bioresource Technology 270: 562-569.
-
Fatombi JK, Idohou EA, Osseni SA, Agani I, Neumeyer D, et al. (2019) Adsorption of indigo carmine from aqueous solution by chitosan and chitosan/ activated carbon composite : kinetics , isotherms and thermodynamics studies. Fibers and Polymers 20(9): 1820-1832.
-
Mashile GP, Mpupa A, Nqombolo A, Dimpe KM, Nomngongo PN (2020) Recyclable magnetic waste tyre activated carbon-chitosan composite as an effective adsorbent rapid and simultaneous removal of methylparaben and propylparaben from aqueous solution and wastewater. Journal of Water Process Engineering 33: 101011.
-
Bello VE, Olafadehan OA (2022) Evaluation of heterocyclic aromatic compound dye (methylene blue) on chitosan adsorbent sourced from African snail shell: modelling and optimization studies. Journal of Applied Science and Process Engineering 9(1): 1054-1090.
-
Weber WJ, Morris JC (1963) Kinetics of adsorption on carbon from solution. Journal of the Sanitary Engineering Division ASCE 89(2): 31-59.
-
Ho YS, Porter JF, Mckay G (2002) Equilibrium isotherm studies for the biosorption of divalent metal ions onto peat, copper, nickel and lead single component systems. Water, Air, and Soil Pollution 141: 1-12.
-
Wang XS, Qin Y, Li ZF (2006) Biosorption of zinc from aqueous solutions by rice bran: kinetics and equilibrium studies. Separation Science & Technology 41(4): 747- 758.
-
Mohan D, Pittman CU (2007) Arsenic removal from water/wastewater using adsorbents – A critical review. Journal of Hazardous Materials 142(1-2): 1-53.
-
Sharma P, Das MR (2012) Removal of a cationic dye from aqueous solution using graphene oxide nanosheets: investigation of adsorption parameters. Journal of Chemical Engineering Data 58(1): 151-158.
-
Elelegi AN, Ayawei N, Wankasi D (2020) Interpretation of adsorption thermodynamics and kinetics. Open Journal of Physical Chemistry 10(3): 166-182.
- Nigeria’s Vulnerability in the Face of Global Energy Policy
- A Simulation Study of Investigation of Optimum Oil Production Performance by Applying Various Gas Injection Methods in Oil Reservoir
- Characterization of Permo-Triassic Reservoirs through Thermal Maturity Assessment of Westphalian Source Rocks in the Cheshire Basin
- Influence of Microwax on the Rheological and Thermal Behaviour of a Wax Crude Oil
- Real-Time Monitoring and Performance Optimization of Steam Injection in Heavy Oil Reservoirs Using Fiber Optic Sensing and Integrated Predictive Simulation Models
- Rapid On-Site Determination of the Total Petroleum Hydrocarbon Content of Soils by Handheld Fourier Transform Near-Infrared Spectroscopy: Development of a Global, Site- and Scanner- Independent Calibration Model