EOR Feasibility Study of Tanner Oilfield – A Comparative Approach
Alleviating production decline is a challenging task that every oil company will face at some point in the life of an oil reservoir. Enhanced Oil Recovery (EOR) techniques can be implemented to lessen the decline in the oil production rate and improve overall recovery. Despite water injection efforts in the Tanner field, production rate continues to fall, and reservoir pressure conditions have declined, making conventional primary and secondary recovery economically non-viable. This study evaluates the feasibility of Enhanced Oil Recovery (EOR) methods for a mature Tanner field. Four injection techniques—Continuous CO2 Injection, Water Alternating Gas (WAG), Carbonated Water Injection (CWI), and Alkaline Surfactant Polymer (ASP) were simulated in the reservoir model. The ECLIPSE simulator was employed to model EOR techniques on the reservoir from May 2000 to January 2021. Simulation results indicate that, Carbonated Water Injection with an injection pressure of 2000 psia returned the highest recovery factor of 28% OIIP and total oil production of 1.28MMstb. The highest FOE was observed during Carbonated Water Injection. The economic analysis of future performance revealed that CWI achieved the highest Net Present Value (NPV). Carbonated Water Injection (CWI) is considered the optimal EOR technique for the tanner field as it yields a higher NPV and the highest recovery factor. The novelty of this study lies in its evaluation of the feasibility of various EOR techniques, considering both technical and economic aspects. The findings hold significant implications for optimizing EOR strategies in mature fields.
Abbreviations
OIIP: Oil Initially in Place; NPV: Net Present Value; CO2: Carbon dioxide; WAG: Water Alternating Gas; EOR: Enhanced Oil Recovery; CWI: Carbonated Water Injection; ASP: Alkaline Surfactant Polymer; FOE: Field Oil Efficiency.
Background
As global energy demand continues to grow, the oil industry faces challenges maintaining production levels due to the steady decline in new conventional oil discoveries. However, the rate of replacement of produced reserves has been declining steadily in the last decades, and with new fields often located in technically complex and costly environments, a more realistic solution to meet global energy demand and consumption forecast lies in sustaining production from existing fields [1].
Oil reservoirs go through primary, secondary, and tertiary (enhanced) recovery stages over their production lifespan. Enhanced/Tertiary Oil Recovery (EOR/TOR) is an essential technique to maintain oil production by extracting additional oil that remains after the primary and secondary recovery methods have exhausted their effectiveness [2]. Nikolova and Gutierrez [3], revealed that using current technologies, primary recovery produces between 20% and 40% of the OIIP in a reservoir with secondary recovery methods yielding a further 15–25%. Hence, up to 55% of the OIIP can remain unrecovered. According to Sheng [4], EOR techniques can meet rising energy demands more sustainably by extending the life of mature fields and improving recovery rates beyond traditional methods.
The main categories of EOR, which include thermal, chemical, and gas injection have shown varying degrees of success under different reservoir conditions. Mokheimer E, et al. [5] observed that thermal injection involving the introduction of steam to lower the viscosity of dense viscous oil maximized reserves from heavy oil assets. Gas injection, especially CO₂ flooding, has proven particularly effective for light and medium oil reservoirs by reducing oil viscosity, increasing miscibility, and enhancing oil swelling, which aids in pushing trapped oil towards production wells [6]. Similarly, chemical methods, such as ASP flooding, use a combination of chemicals to lower interfacial tension and improve sweep efficiency, making them effective in releasing oil trapped by capillary forces [7].
This study assesses the technical and economic feasibility of CO₂ injection, ASP flooding, and water flooding in Tanner Field, a mature oilfield in Wyoming, which has reached a stage of declining productivity due to reservoir pressure depletion, high water cut and limited primary recovery. Despite water injection efforts, the field’s production rate continues to fall, and reservoir conditions have declined, making conventional primary and secondary recovery economically non-viable. Through a comparative analysis and by simulating different scenarios, this study aims to determine the most effective EOR method for this field.
Literature Review
The main objective of all EOR methods is to increase the volumetric (macroscopic) sweep efficiency and enhance the displacement (microscopic) efficiency, as compared to ordinary water-flooding [8]. The final recovery factor depends upon the microscopic displacement efficiency and the volumetric efficiency of the displacement front. Microscopic displacement efficiency is a measure of how well the displacing fluid mobilizes the residual oil once the fluid comes in contact with the oil [2]. Volumetric sweeping efficiency is a measure of how well the displacing fluid has contacted the oil-bearing parts of the reservoir [2].
Chemical injection involves the use of polymers to increase the effectiveness of water floods to help lower the surface tension that often prevents oil droplets from moving through a reservoir [9]. Chemical methods include polymer, surfactant, foam, alkaline, and ASP flooding. The mechanisms of chemical method vary, depending on the chemical materials added into the reservoir [10].
Alkaline flooding relies on a chemical reaction between alkali, such as sodium carbonate or sodium hydroxide, and organic acids (saponifiable component) in the crude oil to produce in-situ surfactants (soaps) that can reduce the interfacial tension (IFT) to ultralow values [4]. According to Liu and Wang [11] alkaline reacts with the reservoir rock surfaces to alter wettability (oil-wet to water-wet). Arekhov, et al. [12] reported that the lowest interfacial tension occurs at very low alkali concentrations.
The main mechanism of surfactant flooding is mobilization of residual oil trapped by capillary forces in the porous medium and that is by reducing the interfacial tension between oil, water, and residual oil saturations. Surfactants are organic compounds that have a hydrophobic group (tail) and hydrophilic group (head) in the same molecule [13]. Experimental data show that surfactant reduces surface tensions, capillary forces. More oil is, therefore, mobilized as residual oil saturation decreases [14].
ASP flooding is an EOR mechanism developed based on alkali, surfactant, and polymer flooding research in the late 1980’s. It is effective in producing light and medium oils left in the reservoirs after primary and secondary recovery. ASP flooding leverages the benefits of the three flooding methods simultaneously [15]. The mechanism of mobile residual oil for ASP is that there must be a large viscous force perpendicular to the oil/water interface to push the residual oil. The viscous force must overcome the capillary forces retaining the residual oil, move it, mobilize it, and recover it [16].
The main mechanism of oil recovery for CO2 flooding is its ability to reduce surface tension between oil and water. CO2 injection into an oil reservoir increases oil recovery by primarily altering the physical properties of the oil phase, i.e. swelling of the oil, reduction of oil viscosity, reduction of interfacial tension to water and vaporization and extraction of intermediate components. It has been reported that poor sweep efficiency (due to a high CO2 mobility) and CO2 availability has been a problem in CO2 floods of many oil reservoirs [17].
Parra, et al. [18], outlines procedures in reservoir simulation focusing on large field scale models. The procedure involved geologic modelling, simulating the geologic model, history matching of the modelled data with actual historical performances, and forecasting future performances.
Methodology
Study Site
Tanner Field is in Campbell County, Wyoming along the eastern flank of the Power River Basin. Tanner Field produces exclusively from the Minne Lusa Upper B Sands. Permian in age, the Upper Minne Lusa comprises of beds of dolomite, dolomitic sandstone, and anhydrite. Structurally, the field is very simple with relatively smooth regional west, southwest dip into the basin, interrupted by a southwest striking nose of the axis. The Minne Lusa upper B is also stratigraphically trapped at Tanner Field.
Reservoir Basic Data
Tanner is a small field consisting of one injection and two production wells. The producer wells are located north and south of the injector. Tanner produces a 21o API gravity crude oil with a viscosity of 11 cp (at a reservoir temperature of 175oF) from the Minne Lusa B Sandstone. The top of the sandstone formation is at a depth of 8,915 ft with an average thickness of 21 ft.
The average field porosity and permeability are at 19.4% and 200 mD respectively. OIIP is estimated at 5,246 MBO. The reservoir characteristics and properties are summarized in Table 1.
Production Data
The Tanner field is operated by the True Oil Company, Wyoming. The top “B” sand formation reservoir has 2 oil production wells and 1 water injection well. There are 21 years of production data spanning from 1991 to 2012 for the three wells. In April 1991, oil production started from Tanner Federal 24-30 well. Subsequent development of the field resulted in the drilling of two additional producing wells, Tanner Federal 21-31 and Tanner Federal 22-31 in August 1991 and July 1995 respectively. In 1997, water injection began in Tanner Federal 21-31 and continued through April 2000. It has been undergoing a waterflood since 1997. In December 2012, a total of 1.2 MMstb of oil was produced.
| Reservoir Characteristics | Values |
|---|---|
| Producing area | 222 acres |
| Formation | Minne Lusa B Sandstone |
| Average depth | 8,915 ft |
| Average permeability | 200 mD |
| Average porosity | 19.4% |
| Average net oil pay thickness | 21 ft |
| Oil Gravity | 21o |
| Reservoir temperature | 175 oF |
| Primary production mechanism | Fluid expansion |
| Secondary production mechanism | Waterflood |
| Original reservoir pressure | 3,371 psi |
| Bubble-point pressure | 207 psig |
| Solution GOR at original pressure | 50 scf/stb |
| Oil viscosity | 11 cp |
| Minimum miscibility pressure | 2,884 psia |
Table 1: Summary of Reservoir Data.
Reservoir Simulation
Reservoir engineering techniques are applied to improve the understanding of the reservoir performance and fluid properties. The process includes the calibration of an EOS to describe the phase behavior of the reservoir fluid, input data tables for PVT fluid properties and rock-saturation-dependent properties such as relative permeability, the initialization of the simulation model to access hydrocarbon volumes, and preparation to forecast the reservoir performance. The simulator used for this study is the ECLIPSE simulator suite, a Schlumberger tool. The ECLIPSE simulator suite consists of two separate simulators: ECLIPSE 100 is designed for black oil modeling, and ECLIPSE 300 treats compositional modeling. ECLIPSE 100 is a fully implicit, three-phase, three- dimensional, general-purpose black-oil simulator with a gas condensate option. ECLIPSE 100 was used for water and ASP flooding simulations while ECLIPSE 300 was used for CO2 injections.
Fluid Properties
The reservoir oil is unsaturated black oil with a stock tank gravity of 21o API. Initial reservoir pressure and bubble- point pressure are 3,371 psi and 207 psi, respectively. The CO2 minimum miscibility pressure was determined experimentally to be 2884 psi. Table 2 shows the reservoir fluid composition.
- Reservoir Fluid Composition in Mole Fractions
- CO2
- N2
- C1
- C2
- C3 iC4 nC4 iC5 nC5
- C6
- C7
- +
- 1.25
- 1.78
- 0.93
- 1
- 1.13
- 0.52
- 1.37
- 1.59
- 3.12
- 5.05
- 82.25
- Temperature 175 oF
- C7+ Molecular Weight 411.36
- Density @ 60 oF, gm/cc 0.901
Table 2: Reservoir Fluid Composition in Mole Fractions.
Equation of State Characterization
The Peng Robinson EOS was chosen to generate the EOS model because it has been found adequate for low-temperature CO2/oil mixtures. The viscosity model considered to match the oil viscosity was the Lohrenz-Bray- Clark (LBC) model, which is a predictive model for gas or liquid viscosity. PVT laboratory sample data of the Tanner field were used in the tuning of the EOS. PVT laboratory data included differential liberation (DL) experiments, constant composition-expansion (CCE), swelling, and separator tests. Table 3 lists the experiments, and the measured parameters loaded into the PVT software. The relative permeability data from the nearby Indian Tree Field was incorporated in the model along with the known reservoir parameters from the Tanner Field as there is no available relative permeability or capillary pressure data. Each laboratory experiment was first simulated with the cubic Peng-Robinson EOS without performing any regression and compared to the laboratory observations (PVT). The preliminary results were good, demonstrating that the behavior of the fluid was being reproduced with a basic (not yet tuned) EOS. The tested parameters included oil and gas densities and the formation volume factor.
| Reservoir Fluid Composition | C7⁺ density and molecular weight |
| Constant Composition Expansion | Relative volumes, saturation pressure, oil density |
| Separator Test | Gas/oil ratio, gas FVF |
| Differential Liberation | GOR, relative oil volume, gas Z-factor, oil density, oil FVF |
| Injection Test | Swelling test |
Table 3: PVT Experimental Data.
Reservoir Model
The reservoir model is a 3-dimensional 60 x 30 x 6 rectangular grid structure, with 10,800 total cells. Each cell has the dimensions of 100 ft x 104 ft x 3.5 ft, in the X, Y, and Z directions, respectively.
There are 5,790 active cells. The grid system contains two production wells and one injection well. Both production and injection wells are vertical; completed in the 4th layer. Simulation layers were constructed to represent the actual reservoir zonation and resemble actual flow units.
Model Initialization and Simulation
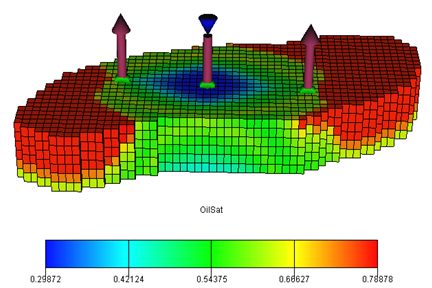
Initial reservoir pressure and temperature were set at 3,371 psia and 175 oF at a reference depth of 8,915ft. The initial water and oil saturations were at 0.22 and 0.78, from the utilized relative permeability profile. The simulation model contains an estimated OIIP of 5.26 million barrels. Figure 1 depicts a pictorial representation of reservoir showing oil saturation and well location on January 31, 2013.
History Matching
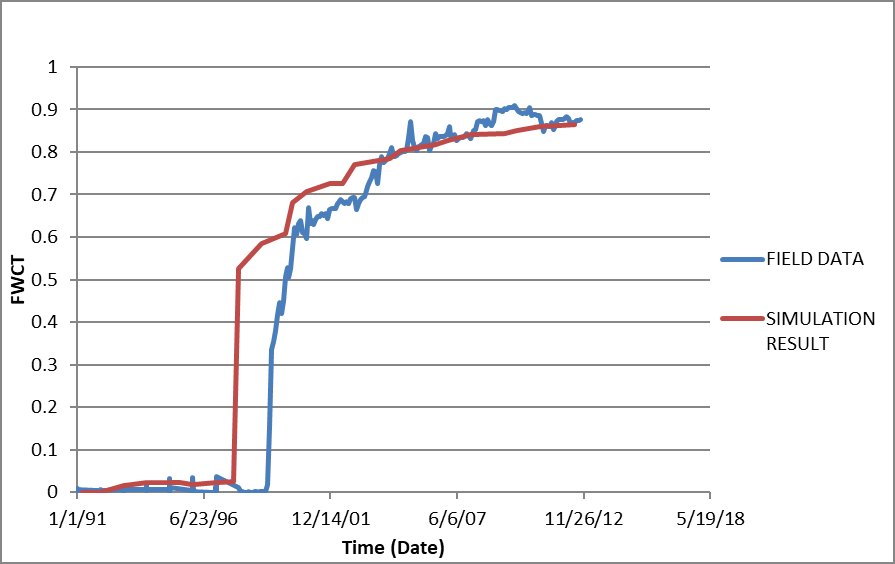
The conceptual geologic model was first tested against historical data. History matching was used to help identify parameters that needed to be fine-tuned to better mimic fluid distribution, fluid movement, and identify the current depletion mechanism(s). Corrections to the geologic model were undertaken in line with the results from the history matching. The validated geologic model was used to predict field future performance under different operating strategies. In fact, field data of water cuts and production were compared to conceptual simulation results. Gas production was not considered due to the dead oil nature of the reservoir fluid. Figure 2 portrays a comparison of field water cut (FWCT) historical data to simulation-generated data. Simulation data shows an earlier water breakthrough. However, a good match between simulation and history was obtained post breakthrough.
Injection Pressures
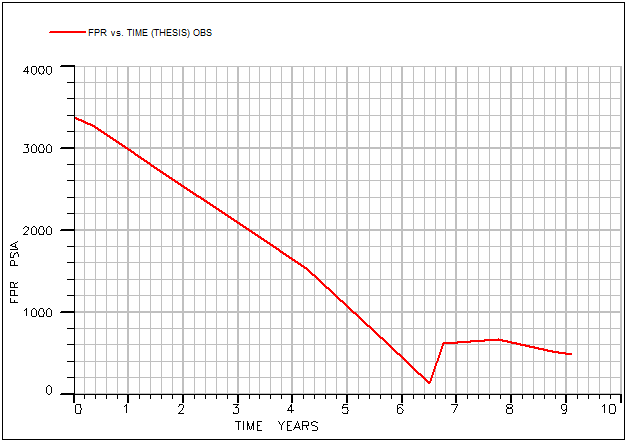
Figure 3 plots the average field pressure (FPR) against time. The pressure dropped from 3371 to approximately 450 psia from April 1991 to April 2000.
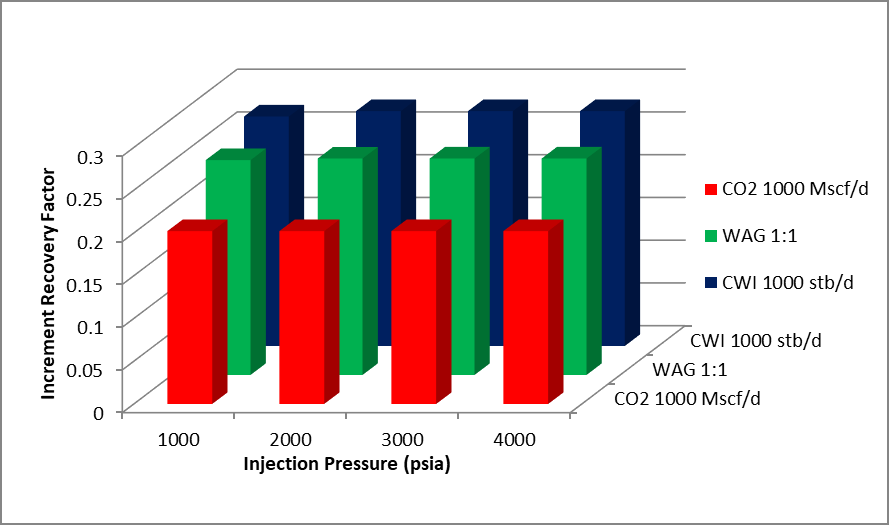
CO2 continuous injection rate of 1,000 Mscf/day, carbonated water injection rate of 1,000 stb/day and WAG 1:1 from May 2000 to January 2021 revealed that the injection pressures for the above injection rates fluctuated between 1,000, 2,000, 3,000 and 4,000 psia. Figure 4 shows increment oil recovery factors for different injection pressures. There was little effect on recovery factors when injection pressure was increased from 1,000 up to 4,000 psia. However, the highest increment recovery factor was obtained at an optimum injection pressure of 2000 psia. Hence, the injection pressure of 2000 psia was utilized in this study.
Simulation Studies
Water Injection Formation water was injected into the reservoir at a rate of 650 stb/day. This was taken as a base case and compared to the ASP flooding and CO2 injection methods. Simulation of continuous injection of water into the reservoir was studied from the period 1997 to 2021.
ASP Flooding The performed simulation periods were from May 2000 to January 2013 and from May 2000 to January 2021. The injected chemical solution was a mixture of 3.5lb/stb of Alkaline plus 0.35 lb/stb of Surfactant and 800 mg/L of Polymer. An ASP solution of 642,700 bbl by volume was injected followed by 644,500 bbl of a Polymer slug. The subsequent water drive began in January 2005. The injection operational parameters were obtained from literature. The other chemical properties (alkali, surfactant and polymer) used in this study are assumed to be compatible with the Tanner reservoir rock and fluid properties.
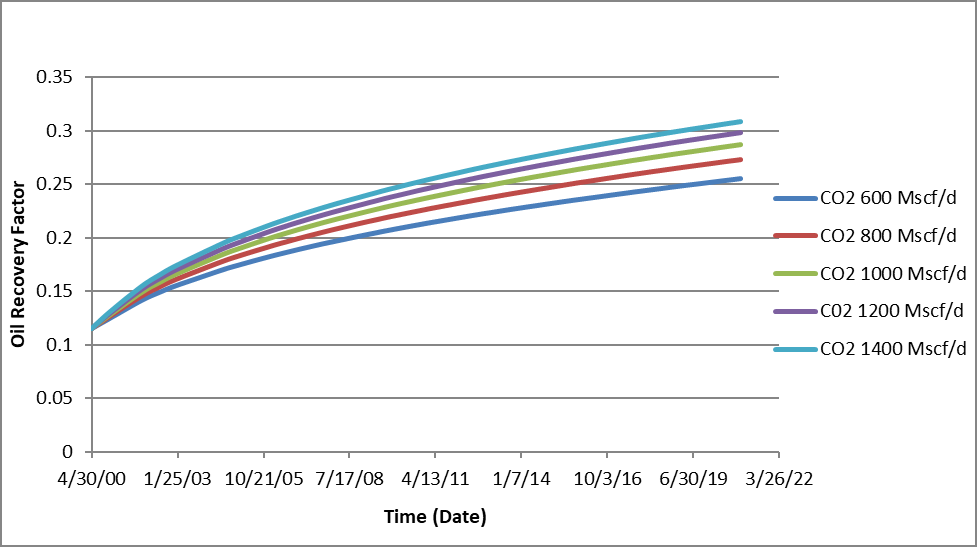
Continuous CO2 Injection CO2 was injected continuously into the reservoir. The effect of the injection rate of CO2 on recovery efficiency was studied. Five cases with different injection rates, 600 Mscf/ day, 800 Mscf/day, 1,000 Mscf/day, 1,200 Mscf/day, and 1,400 Mscf/day were simulated. The simulation periods performed were from May 2000 to January 2013 and from May 2000 to January 2021.
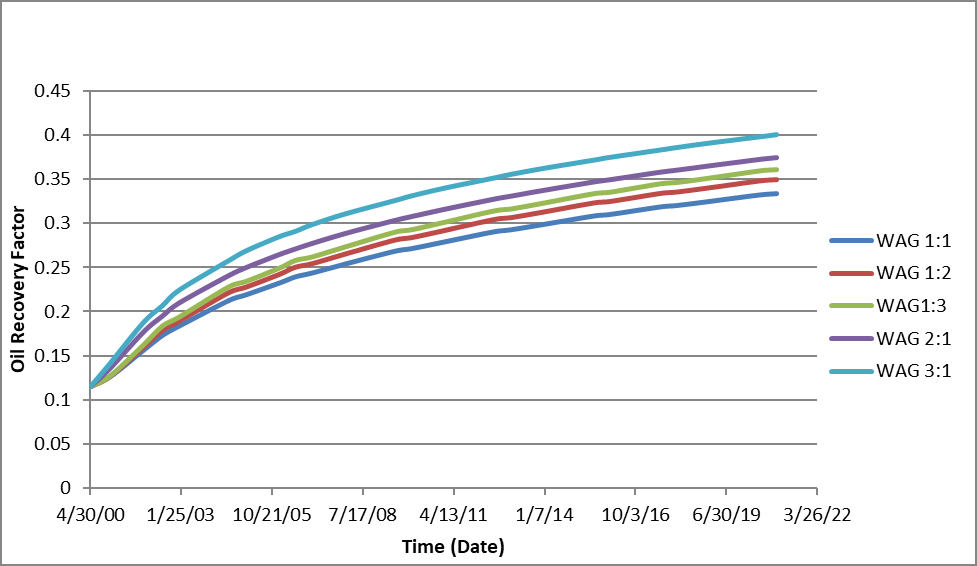
CO2 WAG A 1,000 Mscf/day CO2 injection rate was used for this study. Injection of water and CO2 were implemented alternately through the same injectors at their respective intervals. Five cases with different WAG ratios were simulated and evaluated.
They were 1:1, 1:2, 1:3, 2:1 and 3:1. The alternate time intervals investigated were 3 months, 6 months and 1 year. The simulation periods performed were from May 2000 to January 2013 and from May 2000 to January 2021.
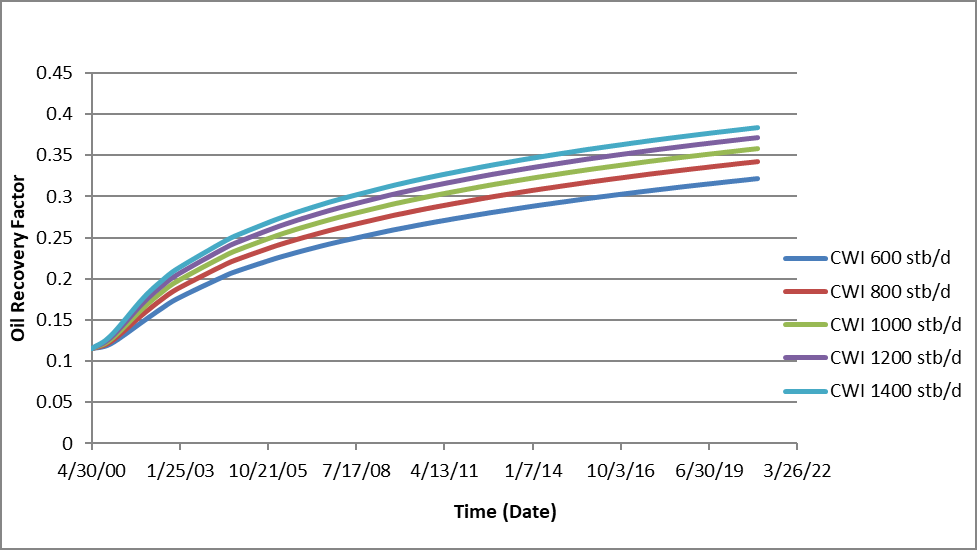
Carbonated Water Injection The effects of carbonated water injection on the recovery factor were studied. The optimum injection rate was also determined from the rate sensitivity study results. Five carbonated water injection rates were tested.
They were 600 stb/day, 800 stb/day, 1,000 stb/day, 1,200 stb/day, and 1,400 stb/day. A mixture of 80% H2O and 20% CO2 were injected continuously. The simulation periods performed were from May 2000 to January 2013 and from May 2000 to January 2021.
Results and Discussion
Water flooding Simulation Water injection commenced in the field as oil production declined and reservoir pressure neared abandonment levels. The cumulative water injection was 612,950 bbl or 0.11 pore volume.
ASP Flooding Simulation Alkaline-Surfactant-Polymer injection was initiated at 54% water cut after injecting water through April 2000. A total of 0.6 MMstb oil was produced.
Future performance was predicted using the current injection method resulting in a cumulative oil production of 0.76 MMstb over a period of 21 years. The field recovery factor was 26% OIIP.
Continuous CO2 Injection Simulation Figure 5 shows the field oil efficiency (FOE) for various CO2 injection rates. Recovery factor was observed to increase with increasing injection rate. After 21 years of CO2 injection at 1,400 Mscf/day, a total of 1,016,117 stb of oil was produced. The total CO2 injected was 10,600 MMscf and oil production per Mscf of CO2 injected was 0.0959 stb.
WAG Injection The recovery factor increases with increasing WAG ratio. The WAG process affected the cyclic accelerations in the oil recovery resulting from the improved mobility ratio. Increasing CO2 proportions led to decreased incremental recovery as seen in Figure 6. From the simulation results, a WAG ratio of 3:1 yielded an oil production of 1.5MMstb, recovery factor of 33% OIIP at a field water cut of 96%. Increased amounts of injected water led to higher well water cut as the CO2 injected remained constant. For the alternate time intervals investigated, there was little or no effect on changing alternate time interval.
Carbonated Water Injection
A 0.8 H2O to 0.2 CO2 mole ratios was used in the performed CWI simulations. Figure 7 indicated that the recovery factor increased with increasing injection rates. This is because the higher the injection rate, the larger the injected amounts of water and CO2, leading to higher sweep efficiency and hence a higher ultimate recovery. After 21 years of injection, a total of 1,409,991 stb of oil was produced by CWI at a rate of 1400 stb/day.
Economic Analysis
In this study, the economic evaluation only considered the cost of CO2 injection, excluding the initial capital investment for drilling, cost of well operation and maintenance. The price of CO2 was based on the percentage of the crude oil price per barrel [19]. Table 4 delineates the various cost categories of the purchase calculations of the CO2 cost. As recommended in Lepinski [20], water injection and operation cost of $0.50 per barrel of oil produced is used.
| Estimation | |
|---|---|
| High Cost | 5% of the crude oil price |
| Medium Cost | 3.5% of the crude oil price |
| Low Cost | 2% of the crude oil price |
Table 5: Purchase Calculation of CO2 Cost.
A conservative estimate is made by assuming that CO2 in the carbonated water accounts for 20% of the volume while water (H2O) takes up the remaining 80%. The base case oil production cost with CWI is computed as: Cost = total volume CO2 injected x CO2 cost + total oil produced x $0.50 Net present value (NPV) is calculated to show the value of recoverable oil considering the EOR strategy costs. This study uses the following equation: NPV = Cash Inflow – Cash Outflow where, NPV = Net Present Value, US $ Cash Inflow = Oil production x OP with OP = Oil Price per Barrel, US $ Cash Outflow = EOR Injection Cost, US $ The historical crude oil prices per barrel as shown in Table 5 were used for the NPV calculations for the period of May 2000 to January 2013. Additionally, an average oil price of $85 per barrel was used to study the effects of oil price on the CO2 injection techniques from May 2000 to January 2021.
| Crude Oil Prices | |
|---|---|
| 2000 | $27.39 |
| 2001 | $23.00 |
| 2002 | $22.81 |
| 2003 | $27.69 |
| 2004 | $37.66 |
| 2005 | $50.04 |
| 2006 | $58.30 |
| 2007 | $64.20 |
| 2008 | $91.48 |
| 2009 | $53.48 |
| 2010 | $71.21 |
| 2011 | $87.04 |
| 2012 | $86.46 |
| 2013 | $91.17 |
| 2014 | $85.60 |
| 2015 | $41.85 |
| 2016 | $36.34 |
| 2017 | $43.97 |
| 2018 | $57.77 |
| 2019 | $50.01 |
| 2020 | $32.25 |
| 2021 | $60.84 |
| 2022 | $87.40 |
Table 4: Historical Crude Oil Prices per barrel. Source: https://inflationdata.com/articles/inflation- adjusted-prices/historical
Table 5: Historical Crude Oil Prices per barrel. Source: https://inflationdata.com/articles/inflation- adjusted-prices/historical-crude-oil-prices-table/ Comparing different CO2 purchasing costs from May 2000 to January 2013, results show that NPV values for CWI are the highest, while NPV values for CO2 injection are the lowest as depicted in Figure 9.
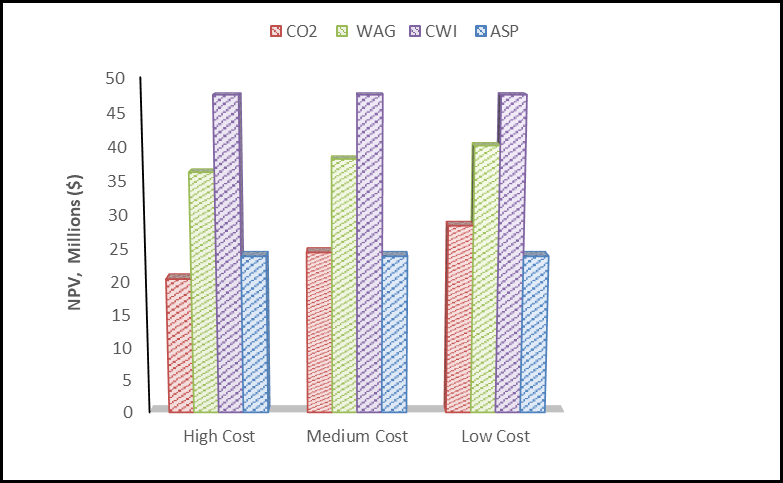
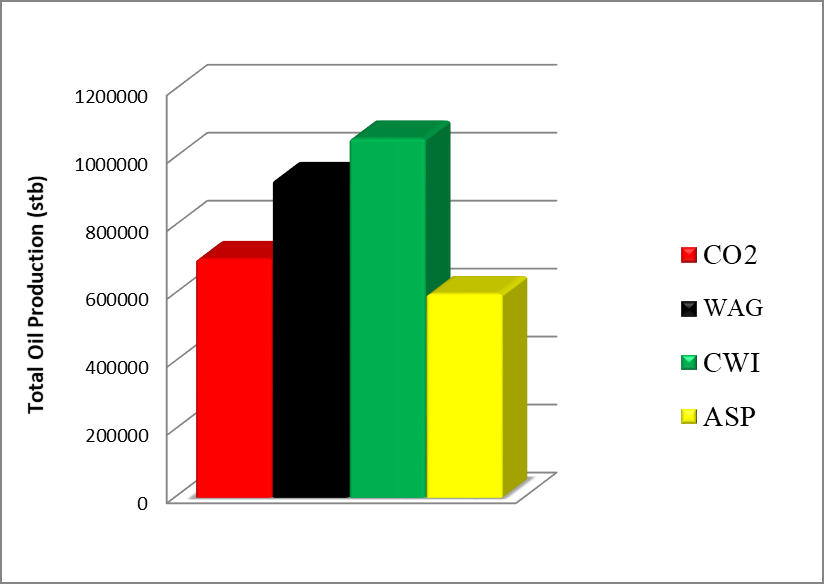
Figure 10 shows the cumulative oil produced for all examined EOR methods. The oil produced (from May 2000 to January 2013) by continuous CO2 injection, WAG, CWI, and ASP floods were 703,038 stb, 934,880 stb, 1,057,185 stb, and 599,453 stb, respectively. CWI yielded the highest cumulative oil produced.
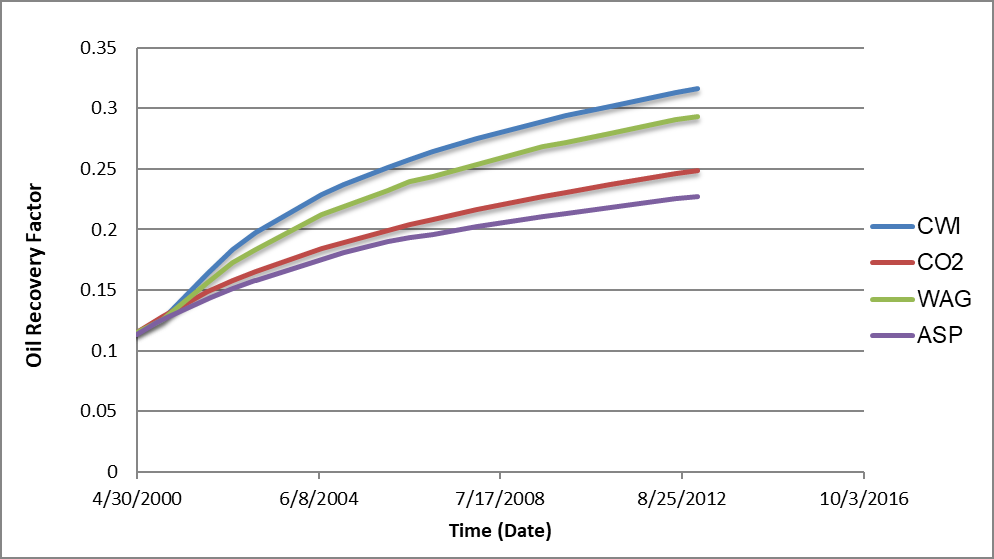
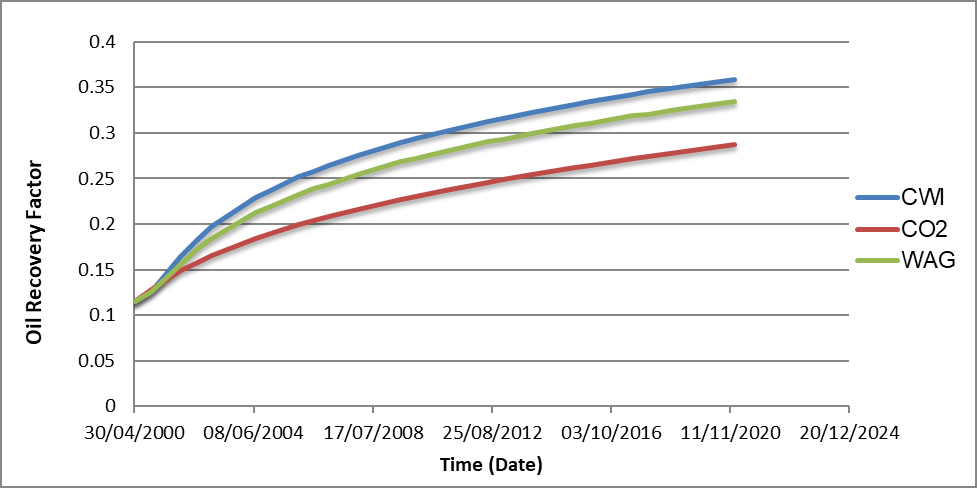
Field Oil Recovery
The Field Oil Efficiency (FOE) for the examined EOR methods was also used to measure the effectiveness of each technique. A comparison based on the field oil recovery efficiency was used to assess the field performance for the compared methods. Figures 11 and 12 show the oil recovery factors for the examined methods for time periods 2000 to 2013 and 2000 to 2021. It is observed that the highest FOE was observed during Carbonated Water Injection. CWI showed an initial steep recovery curve, indicative of early improvement in oil mobility as a result of CO₂ dissolution in water. WAG shows higher oil recovery than CO₂ but less than CWI. The behaviour of WAG can be attributed to the delayed CO₂ breakthrough, resulting from the alternating injection of water and gas. Alternating injection of water and gas improves vertical sweep and enhances oil recovery.
Despite CO₂ injection offering clear benefits in reducing oil viscosity and increasing oil volume through swelling, it performs less effectively than CWI and WAG. This can be attributed to a considerable portion of CO₂ potentially escaping from the formation, thereby limiting its long-term effectiveness. ASP begins with a recovery level comparable to CO₂ but plateaus earlier, suggesting a possible decline in chemical efficiency with time.
Conclusions
The results of the comparative EOR study for the Tanner oilfield in Wyoming suggest a multifaceted mechanism of oil recovery, driven by several processes. The primary mechanisms identified are:
- Oil Viscosity Reduction: CO2 injection decreases the viscosity of the oil, enhancing its flow characteristics and making it easier to extract.
- Oil Swelling: The CO2 causes the oil to swell, increasing its volume. This phenomenon helps to improve the oil’s mobility and enhances displacement efficiency.
- Combination of Isolated Swelled Oil Patches: As swelled oil patches combine, the connectivity of the oil phase improves, facilitating its movement toward production wells.
- Fluid Redistribution via CO2 Diffusion: The diffusion of CO2 in the reservoir creates a redistribution of fluids, which alters the pressure and saturation profiles, further enhancing recovery.
These processes collectively improved oil recovery efficiency, underscoring the effectiveness of using CO2 as an EOR agent in the Tanner oilfield. A comparative study of EOR techniques of continuous CO2, WAG, CWI, and ASP flooding indicated that CWI is the best tertiary recovery reservoir management method in Tanner Field. The cumulative oil production of CO2, WAG, CWI, and ASP flooding between May 2000 and January 2013 were 702,794.8 stb, 934,880.4 stb, 1,057,185 stb, and 599,452.8 stb, respectively. The increment in oil recovery factors were 15.6%, 20.6%, 22.7%, and 11.5%.
The simulated reservoir is a viable candidate for CWI. The economic analysis of the reservoir’s future performance proved that CWI is the best EOR technique, yielding the highest NPV.
References
-
Manrique E, Thomas C, Ravikiran R, Izadi M, Lantz M, et al. (2010) EOR: current status and opportunities. SPE Improved Oil Recovery Symposium, Tulsa, Oklahoma, USA, SPE-130113-MS.
-
Lake LW, Johns RT, Rossen WR, Pope GA (2014) Fundamentals of enhanced oil recovery. Society of Petroleum Engineers.
-
Nikolova C, Gutierrez T (2021) Biosurfactants and their applications in the oil and gas industry: current state of knowledge and future perspectives. Front Bioeng Biotechnol 9.
-
Sheng JJ (2010) Modern chemical enhanced oil recovery: theory and practice. Gulf Prof Publ.
-
Mokheimer EMA, Hamdy M, Abubakar Z, Shakeel MR, Habib MA, et al. (2018) A comprehensive review of thermal enhanced oil recovery: techniques evaluation. J Energy Resour Technol 141(3): 030801.
-
Ebaid H, Gasser M, Yehia T, Okoroafor ER (2024) Enhancing oil recovery in heterogeneous reservoirs with CO2 flooding: A simulation study. SPE/AAPG/SEG Carbon Capture Utilization and Storage Conference and Exhibition, Houston, Texas, USA.
-
Pashapouryeganeh F, Zargar G, Kadkhodaie A, Rabiee A, Misaghi A, et al. (2022) Experimental evaluation of designed and synthesized alkaline-surfactant-polymer (ASP) for chemical flooding in carbonate reservoirs. Fuel 321: 124090.
-
Deng X, Tariq Z, Murtaza M, Patil S, Mahmoud M, et al. (2021) Relative contribution of wettability alteration and interfacial tension reduction in EOR: A critical review. J Mol Liq 325: 115175.
-
Pogaku R, Mohd Fuat NH, Sakar S, Cha ZW, Musa N, et al. (2018) Polymer flooding and its combinations with other chemical injection methods in enhanced oil recovery. Polym Bull 75(5): 1753-1774.
-
Gbadamosi AO, Junin R, Manan MA, Agi A, Yusuff AS (2019) An overview of chemical enhanced oil recovery: recent advances and prospects. Int Nano Lett 9: 171-202.
-
Liu F, Wang M (2020) Review of low salinity waterflooding mechanisms: Wettability alteration and its impact on oil recovery. Fuel 267: 117112.
-
Arekhov V, Hincapie RE, Clemens T (2020) Wettability changes and interfacial tension reduction in alkali polymer flooding of high and low tan number oils. SPE Europec featured at EAGE Conference and Exhibition D021S012R003.
-
Unal DN, Sadak S, Erkmen C, Selcuk Ö, Uslu B (2023) Review of surfactants structural properties and their role in electrochemistry.
-
Manikantan H, Squires TM (2020) Surfactant dynamics: hidden variables controlling fluid flows. J Fluid Mech 892.
-
Shen PP, Yu JY (2002) Fundamental research on enhanced oil recovery in large scale. Petrol Ind Publ Co Beijing.
-
Wang J, Yuan S, Shen P, Zhong T, Jia X (2007) Understanding of fluid flow mechanism in porous media of EOR by ASP flooding from physical modelling. IPTC Int Petrol Technol Conf cp-147.
-
Fakher SM, Imqam A, Bai B (2018) Enhancing carbon dioxide flooding sweep efficiency in high permeability hydrocarbon reservoirs using micro-particle gels. SPE Kingdom of Saudi Arabia Annual Technical Symposium and Exhibition, Dammam, Saudi Arabia, SPE-192381.
-
Parra H, Mogensen K, Alobeidli A (2021) Large scale reservoir simulation models for regional understanding of inter-field communications-a case study offshore Abu Dhabi. Abu Dhabi International Petroleum Exhibition & Conference, Abu Dhabi, UAE, SPE-207526-MS.
-
Melzer S (2010) Optimization of CO2 storage in CO2 enhanced oil recovery projects. Adv Res Int.
-
Lepinski J (2013) Comprehensive quantitative risk assessment of CO2 geologic sequestration. Headwaters Clean Carbon Services LLC.
- Nigeria’s Vulnerability in the Face of Global Energy Policy
- A Simulation Study of Investigation of Optimum Oil Production Performance by Applying Various Gas Injection Methods in Oil Reservoir
- Characterization of Permo-Triassic Reservoirs through Thermal Maturity Assessment of Westphalian Source Rocks in the Cheshire Basin
- Influence of Microwax on the Rheological and Thermal Behaviour of a Wax Crude Oil
- Real-Time Monitoring and Performance Optimization of Steam Injection in Heavy Oil Reservoirs Using Fiber Optic Sensing and Integrated Predictive Simulation Models
- Rapid On-Site Determination of the Total Petroleum Hydrocarbon Content of Soils by Handheld Fourier Transform Near-Infrared Spectroscopy: Development of a Global, Site- and Scanner- Independent Calibration Model