Influence of Microwax on the Rheological and Thermal Behaviour of a Wax Crude Oil
This study investigated the effect of different percentages of microwax on the viscoelastic profile of crude oil samples. The viscosity results agreed with the literature and revealed increased viscosity with higher amounts of wax. However, during the oscillatory tests, no significant differences in viscoelastic behavior were observed between the samples, even when fully crystallized. Furthermore, all samples exhibited nearly identical stresses during yield stress analysis. Gelation temperature varied between the samples, as did WAT, as identified by DSC. These findings highlight the complexity of the interactions between wax and the crude oil’s viscoelastic properties, emphasizing the importance of a comprehensive analysis to fully understand its behavior under different conditions.
Clímaco GN¹*, Okasaki FB², Bizarre L¹, Pinheiro IF¹ and Guersoni VCB¹
¹Centro de Estudos de Energia e Petróleo, Universidade Estadual de Campinas, Campinas, Brasil ²Faculdade de Engenharia Mecânica, Universidade Estadual de Campinas, Brasil Keywords: Vscosity; Rheology; Crystallization; Wax; WAT
Highlights
- Microwax increases crude oil viscosity proportionally to its content.
- Viscoelastic behaviour showed no major change despite full crystallization.
- Gelation temperature and WAT varied slightly with wax content.
- Yield stress differences suggest structural effects of wax distribution.
- Total wax content impacts rheology more than wax type itself.
Introduction
The oil and gas industry face constant challenges to ensure flow during oil production. Among the main problems is wax deposition, a complex issue that can result in significant operational interruptions and additional maintenance costs for production lines [1]. In the offshore production of waxy oils, temperature variations can occur throughout the production system, resulting in temperature gradients that affect the solubility of waxes present in the oil. As a result, wax molecules tend to precipitate from solutions and form solid deposits on the internal surfaces of pipelines [2]. The formation of wax deposits on the inner walls of pipes is a phenomenon influenced by several variables, including the composition of the paraffinic oils [3]. Understanding the rheological and compositional characteristics of these oils is, therefore, essential to optimizing the processes.
The study of model oils in the petroleum industry is widespread, with numerous works and studies dedicated to understanding their properties and behavior [4, 5, 6, 7, 8, 9]. With this growing demand for innovation and optimization, there is a need to explore new approaches, such as the influence of each isolated compound on the system in general. Previous work suggests that the addition of microwax could potentially reduce the viscosity of the oil, which could have significant implications for oil production and processing [5]. However, given the lack of knowledge on the true composition of the oil, several interactions may occur, resulting in different behavior.
Neighborhood temperature is one of the most important factors in wax deposition [5], mainly because wax crystallizes at temperatures below the wax appearance temperature (WAT). The ability to crystallize and melt makes waxy oil behave as a Newtonian fluid above WAT and pseudoplastic below WAT. As crystallization is a kinetic process, the thermal history clearly affects the properties of the oil, and several studies have shown that the composition of the oil significantly impacts the properties. Ligeiro, et al. [5] showed that the presence of microwax can drastically reduce properties such as viscosity and yield stress. Kurniawan, et al. [4] also showed that microwax can reduce the mechanical properties of the paraffin crystal network. The ability of microwax to reduce viscosity is a very important characteristic in oil production, and although it has been tested on model oils, it has not yet been applied to crude oil. Some authors have studied the influence of temperature on the thermal and rheological behavior of different crude oils [10, 11]; however, how microwax affects these properties needs to be further explored.
Another interesting factor that can greatly influence the viscoelastic properties of fluid is the cooling process, which can modulate the size and shape of crystals, consequently interfering with the yield stress. Through temperature ramp and stress sweep tests, authors found that an increase in the cooling rate causes a decrease in the crystallization temperature, and a decrease in the shear rate during cooling results in a higher viscosity of the fluid [11, 12]. These changes can directly affect the rheological properties, which play a crucial role in transport and mixing processes and which have been widely studied [12]. Furthermore, the aging time of the oil, i.e. the period over which this deposit has accumulated, is of great importance as it can lead to the formation of denser and more resistant deposits, increasing the risk of pipe plugging and reducing production efficiency [13].
The wax composition in the oil directly affects precipitation. Higher molecular weight waxes crystallize at high temperatures, inducing the crystallization of lower molecular weight waxes. Although adding micro wax accelerates this process, since it consists of high molecular weight molecules, it does not negatively affect rheological behavior. Also, crude oils that are rich in these higher molecular weight hydrocarbons, particularly those above _C_40, present a significant risk of wax deposition during production, potentially even within the reservoir itself [14]. However, other components present in the oil, such as naphthenics and aromatics, can also indirectly influence paraffin deposition. Alongside the content, the type of paraffin plays a significant role, categorized into macrocrystalline and microcrystalline wax. The former primarily comprises low molecular weight n- alkanes (_C_16–_C_40), forming needle or pellet crystals, while the latter consists of a large proportion of high molecular weight iso-alkanes and cyclo-alkanes, which typically precipitate as small amorphous particles [15, 16].
This study, therefore, aimed to investigate the impact of micro waxes, which contain longer carbon chains compared to macro waxes, on the rheological and thermal behavior of crude oil. Specifically, the study focuses on how the presence of microwax influences the oil’s flowability and how the wax composition affects these properties. Unlike many previous studies that rely on model systems, this work uses crude oil, allowing for a more comprehensive understanding of how micro waxes interact with the oil’s complex mixture of components. This approach provides insights into the real- world implications of increased carbon chain content on flow behavior and wax deposition, which can contribute to pipeline blockages and operational challenges. The findings are crucial for improving flow assurance and managing wax- related issues in oil transport and storage.
Materials and Methods
To carry out the tests, Brazilian crude oil was used, whose SARA (ASTM D 6560-12 and ASTM 207-11) composition is described in Table 1. A wax content of 10% was quantified using High-Temperature Gas Chromatography (HTGC).
Six samples were produced from crude oil with different proportions of wax: 3%, 5%, 7%, and 10% of microcrystalline wax (wax 170 by Solven Company) with carbon above _C_40, and one with 10% of macrocrystalline wax (wax 140 by Solven Company) with carbon ranging from _C_15 to _C_40. The waxes were weighed in different bottles with the respective oil samples and kept in an oven at 70°C for 2 hours before starting the experiments to help clean the thermal history and ensure homogeneity. At the end of this time, each bottle was manually shaken before analysis. For the simplicity of representation in graphs and tables, microwax will be represented as Mi and macrowax as Ma.
| SARA | % |
|---|---|
| Saturates | 67 ± 1% |
| Asphaltene | 0.1 ± 0% |
| Resins | 20 ± 3% |
| Aromatics | 13 ± 4% |
Table 1: Oil composition employed in all experiments.
High Temperature Gas Chromatography
The determination of the paraffinic compounds within the samples was carried out using an Agilent 8890® Gas Chromatograph equipped with a DB-5 HT® column (30 m × 320 µm × 0_._1 µm) also obtained from Agilent. Helium was used as a carrier gas with a flow rate of 4 mL/min. A FID detector was used at 390°C, with hydrogen as the fuel and synthetic air as the oxidizer. Sample injection was carried out with a split/splitless injector in splitless mode, the injection volume was 1 µL and the inlet temperature was set to 380°C. The applied temperature ramp in the chromatograph oven initiated at 90 °C and was heated to 380°C at the rate of 8°/ min.
All crude oil samples that underwent chromatographic analysis were diluted to a concentration of approximately 1 mg/mL. Cyclohexane (AppliChem ITW reagents, HPLC grade with purity ≥ 99_._9%) was used as a solvent for all samples. All experiments were conducted in duplicate. The quantification of the paraffinic compounds was carried out using calibration curves constructed using an ASTM D5442 quantitative linearity standard from Sigma-Aldrich. All calibration curves were constructed in triplicate, fitted using linear regression, and Pearson correlation coefficients of at least 0.995 were obtained for all compounds.
Rheology
The effect of temperature on the viscosity of the samples was determined using a rheometer (Anton Paar, MCRe-702), following the methodology described in Ligeiro, et al. [5]. For that, the rheometer was equipped with a cone-plate sandblasted geometry, with a diameter of 60 mm, a cone angle of 1°, a truncation of 0.053 mm, and a Peltier system, which ensures accurate temperature control throughout the measurements. The initial temperature chosen was 70°C, with a cooling rate of 1°/min until 5°C. Before analysis, samples were subjected to a shear rate of 10 s_−1 for 3 min at the initial temperature to clear the shear history. The shear rate was changed to 50 s−1 during the tests to better match the rheological behavior of the sample, ensuring a more accurate estimation of its viscosity. A test varying the shear rate was also conducted to verify the Newtonian behavior, with shear varying from 50 s−1 to 300 s−_1, at temperatures below (25°C) and above (50°C) WAT. All tests were performed in duplicate.
To evaluate the yield stress, rotational tests were conducted using a cone-plate sandblasted geometry, with a diameter of 60 mm, a cone angle of 1°, a truncation of 0.053 mm, and a Peltier system [5]. The samples were cooled from 70°C to 4°C at a constant cooling rate of 1 °C/min, without applying shear, following a 3 min waiting period at 4°C. These tests were performed with a constant shear rate of 50 s_−_1, with a logarithmic shear stress ramp from 0.01 to 4000 Pa, and the yield stress was measured in the tension at which the fluid starts to flow continuously. Also, oscillatory tests were conducted to verify the fluid behavior in relation to temperature and to measure the gel point; that is, the temperature at which the fluids start to behave more like a gel. This test consists of a temperature ramp from 70°C to 4°C at a constant cooling rate of 1°/min, under an oscillatory shear stress of 6 Pa and a constant frequency of 1 Hz. All tests were performed in duplicate.
Differential Scanning Calorimetry - DSC
The wax appearance temperature (WAT) for all formulations was determined by Differential Scanning Calorimetry (TA Instruments, Q2000). The samples were first heated to 80°C and kept at that temperature for 10 minutes to clear the thermal history, then cooled to _−_20°C at a constant rate of 1 °C/min. All the experiments were conducted in duplicate, based on ASTM D4419-90.
Results and discussion
Chromatographic Analysis
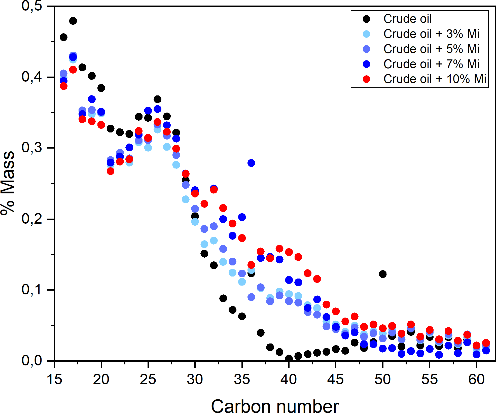
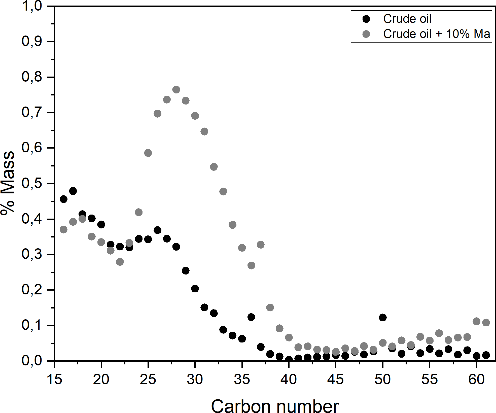
For simplicity of representation in graphs and tables, microwax is represented as Mi and macrowax as Ma. The chromatographic analysis was performed to determine the wax content in the oil, providing a detailed characterization of the hydrocarbons responsible for the deposition phenomenon. This technique identified the oil’s carbon composition, highlighting the distribution of different alkanes that contribute to wax crystal formation under specific thermodynamic conditions. The identified carbon composition is shown in Figure 1, which emphasizes that the predominant fraction is represented by carbons below 35, commercially related to macrowax. Regarding the total wax content, values of 11.1 ± 0.3%, 17.0 ± 0.4%, and 18.5 ± 0.2% were obtained for crude oil, crude oil with 10% micro, and crude oil with 10% macro, respectively.
A
B
Viscoelastic and Thermal Behavior
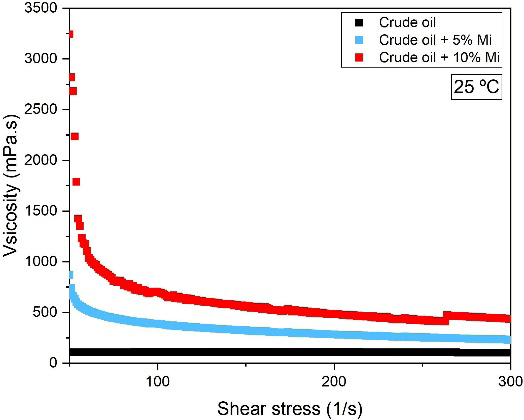
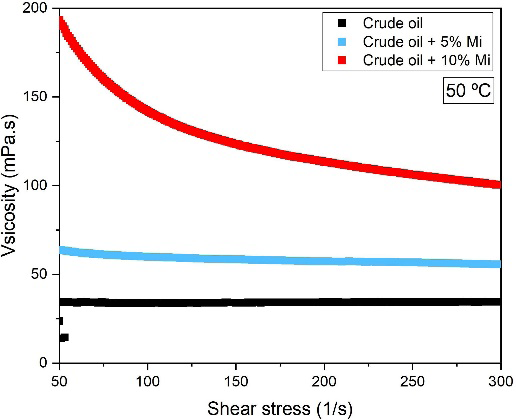
In the viscosity measurement, a Newtonian fluid behavior was observed (Figure 2) for crude oil at both temperatures. However, for crude oil samples with microwax addition, a different behavior was observed: with 5%
B
A
micro, a Newtonian behavior was observed above the WAT (50°C), unlike the crude oil with 10% micro, which is non- Newtonian even at 50°C. However, below the WAT (25°C), the addition of microwax straightened the network, promoting pseudoplastic behavior at low shear rates (below 100 s_−_1).
From the temperature ramp presented in Figure 3, a Newtonian behavior was observed until the onset of crystallization (WAT). It is important to note that the wax appearance temperature (WAT) was observed for all samples and showed an increase proportional to the amount of wax present in the formulation. This gradual increase in WAT indicates a direct relationship between wax content and the point at which the viscous properties of the fluid begin to be affected by crystal formation. In addition, the viscosity results in the lower temperature suggest that adding microwax strengthens the crystal network, contrary to the behavior observed in the model oil [5]. Despite the differences in wax content, the samples exhibited remarkably similar WAT behavior, which was not initially expected. Based on the findings in the literature, the expectation was that, for the quantities tested, the differences in WAT would be considerably greater. This suggests that although wax concentration influences the crystallization temperature, other factors, like oil composition, affect the fluid’s viscous behavior.
![Figure 5: Yield Stress measured for samples tested with different amounts of microwax This behavior was also observed in another study Li, et al. [20] where the authors evaluated the crude oil yield stress for three different initial temperatures and detected that, even with similar behavior, the tension at the breaking point between the samples was different, highlighting the pretreatment carried out for each.](/fulltextimages/14048/fig_5.png)
These results align with the findings of Tang [17], who investigated the effects of asphaltene and resin addition on crude oils. The study revealed that when the resin content in the sample is below 25%, the viscosity gradually increases and the oil behaves as a sol system. However, once the resin content exceeds 25%, the system undergoes a sudden transition into a gel state, marked by an exponential rise in viscosity. A similar behavior is observed with the addition of asphaltenes. This result demonstrates how both the individual quantity of each component and its interactions within the oil significantly influence its viscosity behavior. The combined effects of these factors determine the extent to which the oil’s resistance to flow changes, highlighting the complex relationship between composition and rheological
B
A
properties. Another example of these interactions is shown in the work of Ligeiro, et al. [5], in a model oil composed only of micro and macrowax, in which the increase of microwax drastically reduces the viscosity of the oil, contrary to what was observed in this work.
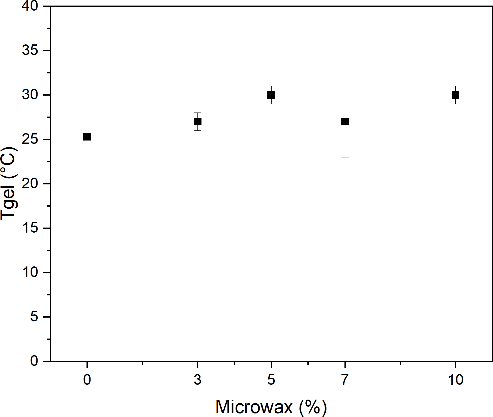
The results obtained from the oscillatory tests are presented in Figure 4 and provide a detailed view of the viscous (G”) and elastic (G’) behavior of the samples, clearly showing the transition between these behaviors (Figure 4). All samples showed similar patterns of behavior, suggesting that the presence and amount of microwax uniformly affect the viscoelastic properties of the material.
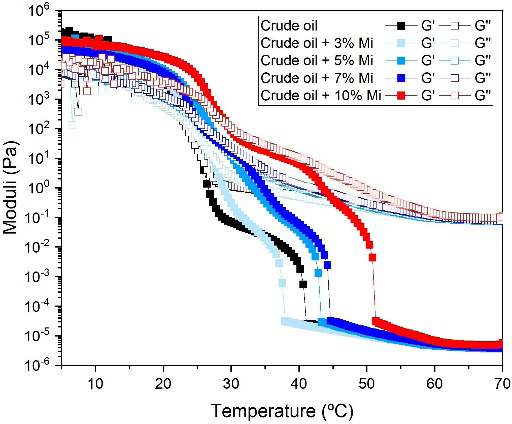
The similarity in viscoelastic behavior observed across the samples underscores the reliability of these results. It suggests that, despite differences in wax concentration, the impact on loss and storage moduli follows a consistent and predictable pattern. This indicates that variations in wax content do not significantly alter the fundamental viscoelastic response, making the system more controllable. Besides that, the addition of microwax did not differ in terms of gelation temperature (Figure 4B), which again shows that crude oil is a complex system influenced by many factors and not only the amount of wax, unlike what was observed by Ligeiro, et al. [5], who noted a change in the temperature at which the crystals appeared (Tgel) with the amount of wax. They also observed that Tgel increased proportionally to higher microwax content, contrary to what happened in this work. Based on our findings, we conclude that the combination of macrowax and microwax as a model system does not fully represent the rheological behavior of crude oil. The observed increase in yield stress and viscosity after the addition of microwax suggests that other components present in crude oil, such as resins and asphaltenes, may serve as a bridge agent between wax crystals, enhancing the interactions between the two wax fractions and contributing to the structural integrity of the system.
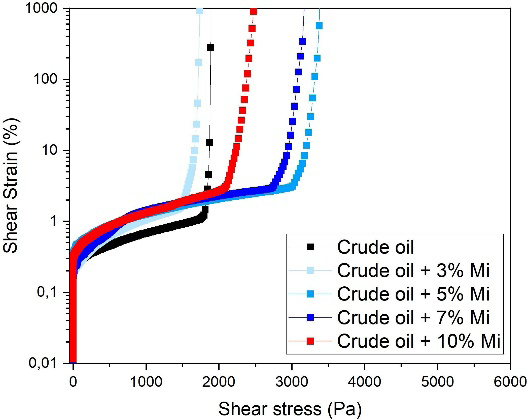
Like the oscillatory tests, the yield stress analysis showed a similar rheological behavior among all samples,
B
A
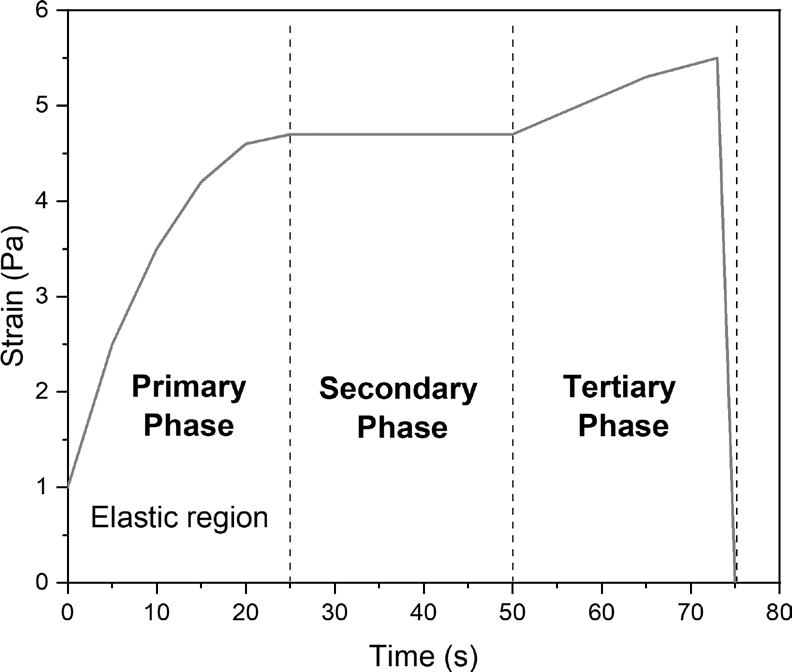
indicating coherence in the sample deformation pattern. However, a notable difference was observed in the rupture strength of the gel, with the highest stress recorded in the sample containing 5% and 7% of microwax (Figure 5B), reaching approximately 3000 Pa. Apparently, for the crude oil tested, there is a concentration threshold beyond which the yield stress is not affected. This study confirms the significant influence of microwax on the rheology of the fluid, highlighting the changes in the viscoelastic properties. The samples also present the three parts necessary for identification, namely elastic response, creep, and failure [18] (Figure 6). The transition from elastic response to creep (first curve, near zero stress in the Figure 6) corresponds to the first yield stress or elastic limit yield stress; the stress at the onset of fracture (i.e. the second curve) corresponds to the second (or static) yield stress; the third (or dynamic) yield stress can be measured after the structure has finally fractured by sustained shear [19].
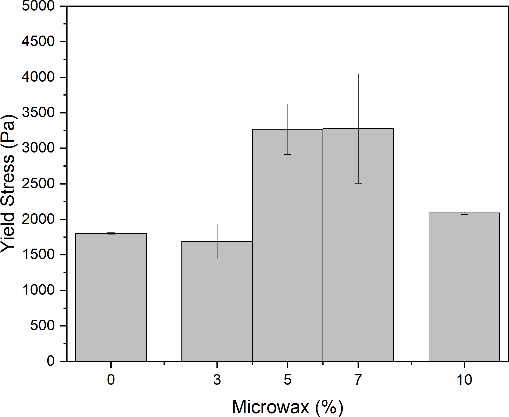
Figure 5: Yield Stress measured for samples tested with different amounts of microwax This behavior was also observed in another study Li, et al. [20] where the authors evaluated the crude oil yield stress for three different initial temperatures and detected that, even with similar behavior, the tension at the breaking point between the samples was different, highlighting the pretreatment carried out for each.
The increase in yield stress can be mainly explained by the formation of more robust and interconnected crystalline structures in the fluid. In model oils, microwax molecules can increase the viscosity to behave like a non-Newtonian fluid but do not lead to the formation of a gel [4]. So, the increase in the yield stress may be related to the interaction of microwax with other compounds in the oil, and strengthening or increasing the interaction between paraffin crystals, thereby creating a three-dimensional network. This difference in the network can increase cohesion among the other molecules present, making their movement difficult and, consequently, increasing resistance to flow. These crystalline structures act as physical barriers that need to be overcome for the fluid to begin flowing. Therefore, a greater amount of energy (represented by tension) is needed to break these structures and start the oil flow.
Considering the work carried out by Ligeiro, et al. [5], where the addition of microwax drastically reduced the yield stress for model oil, it is clear that there is an interaction between wax and other compounds in the oil, allowing this increase in viscosity, which consequently increases the yield stress, a behavior that is not observed for model oil. Besides that, a different behavior is observed for crude oil with 10% of wax. The tension required for the fluid to flow is smaller than that of samples with 5% or 7% wax. This behavior may result from the fact that, at a certain point, the network reaches a critical strength beyond which it cannot deform further and so it fractures. A similar behavior was observed in a study on the strength of a mineral oil with 5% of wax [21]. The authors
B
A
reported that there is a non-monotonic response of waxy oil gel strength to cooling rate, meaning that at low rates, the predominant factor is adhesive failure, which is the fracture of the surface-gel interface, but at high rates, where there is a greater number of small crystals, a cohesive failure occurs, which is the rupture of the gel itself. Thus, for gels with a high wax content, the structure may form several nuclei with small crystal sizes, as there is insufficient space in the network for their growth when compared to an oil with a lower wax content, which has an opening for crystal growth.
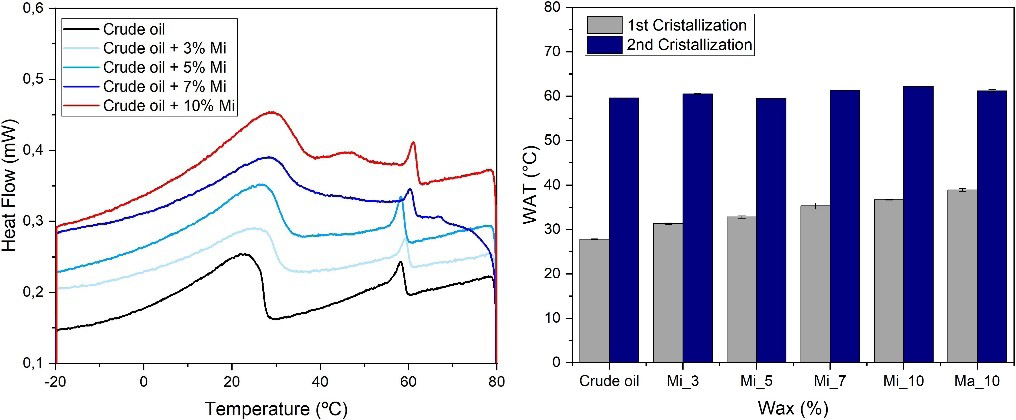
Figure 7 contains the results regarding thermal behavior obtained by DSC (Differential Scanning Calorimetry). The samples exhibited a consistent trend concerning the WAT (Wax Appearance Temperature), which agrees with the results of the viscosity analysis. Due to the different instrumental sensitivities, DSC can detect the initial formation of paraffin crystals at higher temperatures than those indicated by rheological changes, as it captures enthalpic variations associated with nucleation and crystal growth at the molecular level. In contrast, the rheometer only detects transitions when the formed solid fraction is sufficient to significantly affect the fluid’s viscosity. Therefore, the WAT determined from viscosity can be associated with the 2nd crystallization event (second peak) observed in the DSC thermogram, indicating a later and more pronounced stage of crystallization. Therefore, there was a slight, direct, and proportional increase in WAT associated with the 2nd crystallization event, as the wax content in the sample increased (Figure 7).
With respect to the first crystallization event, no significant differences were detected upon increasing the microparaffin content, most likely because the amount incorporated was insufficient to induce a measurable change in enthalpy. When these results are compared with previous studies [4, 5], a remarkable consistency can be observed. In particular, similar patterns are observed in the visualization of macrowax (2nd crystallization event) and microwax (1st crystallization event) peaks, the former being more intense at around 20 °C and the latter around 60 °C, indicating a congruence in thermal behavior, thus reinforcing the validity and reliability of these findings. This observation is coherent considering that the carbon chain distribution of microwax does not follow a normal distribution and contains a significant proportion of heavier hydrocarbons, ranging from _C_50 to _C_60, which consequently shifts the WAT peak toward higher temperatures.
Effect of Macro and Microwax in Crude Oil
Based on the fact that composition is a critical factor in the deposition process, we also investigated the effect of macrowax (Figure S1) on crude oil at a concentration of 10%. This wax consists of relatively small hydrocarbon chains, typically shorter than _C_40, and due to their higher crystallization tendency, they can exert a pronounced effect even at low concentrations. Detailed analysis of these samples showed that the presence and proportion of wax greatly impact the thermal and viscoelastic properties of the oil.
Observing the viscosity curve (Figure 8A), it can be seen that macrowax exerts a greater influence than microwax, with a large slope at temperatures lower than WAT, probably due to the needle or platelet crystals present, which can arrange themselves and form a stronger structure [15, 16]. The elastic (G’) and viscous (G”) moduli also showed interesting results (Figure 8B). The crude oil with microwax started its structuring at higher temperatures than the oil with macrowax, around 55 °C and 45 °C, respectively; however,
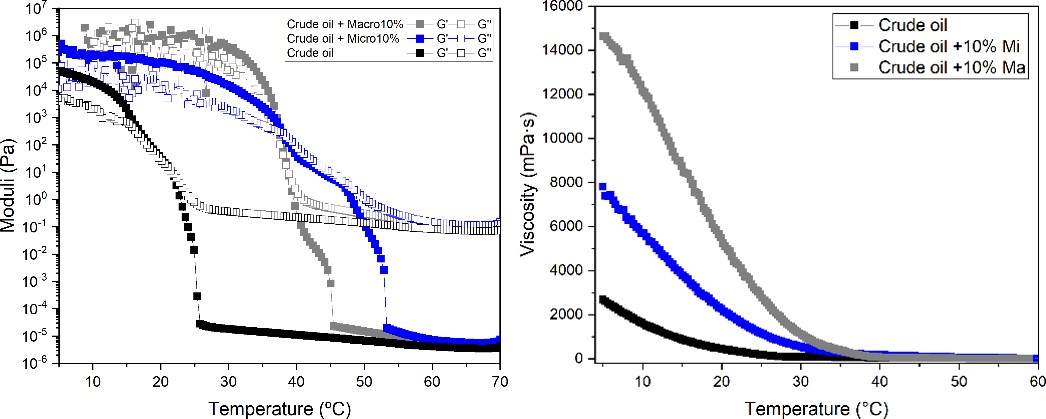
B
A
regardless of this difference, the gelation temperature was almost the same, being 38.0 ± 0.0 °C for crude oil with microwax and 39.0 ± 0.7 °C for crude oil with macrowax.
The results suggest that macrowax exerts a more pronounced effect on the final viscosity of the sample than on parameters such as the gelation temperature (Tgel) and WAT, which stresses the importance of the microstructure formed, as evidenced by microscopy studies [5]. However, considering the tests with both micro- and macrowax and the key rheological parameters evaluated, the total wax content appears to be the dominant factor influencing the system’s behavior rather than the specific wax type. Accordingly, the presence of short- or long-chain, cyclic, or branched wax molecules can significantly alter the viscosity and elasticity of the oil, de- pending on their concentration. Therefore, precise control of wax content is essential for tailoring the viscoelastic properties of crude oil to meet specific processing or operational demands.
Conclusion
Based on viscosity and Moduli G’ and G”, it is evident that the different percentages of microwax greatly impact the viscosity of the samples, with an increase directly proportional to the amount of paraffin. Surprisingly, no substantial differences in viscoelastic behavior were observed between the samples, even when completely crystallized, resulting in a gelation temperature with almost no variation. However, yield stress varied between samples, as did WAT, as identified by DSC. Overall, the findings suggest that total wax content has a greater impact on the rheological behavior of waxy oils than the specific type of wax. While macrowax affects viscosity more strongly than gelation temperature, the internal structure formed remains a key factor. These results highlight the complexity of the interactions between wax and the other components of crude oil, emphasizing the importance of a comprehensive analysis to fully understand their behavior under different conditions. A correct understanding of these interactions is central for developing accurate predictive models of wax behavior and, consequently, the wax deposition phenomenon.
Acknowledgements
We gratefully acknowledge the support of EQUINOR for their funding and support, as well as the ANP (Brazil’s National Oil, Natural Gas, and Biofuels Agency) for assistance through the R&D levy regulation. We also thank the ALFA - Artificial Lift and Flow Assurance Research Group, hosted by the Center for Energy and Petroleum Studies (CEPETRO) at the Uni- versidade Estadual de Campinas (UNICAMP), Brazil. Special thanks to CEPETRO-UNICAMP and FEM-UNICAMP for their collaboration.
References
-
Zhu H, Lei Y, Yu P, Li C, Yao B, et al. (2024) Novel high- precision wax molecular diffusion coefficient correlation based on the diffusion laboratory apparatus coupled with differential scanning calorimeter. Fuel 355: 129452.
-
Fan K, Li S, Li R (2021) Development of wax molecular diffusivity correlation suitable for crude oil in wax deposition: Experiments with a cold-finger apparatus. J Petrol Sci Eng 205: 108851.
-
Van der Geest C, Melchuna A, Bizarre L, Bannwart A C, Guersoni V C B (2021) Critical review on wax deposition in single-phase flow. Fuel 293: 120358.
-
Kurniawan M, Subramanian S, Norrman J, Paso K (2018) Influence of Microcrystalline Wax on the Properties of Model Wax-Oil Gels. Energy and Fuels 32(5): 5857-5867.
-
Ligeiro T, Bizarre L, Pinheiro IF, Bannwart AC, van der Geest C, et al. (2023) Beyond the wax concentration; how micro/macro wax ratios change thermal, rheological, and morphological properties of the waxy system. Energy & Fuels 37(21): 16345-16353.
-
Marinho TO, De Oliveira MCK, Nele M (2019) Experimental investigation of the rheology and crystal morphology of model waxy oils under gelling conditions. Energy & Fuels 33: 9604-9618.
-
Zhao Y, Kumar L, Paso K, Ali H, Safieva J, et al. (2012) Gelation and breakage behavior of model wax–oil systems: Rheological properties and model development. Ind Eng Chem Res 51(23): 8123-8133.
-
Zaky MT, Mohamed NH (2010) Comparative study on separation and characterization of high melting point macro- and micro-crystalline waxes. J Taiwan Inst Chem Eng 41(3): 360-366.
-
Vignati E, Piazza R, Visintin RFG, Lapasin R, D’Antona P, et al. (2005) Wax crystallization and aggregation in a model crude oil. J Phys Condens Matter 17(45): S3651-S3660.
-
Andrade DEV, da Cruz ACB, Franco AT, Negrão COR (2015) Influence of the initial cooling temperature on the gelation and yield stress of waxy crude oils. Rheol Acta 54: 149-157.
-
Marchesini F, Alicke AA, Mendes PRS, Ziglio CM (2012) Rheological characterization of waxy crude oils: Sample preparation. Energy & Fuels 26(5): 2566-2577.
-
Helsper S, Liberatore MW (2024) Wax appearance temperature under shear in methane-saturated mineral oil + paraffin wax mixtures: Effects of concentration and pressure. Fuel 357(Part A): 129671.
-
Quan Q, Gong J, Wang W, Gao G (2015) Study on the aging and critical carbon number of wax deposition with temperature for crude oils. J Petrol Sci Eng 130: 1-5.
-
Thanh NX, Hsieh M, Philp R (1999) Waxes and asphaltenes in crude oils. Org Geochem 30(2-3): 119-132.
-
Yang F, Zhao Y, Sjöblom J, Li C, Paso K G (2015) Polymeric wax inhibitors and pour point depressants for waxy crude oils: A critical review. J Dispersion Sci Technol 36(2): 213-225.
-
Rehan M, Nizami A, Taylan O, Al-Sasi A O, Demirbas A (2016) Determination of wax content in crude oil. Petrol Sci Technol 34(9): 799-804.
-
Tang X, Duan W, Xu K, Zheng C (2022) Three-dimensional network gel structure and viscosity reduction mechanism of heavy oil. Colloids Surf A Physicochem Eng Asp 653: 130060.
-
Chang C, Boger D V, Nguyen Q D (1998) The yielding of waxy crude oils. Ind Eng Chem Res 37(4).
-
Wardhaugh LT, Boger DV (1991) The measurement and description of the yielding behavior of waxy crude oil. J Rheology 35: 1121-1156.
-
Li M, Sun M, Lu Y, Zhang J (2017) Experimental study on the strength of original samples of wax deposits from pipelines in the field. Energy & Fuels 31(11): 11977- 11986.
-
Andrade DE, Neto MAM, Negrão CO (2018) Non- monotonic response of waxy oil gel strength to cooling rate. Rheologica Acta 57: 673-680.
- Nigeria’s Vulnerability in the Face of Global Energy Policy
- A Simulation Study of Investigation of Optimum Oil Production Performance by Applying Various Gas Injection Methods in Oil Reservoir
- Characterization of Permo-Triassic Reservoirs through Thermal Maturity Assessment of Westphalian Source Rocks in the Cheshire Basin
- Real-Time Monitoring and Performance Optimization of Steam Injection in Heavy Oil Reservoirs Using Fiber Optic Sensing and Integrated Predictive Simulation Models
- Rapid On-Site Determination of the Total Petroleum Hydrocarbon Content of Soils by Handheld Fourier Transform Near-Infrared Spectroscopy: Development of a Global, Site- and Scanner- Independent Calibration Model
- Isothermic, Kinetic and Thermodynamic Studies of Chromium (VI) Ions Adsorption on Composite Adsorbent of Chitosan- Eggshell Activated Carbon