Characterization of Permo-Triassic Reservoirs through Thermal Maturity Assessment of Westphalian Source Rocks in the Cheshire Basin
The Permo–Triassic succession of the Cheshire Basin exhibits complex geological controls on its hydrocarbon prospectivity. This study integrates 3D reservoir modeling in Petrel with thermal maturity and burial history analysis to assess reservoir quality, source rock potential, and trap effectiveness. Facies analysis reveals strong spatial variability, with aeolian-dominated deposits in the north, alternating aeolian–fluvial facies in the south, stable fluvial systems in the east, and channel-fill deposits in the west. Thermal maturity evaluation of the Westphalian Coal Measures Formation indicates moderate source rock potential. Burial history modeling identifies two main burial phases but suggests that maximum temperatures were insufficient for significant oil generation; however, localized wet gas generation is possible. Despite the presence of favorable source and reservoir units, the lack of commercial discoveries is attributed to ineffective sealing. Major fault systems dissect both reservoir and seal units and extend to the surface, enabling vertical hydrocarbon leakage. Hydrocarbons may have been sourced from the Holywell Shale in the adjacent East Irish Sea Basin. Structural leakage is therefore considered the primary limitation to effective hydrocarbon entrapment in the Cheshire Basin.
Introduction
Hydrocarbon exploration plays a central role in global energy strategies [1, 2, 3]. Sedimentary basins serve as key repositories of organic-rich layers that facilitate the generation, migration, and trapping of petroleum [4, 5, 6]. A systematic and integrated characterization of these basins is crucial for improving exploration success rates and minimizing geological uncertainty, particularly in frontier regions. Within the United Kingdom, the Permo-Triassic basins exhibit a broad spectrum of petroleum systems, ranging from mature, high-yield provinces, such as the East Irish Sea Basin, to underexplored and geologically complex regions, like the Cheshire Basin.
The Cheshire Basin, situated in northwestern England, represents a Late Paleozoic to Mesozoic extensional basin characterized by a classic half-graben geometry (Figure 1A) [7, 8, 9, 10]. It is primarily composed of Triassic fluvial sandstones and mudstones, which unconformably overlie eroded Carboniferous strata [11]. Structurally, the basin is dissected by numerous normal faults, particularly concentrated along its eastern and southeastern margins, resulting in significant compartmentalization of the subsurface architecture. The basin is subdivided into two major structural domains: the Wem–Audlem sub-basin to the south and the Sandbach– Knutsford sub-basin to the north (Figure 1B) [7]. Despite its proximity to productive hydrocarbon provinces—notably the East Irish Sea and East Midlands basins—and the presence of potential reservoir-quality lithologies, the Cheshire Basin has yet to yield any commercial hydrocarbon discoveries [12, 13]. As a result, it remains classified as a non-productive or frontier exploration basin [14, 15].
Hydrocarbon exploration in the Cheshire Basin dates to the late 18th century, marked by early reports of natural gas seepages, most notably at the Coalport Tar Tunnel [14-
16]. However, the absence of advanced subsurface imaging and drilling technologies during this early period limited systematic exploration and geological characterization. Modern exploration efforts began in the 1970s, facilitated by the acquisition of 2D seismic data and the drilling of ten exploration wells [17]. Although minor hydrocarbon shows were encountered, none of the wells yielded commercially viable accumulations. This failure has been primarily attributed to poor reservoir quality and limited hydrocarbon saturation, leading to the subsequent plugging and abandonment of all wells [8, 9]. A major geological constraint on the basin’s petroleum system is the extensive pre-Permo- Triassic erosion of Carboniferous source rocks, which likely disrupted the essential source–reservoir–seal relationships required for effective hydrocarbon generation, migration, and entrapment [18, 19]. In addition, the identification of prospective structural traps has been hindered by the basin’s complex fault architecture and the limited resolution of early seismic datasets [20]. These geological and technical limitations have collectively contributed to the Cheshire Basin’s continued classification as an underexplored and non-productive frontier region [16, 18, 19].
![Figure 1: A) Map showing the location of the study area in the UK. B) Geological outcrop map of the Cheshire Basin highlighting key stratigraphic formations and structural features [21].](/fulltextimages/14130/fig_1.jpeg)
Nevertheless, the basin’s western margin, adjacent to the East Irish Sea Basin, remains of interest due to the inferred preservation of deeply buried Carboniferous source rocks and potential trap configurations. Comparative stratigraphic and structural parallels with neighboring productive basins further underscore the need to reassess the petroleum system elements of the Cheshire Basin, including source rock maturity, reservoir quality, and trap integrity [14, 15, 22].
Recent advances in subsurface reservoir characterization and modeling have demonstrated the value of integrated analytical and numerical approaches for understanding fluid flow behavior, storage efficiency, and uncertainty in complex geological systems. Sector-scale reservoir simulations have been widely used to evaluate multiphase flow dynamics under different injection strategies, including continuous and water-alternating-gas (WAG) schemes, providing insights into recovery mechanisms and subsurface performance [23]. Furthermore, hysteresis-aware modeling has been shown to play a critical role in accurately capturing gas–water flow behavior and storage efficiency in CO₂-based injection processes, particularly in heterogeneous reservoirs [24]. Complementary to numerical modeling, pressure transient analysis techniques have proven effective in diagnosing fluid soaking, fracture connectivity, and flow regimes in multi-fractured reservoirs, offering valuable constraints for reservoir-scale interpretation and model calibration [25]. Collectively, these studies highlight the importance of integrated geological, petrophysical, and modeling workflows, which form the methodological foundation for the basin-scale characterization undertaken in this study.
This study aims to provide a comprehensive re- evaluation of the Cheshire Basin’s hydrocarbon potential through a synthesis of existing seismic, stratigraphic, and well data. By revisiting its tectonostratigraphic framework and exploration history, the research seeks to elucidate the geological factors that have limited its exploration success, while identifying underexplored domains that may offer future prospectivity under updated models of basin evolution and petroleum systems analysis.
Geological and Tectonic Framework of the Cheshire Basin
The Cheshire Basin, located in the northwest Midlands of England, is a well-documented example of a fault- bounded, Permo-Triassic extensional rift system, covering an area of approximately 3,500 km² [26]. It forms part of a broader NNW–SSE trending rift corridor that extends from the Inner Hebrides in northwest Scotland to the Wessex Basin in southern England [8, 9]. The basin exhibits significant structural complexity, underlain by a deeply eroded Lower Palaeozoic basement considered overmature for hydrocarbon generation [27]. Overlying this basement are a series of Carboniferous sub-basins that formed within the Variscan foreland and are bounded by NE–SW trending faults (Figure 2) [26, 28]. These faults were later reactivated during Permian extension, serving as primary controls on syn-rift subsidence, accommodation space, and sediment dispersal [10, 11]. The basin fill comprises a thick sequence of Permian to Triassic siliciclastic sediments, notably the Collyhurst Sandstone, Sherwood Sandstone Group, and Mercia Mudstone Group, deposited during phases of active rifting and subsequent post-rift thermal subsidence [26].
![Figure 2: The NW–SE geological cross-section of the Cheshire Basin, showing major fault systems and stratigraphic units [28].](/fulltextimages/14130/fig_2.jpeg)
The post-rift tectonic evolution of the Cheshire Basin was characterized by ongoing thermal subsidence into the Jurassic, evidenced by the preservation of Lower Jurassic strata within structurally controlled depocenters. As illustrated in Figure 3, these deposits reflect early basin inversion processes, likely triggered by compressional reactivation of extensional faults [8, 9]. Additionally, the westward migration of depocenters during the Permian and Early Triassic, driven by differential subsidence and fault-controlled sedimentation, contributed to the basin’s complex internal geometry. Structurally, the basin has undergone multiphase tectonic overprinting, including later-stage inversion associated with the Alpine Orogeny [10, 26]. Seismic interpretation indicates that many of the basin’s faults are inherited from pre-existing Carboniferous structures, adding to the structural heterogeneity and complicating the development of effective hydrocarbon traps [20]. These geological complexities—combined with post- depositional uplift, erosion, and glacial modification during the Cenozoic and Quaternary—have significantly influenced the basin’s hydrocarbon prospectivity [29].
![Figure 3: Stratigraphic column of the Cheshire Basin indicating key lithological units, with major source and potential reservoir rocks highlighted in yellow [8,9].](/fulltextimages/14130/fig_3.jpeg)
Methodological Framework
Study Well
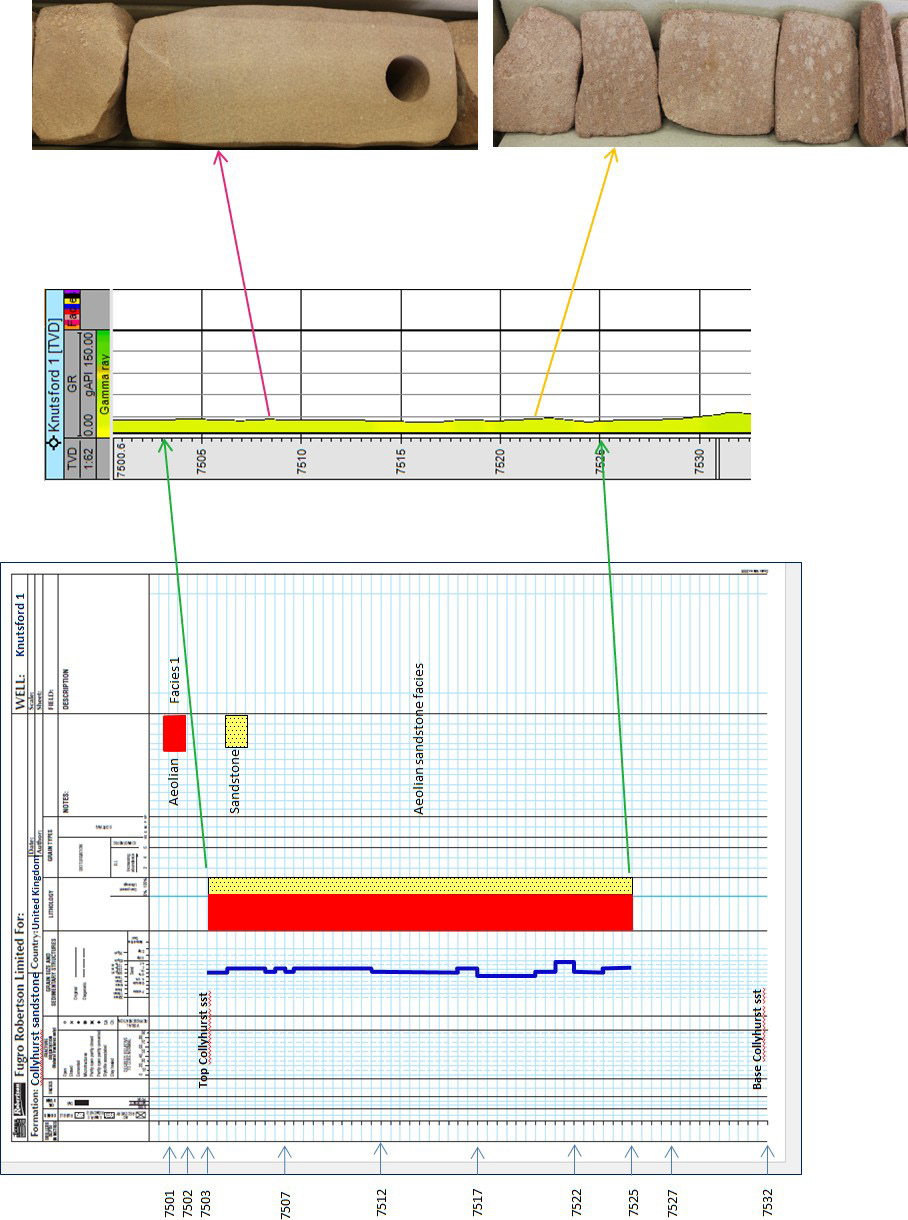
The LJ-23-1_Knutsford 1 well is situated in the northern sector of the Cheshire Basin and was drilled by British Gas (UKOGL Well ID: 000136) to explore conventional oil and gas resources. Drilling commenced on 9 October 1973 and was completed on 20 February 1974 [21]. The well was drilled vertically (non-deviated) from a surface location at British National Grid Coordinates X = 370270, Y = 377860 (Figure 4). The measured depth reference point was the Kelly Bushing, with a datum elevation of 150 ft (45.7 m) above mean sea level and a ground level of 130 ft (39.6 m). The surface formation is Quaternary in age, comprising unconsolidated to weakly consolidated sediments. Multiple cores were recovered at various depths, with the principal zone of interest identified as a reservoir sandstone interval between 7501.23 ft and 7532.65 ft [30]. This interval provides key data for detailed reservoir characterization, including lithological, petrophysical, and depositional analysis.
![Figure 4: Contour map of the Cheshire Basin showing the study location of the Knutsford 1 well, along with Winsford 1, Elworth 1, and Burford 1 for comparative analysis. Data sourced [30,31].](/fulltextimages/14130/fig_4.jpeg)
Components of Methodology
This study employs an integrated methodological framework to evaluate the hydrocarbon potential of the Cheshire Basin. The approach is bifurcated into two major components. The first involves thermal modelling of the Westphalian Coal Measures using Genesis software, aimed at assessing the timing of hydrocarbon generation, maturation, and expulsion. The second component entails the construction of a three-dimensional reservoir model of the Permo-Triassic sequence using Petrel, which facilitates detailed analysis of the reservoir architecture, facies distribution, and potential storage capacity. The outputs from both Genesis and Petrel are synthesized to provide a comprehensive interpretation of the basin’s petroleum system. This integration allows for the assessment of source rock effectiveness and reservoir quality, providing insights into the basin’s overall prospectivity for hydrocarbon exploration.
Thermal Modelling
Genesis Modelling Approach
Thermal modelling is critical in delineating the burial history and thermal evolution of source rocks. The Westphalian Coal Measures, serving as the principal source rock in the basin, are evaluated for Total Organic Carbon (TOC), Hydrogen Index (HI), and vitrinite reflectance (%Ro). These parameters inform the modelling of organic matter transformation and hydrocarbon expulsion timing.
The Genesis software enables the creation of one- dimensional burial and thermal models calibrated against known temperature profiles. This model requires the following datasets:
- Heat flow values
- Vitrinite reflectance (%Ro)
- Stratigraphic formation depths and lithologies
- Hydrogen Index (HI)
- Total Organic Carbon (TOC)
Data Availability and Control
The Westphalian Coal Measures were encountered at 9,257 ft in the Knutsford 1 well. Depth and lithology data were sourced from the UK Onshore Geophysical Library (UKOGL), while heat flow and %Ro values were digitized from graphs published by Vincent and Andrews. Geochemical parameters were obtained from Armstrong [27].
Reservoir Modelling
Petrel Modelling Workflow
Reservoir modelling is conducted using Petrel to construct a three-dimensional model of the Permo-Triassic formations. The objective is to interpret reservoir heterogeneity, facies distribution, and depositional environments. The modelling integrates well log data, stratigraphic correlations, and facies interpretation.
Facies modelling was conducted using the Facies Modelling Module, employing both seismic-driven and lithology-driven algorithms. The reservoir comprises two main units: the Collyhurst Sandstone (single facies) and the Sherwood Sandstone Group (four facies: Aeolian, Fluvial, Channel Fill, and Lacustrine). Gamma ray log responses were used for facies discrimination:
- Aeolian facies: Lowest gamma readings
- Channel Fill: Moderate gamma readings
- Lacustrine: Elevated readings due to shale content
- Fluvial: Highest gamma readings indicating high shale content Reservoir zones and stratigraphic surfaces were generated based on correlated facies and horizons. These were integrated into the 3D grid to reflect the spatial distribution of depositional facies and reservoir architecture.
Data Availability and Control
The availability of subsurface data in the Cheshire Basin is limited due to its underexplored nature. Four wells with usable datasets were identified: Knutsford 1, Winsford 1, Elworth 1, and Burford
The availability of subsurface data in the Cheshire Basin is limited due to its underexplored nature. Four wells with usable datasets were identified: Knutsford 1, Winsford 1, Elworth 1, and Burford 1. The Sherwood Sandstone was intersected in all wells, while the Collyhurst Sandstone was restricted to Knutsford 1. Data control challenges included: • Depth unit conversion (meters to feet) • Calibration of wireline logs relative to Kelly Bushing and Mean Sea Level • Manual alignment of log data due to spatial well separation
Core Analysis
Core analysis provides the most direct and detailed insights into subsurface lithology, porosity, permeability, and depositional characteristics. Cores represent physical samples of reservoir formations and are invaluable for validating interpretations derived from wireline data and models.
In this study, the Knutsford 1 well yielded a key core section from 7,501.23 ft to 7,532.65 ft, representing a crucial interval of the target reservoir. Cores were analyzed at the British Geological Survey (BGS) Core Store in Keyworth. Analytical procedures included:
- Cleaning and visual examination of core segments
- Conversion of depth units to match wireline log headers
- Photographic documentation and facies identification Similar integrated reservoir-scale modeling approaches have been widely applied to evaluate fluid flow behavior, recovery mechanisms, and uncertainty in subsurface systems, including CO₂-based injection and alternating gas– water processes [23, 24].
Results
Core Analysis
Core logging at 5-foot intervals assesses grain size, shape, color, and texture. The Collyhurst Sandstone exhibits reddish to brown coloration, planar bedding, and moderate-to-well sorting. Grain sizes range from fine to medium, with sub-rounded to rounded grains. Porosity is inferred as moderate based on absorption tests and loosely packed grains in certain intervals. Gamma ray log correlation confirms a clean reservoir with minimal shale content (Figure 5). Despite the absence of direct porosity logs, the core analysis suggests the Collyhurst Sandstone has favorable reservoir characteristics and should be considered a viable target in future exploration.
Facies Modeling and Reservoir Analysis
Stratigraphic correlations across the basin reveal complex depositional architectures. Knutsford 1 penetrated two reservoirs, while other wells encountered only a single reservoir. The Sherwood Sandstone Group, the primary reservoir, is subdivided into Aeolian, Channel Fill, Lacustrine, and Fluvial facies. The Collyhurst Sandstone, serving as a secondary reservoir, is only present in Knutsford 1 and comprises predominantly Aeolian facies (Figure 6). Gamma ray log data confirms low shale content, indicating clean reservoir intervals.
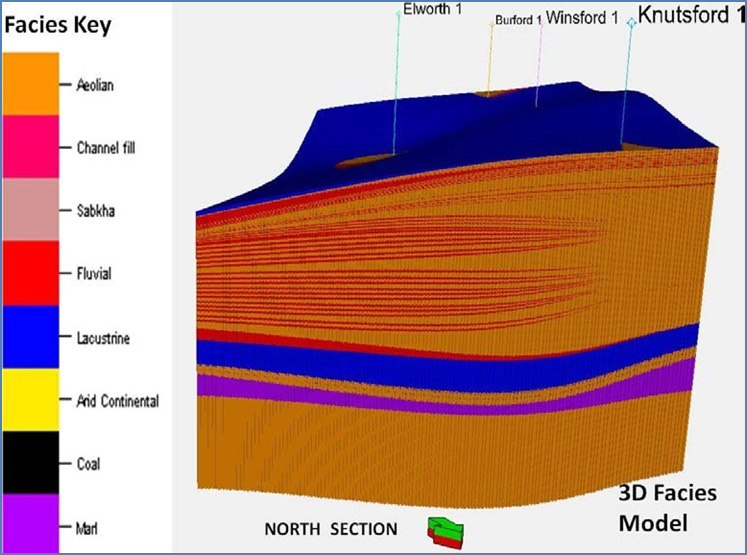
The 3D facies model illustrates spatial variability in depositional environments. Eastern sections display dominant fluvial facies, while northern and western sections show the prevalence of aeolian and lacustrine facies. Manchester Marl acts as a regional seal, although it thins considerably in eastern and southern sections, potentially impacting hydrocarbon trapping efficiency. Facies heterogeneity suggests environmental transition zones that are critical in reservoir quality assessment.
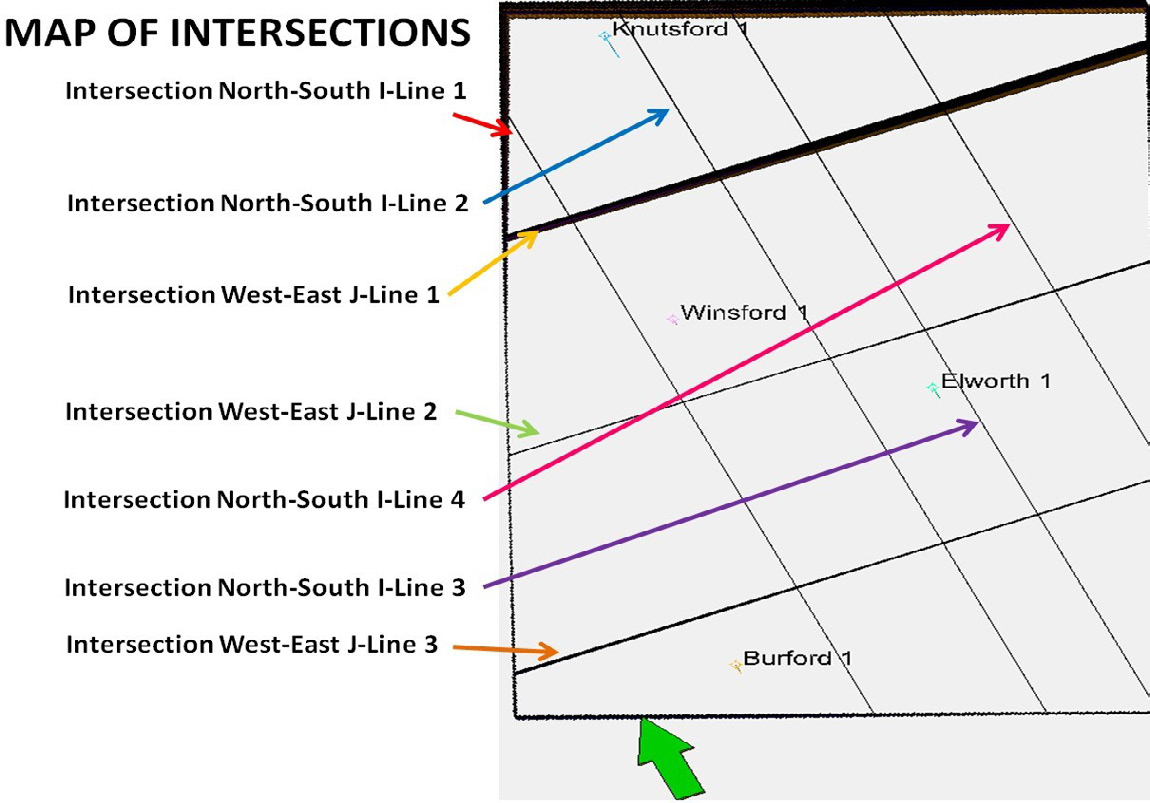
Intersection Analysis
Seven key cross-sections (4 north-south I-lines and 3 east-west J-lines) were analyzed to investigate lateral facies variation (Figure 7). I-line intersections show thickening of aeolian facies to the west and fluvial facies toward the east. J-line intersections highlight lateral pinching and thickening of Manchester Marl and associated facies, suggesting structural controls and differential sedimentation. These variations influence reservoir continuity, porosity trends, and seal efficiency.
Thermal Modeling
As depicted in Figure 8, measured Ro values and modeled trends (ARCO and LL) are plotted against depth. The modeled data show good agreement with the measured
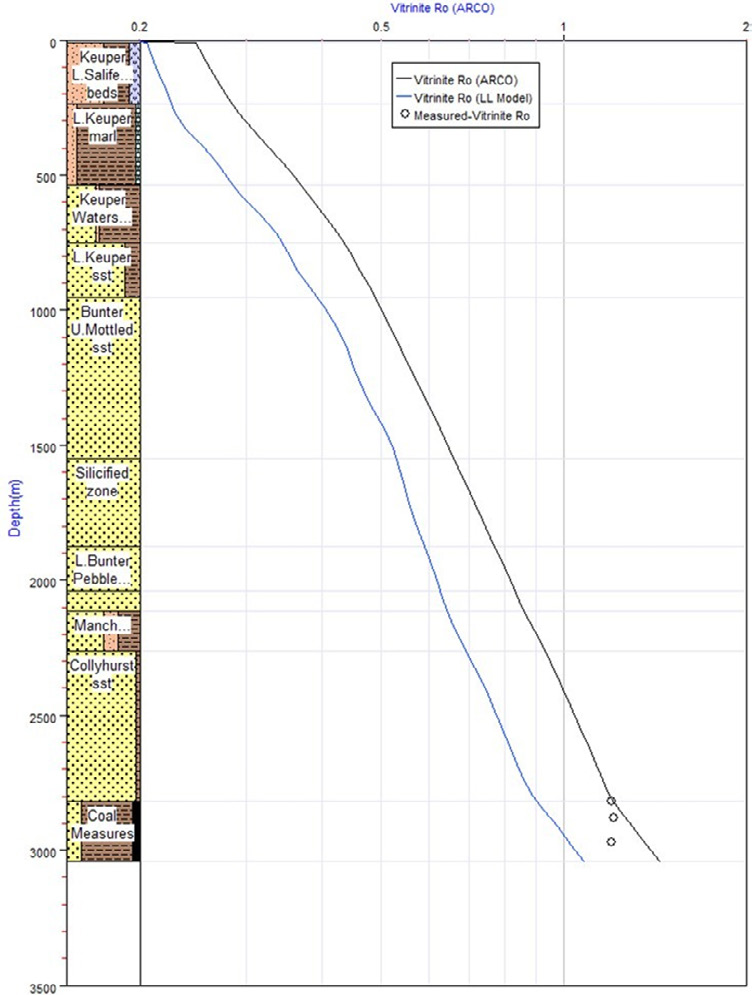
reflectance values, supporting the interpretation that significant hydrocarbon generation from the Coal Measures begins at depths greater than 2900 m.
Maturity Evolution
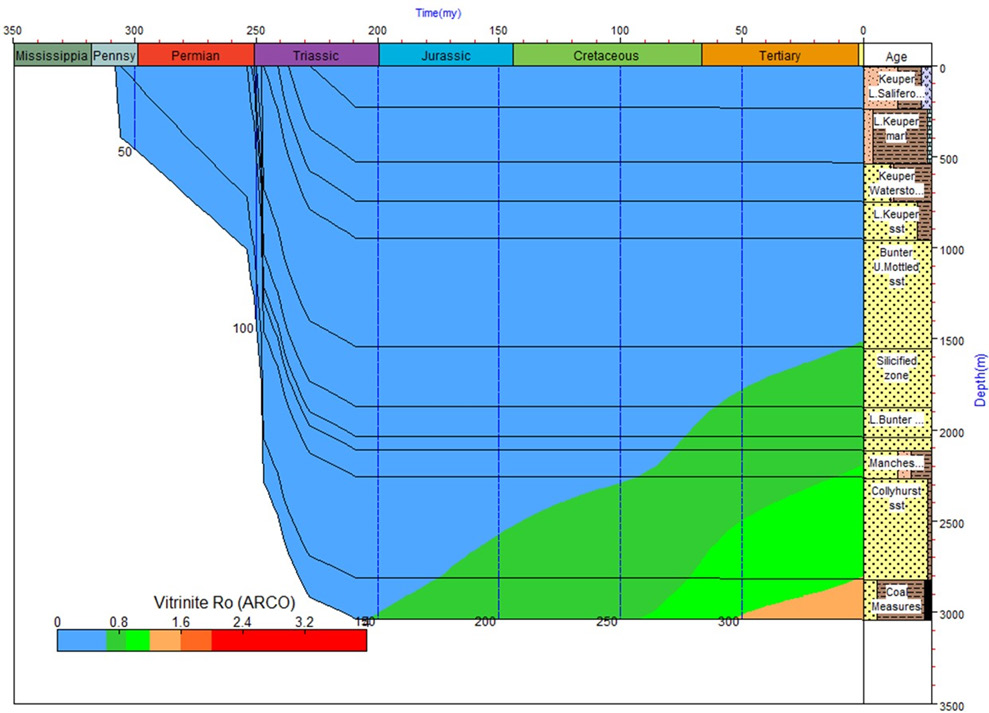
Thermal maturity modeling indicates that the Westphalian Coal Measures entered the early oil window during the Jurassic period (~200 Ma). The main phase of oil generation commenced during the Late Cretaceous (~90 Ma), when burial depths reached approximately 2500 m and temperatures ranged between 120–130°C (Figure 9). Despite reaching depths of ~3000 m during the Triassic, the thermal regime was insufficient for hydrocarbon generation until the Late Cretaceous. By ~50 Ma, conditions favored the onset of wet gas generation.
Burial and Thermal History
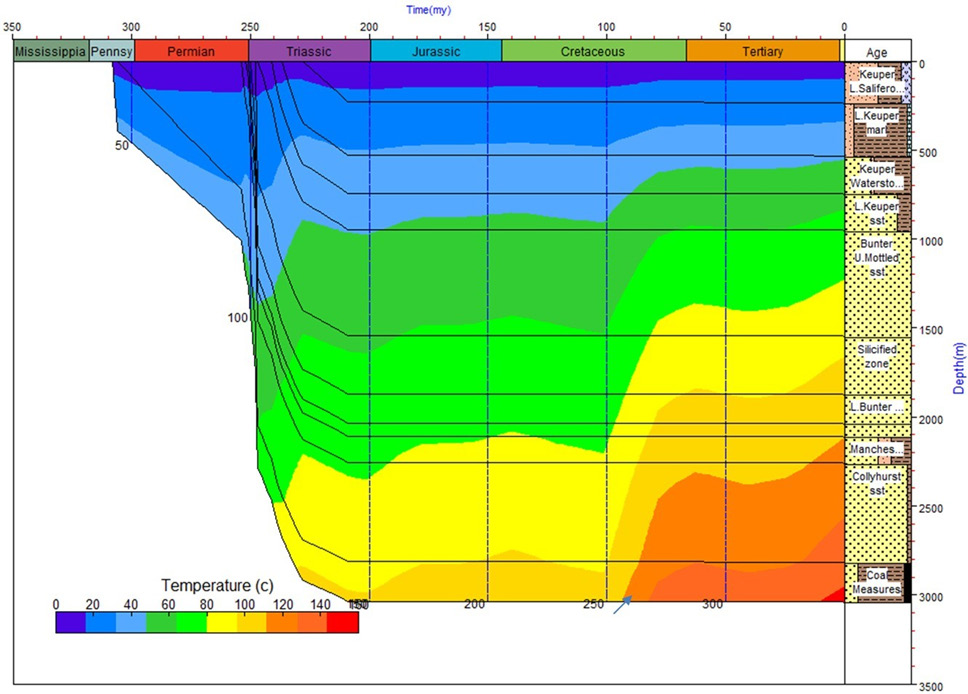
The depth-time-temperature plot (Figure 10) illustrates the burial history of the Westphalian Coal Measures and the thermal environments encountered over time. Although deposition occurred during the Carboniferous, significant thermal maturation did not begin until much later. Dry gas generation temperatures (>140 °C) were only reached during the Late Tertiary. Earlier hydrocarbon expulsion events were limited to wet gas, typically formed at temperatures between 120–140 °C.
Transformation Ratio and Hydrocarbon Expulsion
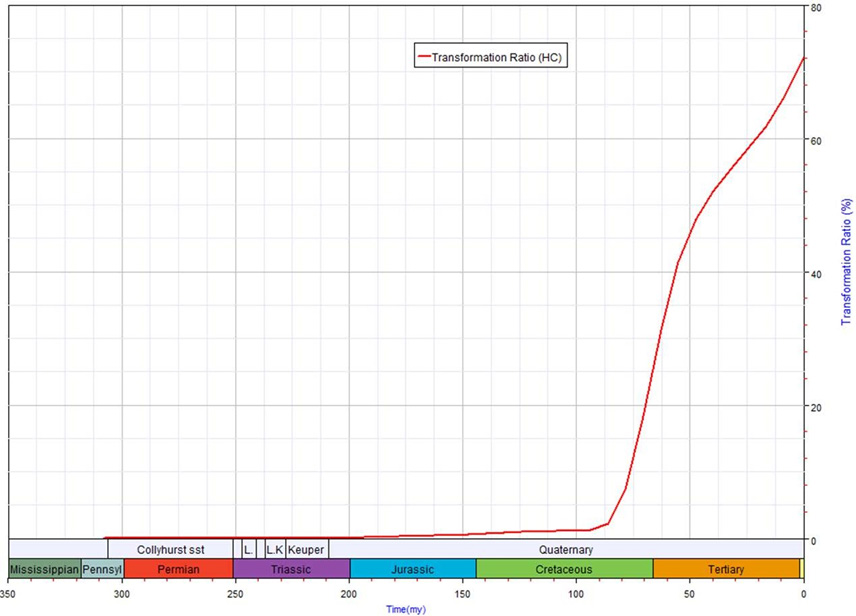
Transformation ratio modeling shows that the conversion of kerogen to hydrocarbons began in the Late Cretaceous and continued through the Tertiary (Figure 11).
Approximately 75% of the total hydrocarbon transformation occurred during this interval. Initial expulsion events were minimal and occurred during the Carboniferous; however, a major expulsion event took place during the Late Cretaceous (~4 gTOC/Ma). A subsequent decline was followed by a secondary peak in the Tertiary (~2.2 gTOC/Ma).
Remaining Hydrocarbon Potential
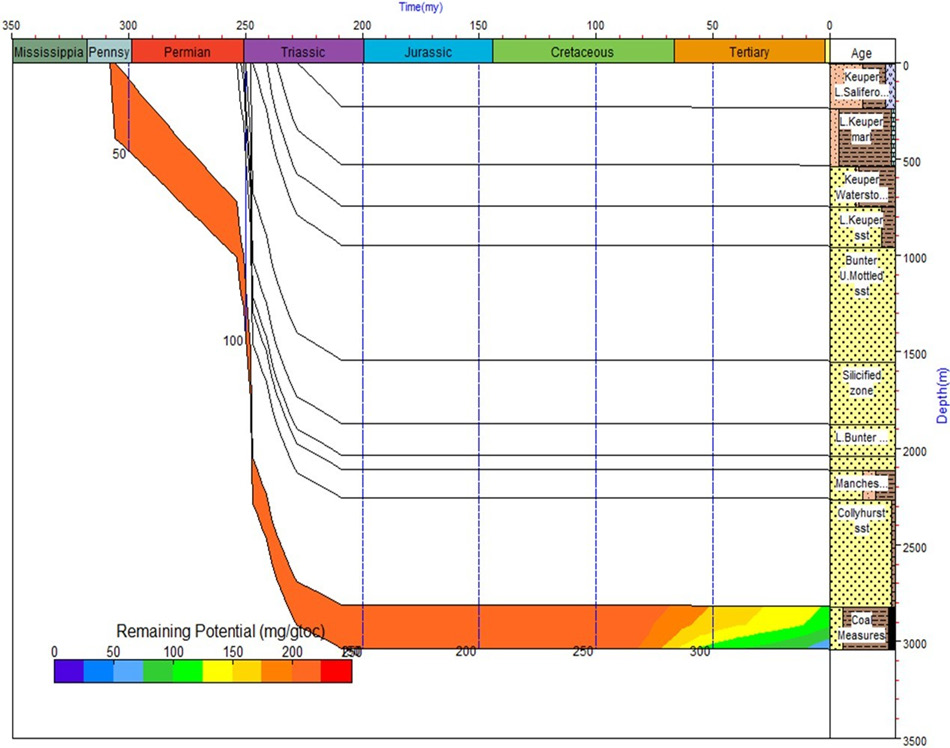
The remaining hydrocarbon generation potential over geological time plot (Figure 12) illustrates the decline in generation potential, with substantial depletion by the Jurassic, indicating early maturation and expulsion of hydrocarbons.
Discussion
The integration of seismic interpretation, facies distribution modelling, and thermal maturity analysis provides a coherent framework for evaluating the petroleum system of the Cheshire Basin. Although key petroleum elements—source rock, reservoir, and seal—are present [30, 32], the basin has yet to yield any significant hydrocarbon discoveries. This apparent contradiction is likely attributed to the complex structural framework and compromised seal integrity, both of which are strongly evidenced by seismic and stratigraphic data.
Seismic profiles across the basin reveal an extensive fault network that disrupts stratigraphic continuity and penetrates key seal units such as the Northwich Halite and Manchester Marl [28, 33]. These formations are typically considered effective seals; however, their breach by post- depositional faulting has likely provided vertical migration pathways for hydrocarbons. Mikkelsen and Floodpage [14, 15] identified that many faults extend to the surface, supporting the hypothesis that these structures have facilitated hydrocarbon leakage. In addition, a significant post-Triassic erosional event has led to the thinning of the Northwich Halite [34], further compromising seal integrity and increasing the risk of hydrocarbon escape.
Facies analysis across the basin confirms significant lateral and vertical heterogeneity, particularly within the Sherwood Sandstone Group [35, 36]. Knutsford 1, the deepest well in the basin, encountered a complete sequence of the Sherwood Sandstone, Manchester Marl, and Collyhurst Sandstone. Sedimentological analysis indicates that depositional environments varied from aeolian to fluvial and lacustrine, representing cyclic transgressive– regressive phases [21, 30]. Aeolian facies—characterized by well-sorted grains and minimal shale—are dominant in the northern and southern margins, while fluvial and channel- fill facies prevail in the central and eastern sectors. This spatial facies variability has direct implications for reservoir quality and connectivity, particularly regarding porosity and permeability heterogeneity.
Core data from Knutsford 1 further supports the interpretation of high-quality reservoir potential in the Collyhurst Sandstone. The presence of clean grain textures, moderate sorting, and low gamma-ray values indicates minimal clay content and favorable reservoir conditions [30], despite the lack of direct porosity measurements. However, the limited areal distribution of the Collyhurst Sandstone and its absence in shallower wells constrain its potential as a widespread reservoir target.
From a source rock perspective, the Westphalian Coal Measures represent a laterally extensive and regionally proven source, particularly in the adjacent East Irish Sea and Anglo-Dutch basins [37, 38]. Thermal maturity modelling suggests that within the Cheshire Basin, the Coal Measures reached early oil window conditions during the Jurassic and peaked in wet gas generation during the Late Cretaceous and Tertiary [39]. However, post-depositional uplift associated with the Hercynian Orogeny, followed by erosion, resulted in reduced TOC content and source rock degradation [40]. These geological processes significantly lowered the basin’s hydrocarbon generation capacity. Present TOC values (~50 mg/g TOC) indicate diminished generative potential, although the formation initially held promise for conventional dry gas production.
Structural compartmentalization further complicates the petroleum system. Multiphase faulting and tectonic inversion have segmented the basin, influenced both the migration and trapping of hydrocarbons [28, 41]. Seismic interpretation highlights abrupt facies transitions and variable reservoir geometries, suggesting that structural deformation has influenced both depositional architecture and post-depositional modification. Notably, the thinning of the Manchester Marl in the eastern and southern regions further undermines seal capacity in those areas [21, 33].
The Cheshire Basin exhibits several promising geological attributes required for hydrocarbon accumulation; however, the interplay of post-depositional tectonics, compromised seals, source rock degradation, and sedimentological heterogeneity collectively reduces its commercial viability. Future exploration should focus on detailed fault seal analysis [42], basin modelling to assess migration pathways, and geochemical correlation with adjacent productive basins to reevaluate its remaining potential.
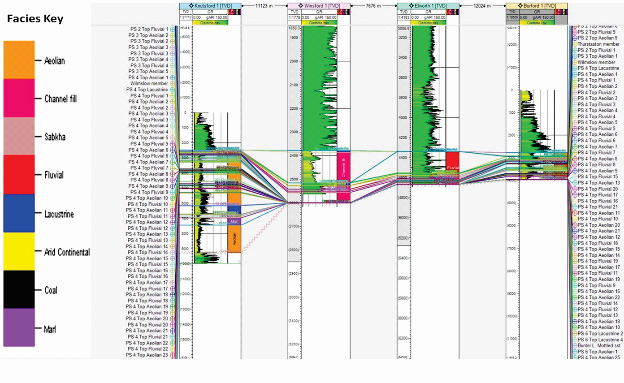
Facies Correlation
Facies correlation across the study wells provides critical insights into the spatial variability of depositional environments and the stratigraphic architecture of the Cheshire Basin reservoirs. The correlation framework established in this study is based on sequence stratigraphic principles, which enable the recognition of key stratigraphic surfaces, parasequence stacking patterns, and lateral facies transitions [43, 44].
The four wells examined—Knutsford 1, Winsford 1, Elworth 1, and Burford 1—are aligned in a north–south transect, allowing for systematic evaluation of facies continuity and reservoir geometry. Two principal reservoir intervals were identified and correlated, although their distribution is not uniform. Knutsford 1, the deepest well in the dataset [21], penetrates both the Sherwood Sandstone Group and the underlying Collyhurst Sandstone Formation, separated by the Manchester Marl Formation. In contrast, the other three wells encounter only the Sherwood Sandstone Group, with the Collyhurst Sandstone absent due to shallower total depths.
Correlation of the Sherwood Sandstone Group reveals significant vertical and lateral facies variability. Four main depositional facies—aeolian, channel-fill, lacustrine, and fluvial—were recognized and correlated across the wells [30, 34]. Knutsford 1 preserves the thickest and most complete Sherwood Sandstone succession, whereas the shallower wells display partial sections, lacking the deeper stratigraphic members. Horizon flattening at the top of the Sherwood Sandstone enhances recognition of parasequences and reveals at least eight discrete parasequences within the combined Sherwood and Collyhurst intervals (Figure 13) [43].
The Collyhurst Sandstone Formation, present only in Knutsford 1, is dominated by a single aeolian facies. Gamma- ray log responses indicate this interval is a clean, high-quality reservoir with minimal shale content, suggesting favorable petrophysical properties [21, 30]. This lithological purity, coupled with its position beneath the Manchester Marl seal, highlights the Collyhurst as a potential secondary reservoir target in deeper parts of the basin.
Overall, the facies correlation demonstrates that reservoir quality and continuity within the Cheshire Basin are strongly controlled by depositional environment, stratigraphic position, and structural depth. The greater completeness of the stratigraphic succession in Knutsford 1 compared to the other wells underscores the importance of depth penetration in fully characterizing the basin’s reservoir architecture. These correlations form the basis for subsequent reservoir modelling and resource evaluation.
Conclusion
This study re-evaluates the hydrocarbon potential of the Cheshire Basin by integrating seismic interpretation, facies analysis, and thermal maturity modeling. Although the basin contains all essential petroleum system elements—source, reservoir, and seal—commercial hydrocarbon accumulation has not been achieved. This is primarily due to post-depositional faulting and erosion, which have compromised seal integrity and reduced source rock effectiveness.
The Westphalian Coal Measures exhibit limited generative potential due to uplift-related TOC loss, while the Sherwood and Collyhurst Sandstones offer good local reservoir quality but poor regional continuity. Seismic evidence indicates widespread faulting that breaches key seals, increasing the likelihood of hydrocarbon leakage.
Despite these limitations, the basin retains potential for unconventional resources, particularly coalbed methane in structurally preserved zones. Future exploration should focus on fault seal analysis, geochemical assessment, and the evaluation of unconventional targets to reassess the basin’s residual prospectivity.
Author Contributions
Mr. Majid Hussain and Muhammad Paryal wrote the manuscript draft. Gulfam Hussain generated the idea, models, and maps. Muhammad Abdullah Khan checked the English writing and technical review, and Dr. Fathi Boukadi reviewed the paper and amended parts of the script write-up.
Conflicts of Interest
There are no conflicts of interest to declare.
Nomenclature
The following abbreviations are used in this manuscript
| UK | United Kingdom |
|---|---|
| NW | Northwest |
| SSE | South-Southeast |
| NNW | North-Northwest |
| N–S | North–South |
| E–W | East–West |
| UKOGL | UK Onshore Geophysical Library |
| BGS | British Geological Survey |
| TOC | Total Organic Carbon |
| HI | Hydrogen Index |
| %Ro | Vitrinite Reflectance (percent Ro) |
| ARCO | Atlantic Richfield Company (dataset/model) |
| LL | Lower Limit (thermal modeling trend) |
| Ma | Million years ago |
| ft | Feet |
| m | Meters |
| °C | De |
References
-
Hassan A (2013) Review of the global oil and gas industry: A concise journey from ancient time to modern world 3(2): 123-141.
-
Litvinenko VS (2020) The role of hydrocarbons in the global energy agenda: The focus on liquefied natural gas. Resources 9(5): 59.
-
Wu X, Sun Z, Yang T, Wang S, Zhang W (2020) Global progress in exploration and development of unconventional hydrocarbons and assessment of resource potential. Tongfang Knowledge Network 36(4): 1-17.
-
Seewald JS (2003) Organic–inorganic interactions in petroleum-producing sedimentary basins. Nature 426(6964): 327-333.
-
Guan D, Xu X, Li Z, Zheng L, Tan C, et al. (2017) Hydrocarbon generation in and expulsion from pore space limited source rocks. In: Hydrocarbon Generation. Springer, Singapore, pp. 69-131.
-
Selley RC, Sonnenberg SA (2023) Sedimentary basins and petroleum systems. In: Elements of Petroleum Geology. Elsevie, pp: 419-472.
-
Chadwick RA (1997) Fault analysis of the Cheshire Basin, NW England. Geological Society, London, Special Publications 124(1): 297-313.
-
Harvey MJ, Gray S (2013) Structural evolution and petroleum prospectivity of the Cheshire Basin, UK. Petroleum Geoscience 19: 179-190.
-
Harvey T, Gray J (2013) The Unconventional Hydrocarbon Resources of Britain’s Onshore Basins – Shale Gas. Department of Energy & Climate Change.
-
Brown CS (2023) Revisiting the deep geothermal potential of the Cheshire Basin, UK. Energies 16(3): 1410.
-
Warrington G (2014) Inside Mid-Triassic fluvial deposits: A legacy of mining sediment-hosted ore bodies in Cheshire, UK. Proceedings of the Geologists’ Association 125(5): 548-559.
-
Fraser A, Gawthorpe RL (1990) Tectono-stratigraphic development and hydrocarbon habitat of the Carboniferous in northern England. Geological Society, London, Special Publications 55(1): 49-86.
-
Floodpage J, Newman P, White J (2001) Hydrocarbon prospectivity in the Irish Sea area: Insights from recent exploration of the central Irish Sea, Peel and Solway basins. Geological Society, London, Special Publications 188(1): 107-134.
-
Mikkelsen PW, Floodpage JB (1997) The hydrocarbon potential of the Cheshire Basin. Geological Society, London, Special Publications 124(1): 161-183.
-
Mikkelsen S, Floodpage J (1997) Fault reactivation and seal integrity in the Cheshire Basin. Petroleum Geoscience 3: 239-250.
-
Tellam JH (2004) 19th century studies of the hydrogeology of the Permo-Triassic sandstones of the northern Cheshire Basin, England. Geological Society, London, Special Publications 225(1): 89-105.
-
Fainstein R, Tygel M (2018) Seismic Technology – Offshore Exploration and Production.
-
Duncan WI, Green PF, Duddy IR (1998) Source rock burial history and seal effectiveness: Key facets to understanding hydrocarbon exploration potential in the East and Central Irish Sea Basins. AAPG Bulletin 82(7): 1401–1415.
-
Duncan WI, Green PF, Bray RJ (1998) Cheshire Basin: Thermal history and hydrocarbon generation. In: Underhill JR (Ed.), The Nature and Origin of Compression in Passive Margins. Geological Society, London, Special Publications, pp: 61-74.
-
Gras R, Thusu B (1998) Seismic interpretation of fault- controlled deformation in the Cheshire Basin. Journal of Structural Geology 20(9-10): 1249-1263.
-
Brown CS, Cassidy NJ, Egan SS, Griffiths D (2021) Numerical modelling of deep coaxial borehole heat exchangers in the Cheshire Basin, UK. Computers & Geosciences 152: 104752.
-
Monaghan AA (2015) Palaeozoic petroleum systems of the central North Sea/Mid North Sea High. British Geological Survey Report.
-
Hussain M, Boukadi F, Hu Z, Adjei D (2025) Optimizing oil recovery: A sector model study of CO₂ water-alternating- gas and continuous injection technologies. Processes 13: 700.
-
Hussain M, Boukadi F (2025) CO₂-WAG injection and hysteresis effects: Insights for improved oil recovery and carbon sequestration applications. Petroleum & Petrochemical Engineering Journal 9(1): 1-9.
-
Zhang J, Guo B, Hussain M (2025) Use of pressure transient analysis method to assess fluid soaking in multi-fractured shale gas wells. Energies 18(3): 549.
-
Hirst P, Gawthorpe RL, Fraser AJ (2015) The evolution of rift basins: Insights from the Cheshire Basin, NW England. Basin Research 27(2): 174-194.
-
Armstrong P, Chapman T, Shurben D (1997) Hydrocarbon exploration in the Cheshire Basin: A geological perspective. Geological Society, London, Special Publications 123: 45-60.
-
Plant JA (1999) The Cheshire Basin: Basin evolution, fluid movement and mineralization. British Geological Survey Technical Report.
-
Toghill P (2000) The Geology of Britain: An Introduction. Crowood Press.
-
British Geological Survey (2015) British Geological Survey Well Data – Cheshire Basin Wells. British Geological Survey, UK.
-
UK Onshore Geophysical Library (2015) UK Onshore Geophysical Library – Well Records. London.
-
Gluyas J, Swarbrick R (2013) Petroleum Geoscience. Wiley-Blackwell.
-
Cowan G (1993) Faulting and hydrocarbon migration in the Cheshire Basin. Geological Society, London, Special Publications 67(1): 205-216.
-
Jackson CAL, Lewis MM (2016) Halokinesis and salt- related deformation. Geological Society, London, Special Publications 439: 187-212.
-
Allen JRL, Holloway D, Prosser DJ (1997) Facies models and stratigraphic frameworks in Triassic fluvial–aeolian successions. Sedimentary Geology 114: 35-54.
-
Barclay WJ (1997) The Sherwood Sandstone Group: Stratigraphy, sedimentology and diagenesis. Geological Society, London, Special Publications.
-
Besly BM (2002) Late Carboniferous red beds of the UK southern North Sea Basin reviewed. Proceedings of the Yorkshire Geological Society 54(3): 287-298.
-
Hitchen K, Johnson H (2000) Geology of the East Irish Sea Basin. British Geological Survey Research Report.
-
Cornford C (1998) Source rocks and hydrocarbons of the North Sea. Petroleum Geoscience 4(4): 315-331.
-
Riding JB (2014) Palaeozoic petroleum systems of the British Isles. Geological Society, London, Special Publications 390(1): 1-20.
-
Jackson CAL (2013) Structural controls on Triassic sedimentation in the UK. Basin Research 25(3): 310-335.
-
Yielding G (2002) Shale gouge ratio—Calibration by geohistory. Norwegian Petroleum Society Special Publications 11: 1-15.
-
Van Wagoner JC, Mitchum RM, Campion KM, Rahmanian VD (1990) Siliciclastic Sequence Stratigraphy in Well Logs, Cores, and Outcrops. AAPG Methods in Exploration Series No. 7.
-
Catuneanu O, Galloway WE, Kendall CGStC, Miall AD, Posamentier HW, et al. (2011) Sequence stratigraphy: Methodology and nomenclature. Newsletters on Stratigraphy 44(3): 173-245.
- Nigeria’s Vulnerability in the Face of Global Energy Policy
- A Simulation Study of Investigation of Optimum Oil Production Performance by Applying Various Gas Injection Methods in Oil Reservoir
- Influence of Microwax on the Rheological and Thermal Behaviour of a Wax Crude Oil
- Real-Time Monitoring and Performance Optimization of Steam Injection in Heavy Oil Reservoirs Using Fiber Optic Sensing and Integrated Predictive Simulation Models
- Rapid On-Site Determination of the Total Petroleum Hydrocarbon Content of Soils by Handheld Fourier Transform Near-Infrared Spectroscopy: Development of a Global, Site- and Scanner- Independent Calibration Model
- Isothermic, Kinetic and Thermodynamic Studies of Chromium (VI) Ions Adsorption on Composite Adsorbent of Chitosan- Eggshell Activated Carbon