An Empirical Correlation for Estimation of Formation Volume Factor of Gas Condensate Reservoirs at Separator Conditions
Gas condensate reservoirs represent half of hydrocarbon sources in different geological strata, so prediction of their physical properties are of great importance on the scale of petroleum industry. These hydrocarbons are not stable even at stock tank conditions as oil shrinkage continued due to vaporization of light components, consequently estimation of oil formation volume factor at separator conditions represents a critical property for these reservoirs. Experimental PVT analysis including flash liberation at separator conditions are carried out on gas condensate samples covering a great range of PVT properties. An empirical correlation is developed to estimate oil formation volume factor (Bo) at separator pressure and temperature using statistical regression analysis. Assessment and validation of the developed correlation were carried out by statistical and graphical error analysis in comparison to published correlations.
Introduction
Gas condensate reservoirs in which reservoir temperature lies between critical temperature (Tc) and cricondentherm temperature (Tct). When reservoir pressure declines below the dew point pressure, the gas begins to condense isothermally until reach to separator conditions. Typical phase diagram of gas condensate is shown in Figure 1. By declining of pressure isothermally starting from point 1, condensation begins at point 2, and reach maximum at point 3 then begin to decrease [1]. Point (G) represents separator condition that lies in two- phase region, in which well stream separated into separator gas and separator oil. These reservoirs characterized by high percentage of light components so vaporization process continued even at stock tank conditions, consequently estimation of oil formation volume factor (FVF) at separator conditions is a very critical physical property for gas condensate reservoirs in order to adjust separator performance. For gas condensate reservoirs, phase behavior changes not only in the formation but also in the wellbore during the whole production life. Recently, the phase behavior in the wellbore ignored in most of deliverability equations, and the volume factor was used to represent the relationship between flow rate in the bottom-hole and in the wellhead [2].
![Figure 1: By declining of pressure isothermally starting from point 1, condensation begins at point 2, and reach maximum at point 3 then begin to decrease [1]. Point (G) represents separator condition that lies in two- phase region, in which well stream separated into separator gas and separator oil. These reservoirs characterized by high percentage of light components so vaporization process continued even at stock tank conditions, consequently estimation of oil formation volume factor (FVF) at separator conditions is a very critical physical property for gas condensate reservoirs in order to adjust separator performance. For gas condensate reservoirs, phase behavior changes not only in the formation but also in the wellbore during the whole production life. Recently, the phase behavior in the wellbore ignored in most of deliverability equations, and the volume factor was used to represent the relationship between flow rate in the bottom-hole and in the wellhead [2].](/fulltextimages/1804/fig_1.png)
Fluid properties of gas condensate either detected in the lab or estimated from empirical relations [4]. Oil formation volume factor (FVF) at separator conditions measured through flashing of separator oil from separator condition to standard conditions. This factor is valuable for predicting the future of the reservoir, adjustment of separator performance and optimizing separator gas-oil ratio [5, 6]. Bo defined as the volume of separator oil at separator conditions (P,T) to volume of oil at standard conditions [7]. Flash liberation study carried out experimentally to determine volume of oil at separator conditions and standard conditions (14.7 psia & 60 °F). Generally, oil FVF expressed mathematically as Equation (1);
, ( ) ( ) o sc V B V = (Equation 1)
o P T o
where Bo= oil formation volume factor, bbl/STB, (Vo)P,T= volume of oil under separator pressure p andtemperature T, and (Vo)sc= volume of oil is at standard conditions [8]. Petroleum engineers may resort to empirical correlation in case of; non representative samples, PVT analyses are not available when needed [9], quality check lab analysis, estimating the potential reserves to be found in an exploration prospects, and evaluating the original oil in place and reserve for a newly discovered area [9, 10, 11]. Empirical correlations usually developed for regional geographical provinces with given chemical composition of reservoir fluid and data range [7, 11]. Thus, generalized accurate PVT relations are rare. Most empirical PVT relations were developed by multiple linear or non-linear regression techniques, others used graphical techniques [11, 12]. To the best of our knowledge based on screening of the published correlation concerning with prediction of oil FVF at separator conditions for gas condensate reservoirs, we found that they are too few. On the other hand,several empirical correlations for prediction of oil FVF for black and volatile oils have been proposed and demonstrated in the literature, based on linear regression, nonlinear multiple regression, and graphical techniques [5]. These correlations based mainly on the hypothesis that the oil FVF is a strong function of the solution gas-oil ratio (Rs), the reservoir temperature(T), the gas specific gravity (γg), and the oil specific gravity (γo) [4]. These correlations are reported in literature Abdul-Majeed, Salman NH [13], Al-Marhoun [14], Al-Marhoun [15], Almehaideb R [16], Bolondarzadeh, et al. [17], Dindoruk and Christman PG [18], Dokla and Osman [19], El-Banbi, et al. [20], Frashad, et al. [21], Glaso [22], Hemmati and Kharrat [9], Kartoatmodjo and Schmidt [23], Macary and El-Batanoney [24], Mehran, et al. [25], Omar and Todd [26], Petrosky and Farshad [27], Standing [28], Sulaimon, et al. [29], Vazquez and Beggs [30]. Few authors modify correlating parameters of black oil to predict gas condensate PVT properties. El-Banbi [20] used modified black oil approach (MBO) for modelling gas condensate properties [20]. The authors modify correlating parameter of standing correlation (1947) to calculate Bo
of gas condensate [20]. Ba-Jaalah [31] modify Al-Marhoun and Petrosky correlation parameters by regression analysis to calculate Bo of gas condensate reservoirs [31]. Detailed description of these correlations including number and origin of data set, correlating parameters ranges, relative errors percentage and mathematical expressions found in literature Edreder [8], Fattah and Lashin [4], Karimnezhad [32], Mahdiani and Kooti [6], Moradi [33], Salehinia [34]. By applying the published black oil correlations for prediction of gas condensate oil FVF at separator conditions, a great relative error and high standard deviation is reported. This led the authors in this study to build up a novel relation predicting oil FVF for gas condensate reservoirs. Moreover, accuracy of developed correlations determined through statistical error analysis ($E_r$, $E_a$, $E_{\max}$, $E_{\min}$, $S$, $E_{\rm rms}$, and $r$) and correlation validated by other data set not used in correlation built up.
**Experimental PVT Analysis**
Complete PVT analysis of about (63) gas condensate samples covering different production regions in Egypt was studied in our PVT-lab as follow: A) Validity check of samples was carried out at sampling pressure to assure that the sample is representative of reservoir fluid [35]. B) Flash liberation test summarized as follow [3].
- Separator oil sample was shacked very well and adjusted at separator pressure and temperature.
- A definite volume of separator oil sample ($V_o$) sep flashed from separator condition to standard condition.
- Volume of dissolved gas reported and compositional analysis of separator, dissolved gases and stock tank oil (STO) determined by gas chromatography.
- Measure density and weight of STO, so volume of oil at standard conditions ($V_o$) sc can be determined.
- Physical parameters like Bo, dissolved gas-oil ratio (GOR), gas gravity and oil gravity can be determined from the following relations (Equations 2-6):
$$B_o, bbl / STB = \frac{(V_o)_{sep}}{(V_o)_{sc}}$$ (Equation 2)
$$GOR)_{diss}, scf / STB = \frac{(V_g)_{diss}}{(V_g)_{sc}}$$ (Equation 3)
$$\gamma_{diss} = \frac{\sum (Y_i M_i)_{diss}}{M_a}$$ (Equation 4)
$$\gamma_{sep} = \frac{\sum (Y_i M_i)_{sep}}{M_a}$$ (Equation 5)
$$\gamma_o = \frac{\rho_o}{\rho_w}$$ (Equation 6)
**Correlation Built Up and Computation Method**
Generally, regression analysis used to build up empirical correlations [4, 36]. Regression analysis correlate a set of independent variables to predict one dependent variable. If only one independent variable is involved then it is called simple regression analysis while multiple regression analysis involve more than one independent variable [11]. A general multiple regression model, which relates a dependent variable $y$ to $k$ predictor independent variables, $x_1, x_2, \ldots, x_k$, is given by Equation 7:
$$y = \alpha + \beta_1 x_1 + \beta_2 x_2 + \cdots + \beta_k x_k$$ (Equation 7)
Where $\alpha$ and $\beta$'s are coefficients to be determined by the regression analysis and expressed in matrix form as follow [11].
$$\begin{bmatrix} 1 & x_{11} & x_{12} & \ldots & x_{1n} \\ 1 & x_{21} & x_{22} & \ldots & x_{2n} \\ 1 & x_{31} & x_{32} & \ldots & x_{3n} \\ 1 & \ldots & \ldots & \ldots & \ldots \\ 1 & \ldots & \ldots & \ldots & \ldots \\ 1 & \ldots & \ldots & \ldots & \ldots \\ 1 & x_{ik1} & x_{ik2} & \ldots & x_{ikn} \end{bmatrix} \begin{bmatrix} \alpha \\ \beta_1 \\ \beta_2 \\ \ldots \\ \beta_n \end{bmatrix} = \begin{bmatrix} y_1 \\ y_2 \\ y_3 \\ \ldots \\ y_{ik} \end{bmatrix}$$ (Equation 8)
Least-squares regression technique is applied upon the nonlinear weighted values to minimize the sum-of squared residuals between measured and simulated quantities. The data fitted by a method of successive approximations [4, 37]. The linearity or nonlinearity of the data pattern checked using scatter gram plotting. In this study, real experimental PVT data of (63) gas condensate samples covering most of gas condensate reservoirs in Egypt, have been analyzed and used. Physical properties and data range reported in Table 1. Multiple least-square regression analysis used to develop the proposed correlation as a function of separator pressure & temperature, mole fraction of $(C_1){sep}$, dissolved gas-oil ratio, mole fraction of $(C_1){diss}$, dissolved gas gravity, separator gas gravity and oil specific gravity. $(P_{sep}, T_{sep},$
(YC1)sep, (GOR)diss, (YC1)diss , (γg)diss, (γg)sep and γo ) respectively.
Bo= f [Psep, Tsep, (YC1)sep, (GOR)diss, (YC1)diss ,(γg)diss, (γg)sep and γo ] (Equation9) B Exp x x P x T x Y x GOR x Y
1 1 + ln ln ln ln ln [
sep sep o C C sep diss diss
+ + + g g γ γ x x x γ
l ( ) ( n l ] n l n )
6 7 8 diss sep o
$$ \begin{array}{c c c c c c} & & & \text {W h e e r}, \\ x _ {0} = 0. 1 4 2 & x _ {1} = - 0. 1 8 3 & x _ {2} = 0. 0 6 6 & x _ {3} = 0. 0 1 2 & x _ {4} = 0. 2 1 6 \\ x _ {5} = 0. 2 5 4 & x _ {6} = 0. 0 2 & x _ {7} = 0. 2 1 9 & x _ {8} = 0. 0 8 5 & \\ \end{array} $$ (Equation10)
| $Parameters | Maximum | Minimum | Average |
| B_{0, bbl/STB | 1.8416 | 1.0061 | 1.1775 |
| (Reservoir pressure, P_{res) psig | 6500.0000 | 896.0000 | 2794.1984 |
| (Reservoir temperature, T_{res) °F | 275.0000 | 113.0000 | 185.8540 |
| Separator gas gravity($\gamma_{g}$)sep | 0.8140 | 0.5748 | 0.6620 |
| Oil gravity ($\gamma_{o}$) | 0.8501 | 0.7192 | 0.7688 |
| (Separator pressure, P_{sep) psig | 1246.0000 | 34.0000 | 563.4492 |
| (Separator temperature, T_{sep) °F | 127.0000 | 15.7000 | 81.3429 |
| °API gravity | 65.2518 | 34.9448 | 52.7389 |
| (Separator gas oil ratio, (GOR)_{sepscf/STB) | 916527.5459 | 5300 | 74132.83199 |
| mole fraction of ($C_{1}$)_{sep}, ($Y_{C1}$)_{sep}$ | 0.971857628 | 0.6873 | 0.877386792 |
| (Dissolved gas oil ratio, (GOR)_{sepscf/STB) | 1178.5 | 5.6 | 305.1291508 |
| mole fraction of ($C_{1}$)_{diss}, ($Y_{C1}$)_{diss}$ | 0.823632791 | 0.23371 | 0.546075448 |
| Dissolved gas gravity($\gamma_{g}$)diss | 1.422 | 0.7253 | 1.049352018 |
Table 1: Range of data for gas condensate samples Table 1: Range of data for gas condensate samples
Results and Discussions
The accuracy and reliability of the developed correlation checked by using both statistical and graphical error means [11].
Statistical Error Analysis
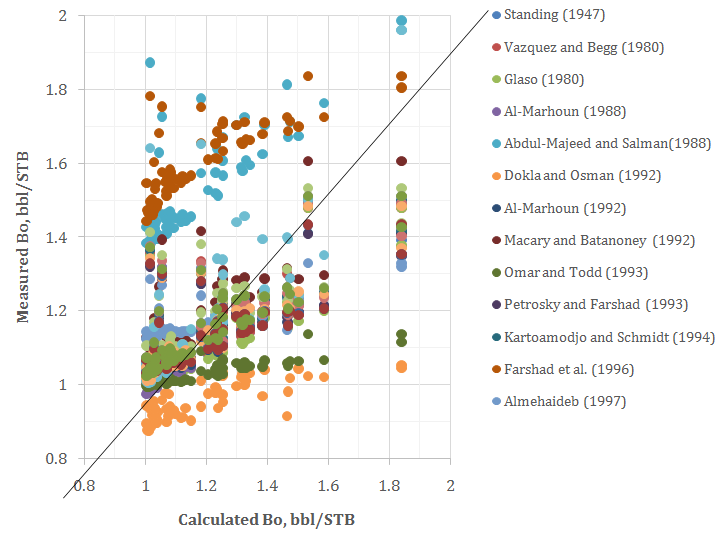
Accuracy and validity of the developed model was evaluated using the following statistical means; Average percent relative error (Er), Average absolute percent relative error (Ea), Maximum absolute percent relative error (Emax), Minimum absolute percent relative error (Emin), Root mean square error (Erms) and Standard deviation (S) [5, 27, 29, 38, 39, 40]. Mathematical expression of each parameter reported in literature [7]. Statistical errors of the published correlations and developed one in this study are reported in Table 2. It is observed that the developed correlation has lower relative errors, lower root mean square error and standard deviation as compared to the published one, so it has more reliability to measured values. As a result, it is expected that this correlation is more accurate than any of the published ones relevant to Egyptian oil crudes.
| Correlations | E r | E a | E max | E min | E rms | S | R2 | r | ||||||||||||||||||
|---|---|---|---|---|---|---|---|---|---|---|---|---|---|---|---|---|---|---|---|---|---|---|---|---|---|---|
| Standing (1947) | 4.645 | 7.659 | 34.062 | 0.056 | 0.144 | 0.108 | 0.335 | 0.579 | ||||||||||||||||||
| Vazquez and Begg (1980) | 3.868 | 7.220 | 33.294 | 0.088 | 0.140 | 0.104 | 0.376 | 0.613 | ||||||||||||||||||
| Glaso (1980) | 5.301 | 8.063 | 32.673 | 0.150 | 0.150 | 0.112 | 0.276 | 0.525 | ||||||||||||||||||
| Al-Marhoun (1988) | 4.655 | 7.622 | 34.508 | 0.069 | 0.136 | 0.104 | 0.406 | 0.637 | ||||||||||||||||||
| Abdul-Majeed and Salman(1988) | -32.234 | 32.234 | 84.152 | 7.823 | 0.381 | 0.346 | 0.125 | 0.354 | ||||||||||||||||||
| Dokla and Osman (1992) | 17.268 | 17.328 | 43.292 | 0.250 | 0.265 | 0.196 | 0.205 | 0.453 |
| Al-Marhoun (1992) | 4.504 | 7.490 | 30.177 | 0.069 | 0.145 | 0.106 | 0.326 | 0.571 |
|---|---|---|---|---|---|---|---|---|
| Macary and Batanoney (1992) | -2.037 | 7.519 | 43.359 | 0.466 | 0.126 | 0.106 | 0.488 | 0.699 |
| Omar and Todd (1993) | 10.892 | 11.336 | 39.494 | 0.426 | 0.213 | 0.150 | 0.221 | 0.470 |
| Petrosky and Farshad (1993) | 3.795 | 7.265 | 29.758 | 0.028 | 0.142 | 0.104 | 0.351 | 0.592 |
| Kartoamodjo and Schmidt (1994) | 3.283 | 6.742 | 34.224 | 0.009 | 0.131 | 0.099 | 0.446 | 0.668 |
| Farshad et al. (1996) | -37.876 | 37.941 | 75.188 | 2.038 | 0.441 | 0.405 | 0.104 | 0.322 |
| Almehaideb (1997) | -1.202 | 9.399 | 28.349 | 0.872 | 0.146 | 0.112 | 0.318 | 0.564 |
| El-Banbi (2006) | 3.236 | 6.931 | 35.256 | 0.001 | 0.136 | 0.103 | 0.409 | 0.640 |
| Sulaimon (2014) | 0.279 | 6.725 | 39.004 | 0.167 | 0.127 | 0.100 | 0.484 | 0.696 |
| Dindoruk&Christman (2001) | -0.591 | 6.440 | 61.358 | 0.020 | 0.134 | 0.117 | 0.427 | 0.653 |
| Bolondarzadeh et al. (2006) | 3.344 | 7.028 | 32.112 | 0.041 | 0.134 | 0.100 | 0.422 | 0.650 |
| Merhen et al. (2006) | 3.764 | 7.595 | 30.429 | 0.088 | 0.145 | 0.106 | 0.330 | 0.574 |
| Hemmati&Kharrat (2007) | 3.918 | 7.575 | 30.592 | 0.090 | 0.145 | 0.106 | 0.326 | 0.571 |
| Khaled (2015) Modified Al-Marhoun | 6.290 | 29.861 | 323.187 | 2.985 | 0.561 | 0.511 | 0.290 | 0.539 |
| Khaled (2015) Modified Petrosky | -16.579 | 48.056 | 307.822 | 0.217 | 0.799 | 0.702 | 0.220 | 0.469 |
| This study | -0.842 | 5.477 | 25.727 | 0.116 | 0.094 | 0.071 | 0.717 | 0.847 |
Table 3: Statistical accuracy of the published and developed correlations Table 2: Statistical accuracy of the published and deve
Validation of Correlation
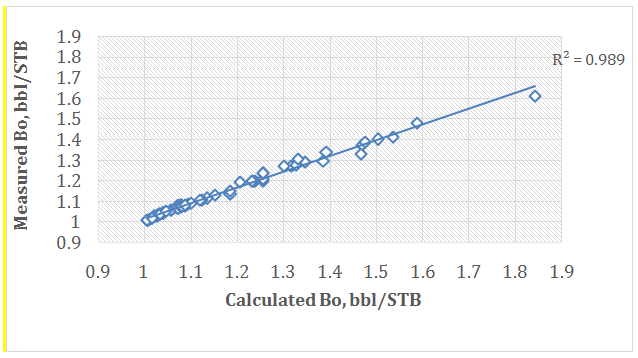
Validity and applicability of the newlydeveloped empirical correlations carried out through graphical and statistical error analysis using (50) data sets that were not used in the correlation development. Figure 4 shows cross plot of measured data and predicted one. We can observe that coefficient of determination (R2= 0.9898) which indicate high accuracy of this correlation related to validation samples. At this point, it should be mentioned the proposed correlationsare only applicable to Egyptian oils and their applicability to otherregions should be checked [11]. In addition, the statistical analyses show low relative error percentage and high coefficient of determination.
Er=1.7942 Ea=2.1646 Emax=12.4180 Emin=0.0894 Erms=0.0509 S=0.0337 R2=0.9169
Conclusion
A novel correlation based on (63) data set covering different Egyptian oil production regions was developed to estimate oil formation volume factor at separator conditions for gas condensate reservoirs, where the following results can be concluded; A. The new relation introduce new correlating properties greatly affected by separator conditions like separator and dissolved gas gravity, mole fraction of methane in separator and dissolved gases, so it is expected to improve the developed correlation accuracy. B. Experimental PVT analysis carried out to determine all parameters in the presented model. C. Comparative evaluation of the developed correlation and the well-known published correlations from the literature carried out using statistical and graphical error analyses. D. The obtained results indicate that, the developed correlation are more relevant and accurate to the Egyptian crude oils than the published ones as it shows high correlation coefficient(r= 0.914) and lower relative errors (Ea= 5.477 , Er= -0.842). E. Model validation carried out on (60) oil samples through graphical and statistical error analysis where coefficient of determination reach to (R2= 0.9898) which indicate high reliability of the proposed correlation.
Nomenclature
| Oil FVF | Oil formation volume factor |
|---|---|
| PVT | Pressure-Volume- Temperature |
| Bob, bbl/STB | Bubble point oil formation volume factor |
| Rs, scf/STB | Solution gas-oil ratio |
| T, °F | Reservoir temperature |
| γg | Gas specific gravity |
| γo | Oil specific gravity |
| Er | Average percent relative error |
| Ea | Average absolute percent relative error |
| Emax | Maximum absolute percent relative error |
| Emin | Minimum absolute percent relative error |
| S | Standard deviation |
| Erms | Root mean square error |
| r | Correlation coefficient |
| GOR, scf/STB | Gas -oil ratio |
| API | American Petroleum Institute |
| STO | Stock tank oil |
| Pres, psig | Reservoir pressure |
| Tres, °F | Reservoir temperature |
| ρob, g/cc | Density of oil at bubble point |
| Pb, psig | Bubble point pressure |
| Psep, psig | Separator pressure |
| Tsep, °F | Separator temperature |
| R2 | Coefficient of determination |
References
-
Ahmed T (2010) Reservoir engineering Handbook. 4th (Edn.), Gulf Professional Publishing. Houston, USA.
-
Shi J, Huang L, Li X, Sepehrnoori K (2015) Production forecasting of gas condensate well considering fluid phase behavior in the reservoir and wellbore. Journal of Natural Gas Science and Engineering 24: 279-290.
-
Pope G, Wu W, Narayanaswamy G, Delshad M, Sharma MM, et al. (2000) Modeling relative permeability effects in gas-condensate reservoirs with a new trapping model. Society of Petroleum Engineers, SPE Reservoir Evaluation & Engineering 3(2): 171-178.
-
Fattah K, Lashin A (2016) Improved oil formation volume factor (Bo) correlation for volatile oil reservoirs: An integrated non-linear regression and genetic programming approach. Journal of King Saud University-Engineering Sciences. Ahmed TH (1989) Hydrocarbon phase behavior. Vol 7, Gulf Publishing Company Houston, USA.
-
Mahdiani MR, Kooti G (2016) The most accurate heuristic-based algorithms for estimating the oil formation volume factor. Petroleum 2(1): 40-48.
-
Fath AH (2017) Application of radial basis function neural networks in bubble point oil formation volume factor prediction for petroleum systems. Fluid Phase Equilibria 437: 14-22.
-
Edreder EA, Rahuma KM, Kalaflla HA (2016) Oil Formation Volume Factor Empirical Correlations for some Libyan Crude Oils. The International Journal Of Engineering And Information Technology 3(1): 13-17.
-
Hemmati M, Kharrat R (2007) Evaluation of empirically derived PVT properties for Middle East crude oils. Scientia Iranica 14(4): 358-368.
-
El-Hoshoudy A, Desouky S, Betiha M, Abdelraouf S, Elaily M (2014) Mathematical correlation predicting stock tank oil density for Egyptian crude oils at standard conditions. International Journal of Oil, Gas and Coal Engineering 2(4): 55-58.
-
El-hoshoudy A, Farag AB, Ali OIM, EL-Batanoney MH, Desouky SEM, et al. (2013) New correlations for prediction of viscosity and density of Egyptian oil reservoirs. Fuel 112: 277-282.
-
Elsharkawy AM, Alikhan AA (1997) Correlations for predicting solution gas/oil ratio, oil formation volume factor, and undersaturated oil compressibility. Journal of Petroleum Science and Engineering 17(3- 4): 291-302.
-
Abdul-Majeed GH, Salman NH (1988) An empirical correlation for oil FVF prediction. Journal of Canadian Petroleum Technology 27(6).
-
Al-Marhoun MA (1988) PVT correlations for Middle East crude oils. Journal of Petroleum Technology 40(5): 650-666.
-
Al-Marhoun MA (1992) New Correlation for formation Volume Factor of oil and gas Mixtures. Journal of Canadian Petroleum Technology 31(3): 22- 26.
-
Almehaideb R (1997) Improved PVT correlations for UAE crude oils. Society of Petroleum Engineers, Middle east oil show and conference pp: 12.
-
Bolondarzadeh A, Hashemi S, Solgani B (2005) The new PVT generated correlations of Iranian oil properties, 4th National Petroleum Engineering Student conference, Ahvaz.
-
Dindoruk B, Christman PG (2001) PVT properties and viscosity correlations for Gulf of Mexico oils. Society of Petroleum Engineers, SPE annual technical conference and exhibition, Louisiana.
-
Dokla M, Osman M (1992) Correlation of PVT Properties for UAE Crudes (includes associated papers 26135 and 26316). Society of Petroleum Engineers, SPE Formation Evaluation 7(1): 41-46.
-
El-Banbi AH, Fattah KA, Sayyouh H (2006) New modified black-oil PVT correlations for Gas condensate and volatile oil fluids. Society of Petroleum Engineers, SPE Annual Technical Conference and Exhibition, USA.
-
Frashad F, LeBlanc J, Garber J, Osorio J (1996) Empirical PVT correlations for Colombian crude oils. Society of Petroleum Engineers, SPE Latin America/Caribbean petroleum engineering conference, Trinidad, pp: 10.
-
Glaso O (1980) Generalized pressure-volume- temperature correlations. Journal of Petroleum Technology 32(5): 785-795.
-
Kartoatmodjo T, Schmidt Z (1994) Large data bank improves crude physical property correlations. Oil and Gas Journal 92(27).
-
Macary S, El-Batanoney M (1993) Derivation of PVT correlations for the Gulf of Suez crude oils. Journal of The Japan Petroleum Institute 36(6): 472-478.
-
Mehran F, Movagharnejad K, Didanloo A (2006) New correlation for estimation of formation volume factor and bubblepoint pressure for Iranian oil Fields. 1st Iranian Pet Eng Conference, pp: 17.
-
Omar M, Todd A (1993) Development of new modified black oil correlations for Malaysian crudes. Society of Petroleum Engineers, SPE Asia Pacific oil and gas conference, Singapore.
-
Petrosky G, Farshad F (1993) Pressure-volume- temperature correlations for Gulf of Mexico crude oils. Society of Petroleum Engineers, SPE annual technical conference and exhibition, Texas.
-
Standing M (1947) A pressure-volume-temperature correlation for mixtures of California oils and gases. American Petroleum Institute, Drilling and Production Practice, New York.
-
Sulaimon A, Ramli N, Adeyemi B, Saaid I (2014) New Correlation for Oil Formation Volume Factor. Society of Petroleum Engineers, SPE Nigeria Annual International Conference and Exhibition, Nigeria.
-
Vazquez M, Beggs H (1980) Correlations for Fluid Physical Property Prediction. Journal of Petroleum Technology 32(6): 4.
-
Ba-Jaalah KS (2015) New Correlations for Gas Oil Ratio and Oil Formation Volume Factor for Gas Condensate Reservoirs. International Journal of Innovation and Applied Studies 13(4): 894-900.
-
Karimnezhad M, Heidarian M, Kamari M, Jalalifar H (2014) A new empirical correlation for estimating bubble point oil formation volume factor. Journal of Natural Gas Science and Engineering 18: 329-335.
-
Moradi B, Malekzadeh E, Mohammad A, Awang M, Moradie P (2013) New Oil Formation Volume Factor Empirical Correlation for Middle East Crude Oils. International Journal of Petroleum and Geoscience Engineering (IJPGE), pp: 12-23.
-
Salehinia S, Salehinia Y, Alimadadi F, Sadati SH (2016) Forecasting density, oil formation volume factor and bubble point pressure of crude oil systems based on nonlinear system identification approach. Journal of Petroleum Science and Engineering 147: 47-55.
-
El Aily M, Khalil M, Desouky S, Batanoni M, Mahmoud MRM (2013) Experimental studies on constant mass– volume depletion of gas-condensate systems. Egyptian Journal of Petroleum 22(1): 129-136.
-
Khan MN, Bilal HM, Shoaib M, Manzoor AA, Shaukat W, et al. (2012) Fluid Characterization of a Retrograde Gas Condensate Reservoir for the Simulation Study. Society of Petroleum Engineers, SPE/PAPG Annual Technical Conference, Pakistan.
-
Dalgaard P (2008) Introductory statistics with R. 2nd (Edn.), Springer-Verlag New York, pp: 364.
-
McCain WD (1990) The properties of petroleum fluids. 2nd (Edn.), PennWell Books, Oklahoma.
-
Lohrenz J, Bray BG, Clark CR (1964) Calculating viscosities of reservoir fluids from their compositions. Journal of Petroleum Technology 16(10): 1,171- 1,176.
-
Katz DL (1942) Prediction of the shrinkage of crude oils. American Petroleum Institute, Drilling and Production Practice, New York.
- Nigeria’s Vulnerability in the Face of Global Energy Policy
- A Simulation Study of Investigation of Optimum Oil Production Performance by Applying Various Gas Injection Methods in Oil Reservoir
- Characterization of Permo-Triassic Reservoirs through Thermal Maturity Assessment of Westphalian Source Rocks in the Cheshire Basin
- Influence of Microwax on the Rheological and Thermal Behaviour of a Wax Crude Oil
- Real-Time Monitoring and Performance Optimization of Steam Injection in Heavy Oil Reservoirs Using Fiber Optic Sensing and Integrated Predictive Simulation Models
- Rapid On-Site Determination of the Total Petroleum Hydrocarbon Content of Soils by Handheld Fourier Transform Near-Infrared Spectroscopy: Development of a Global, Site- and Scanner- Independent Calibration Model