Accidental Release of So2 from a Petroleum Refinery due to Power Outage
In normal condition, the petroleum refinery plant in Sriracha, Chonburi, Thailand emits 38.05 g/s of SO2 into the environment. However, if there is a power outage, the same refinery plant emits 16911 g/s of SO2 into the atmosphere . The ALOHA model was used to simulate the SO2 dispersions in summer, rainy season, and winter .The results show that the SO2 concentrations greater than 0.075 ppm (allowable ambient SO2 concentration) can spread longer than 10 km . The comparison between the simulated and measured results shows that the error of ALOHA model prediction is 17.63%.
Introduction
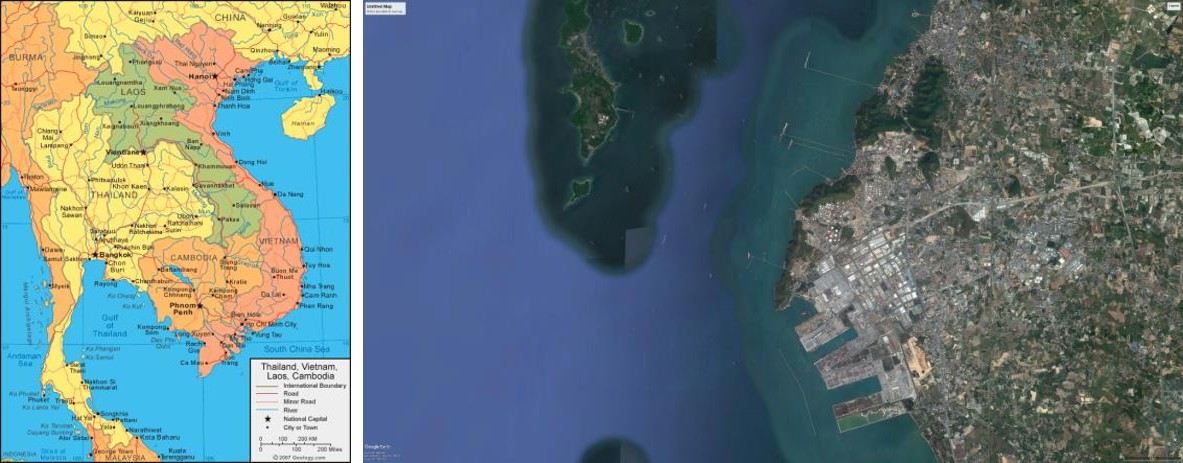
Petroleum refinery processes can emits SO2 into the atmosphere causing air pollution. Sources of SO2 from refinery processes include: combustion of fuels containing sulfur, flares, catalytic cracking unit regenerators, treating units, and decoking operations [1]. In case of power outage the refinery processes will stop running immediately. Large amount of SO2 will be released into the environment. Power outage can occur anytime without warning. Earthquake, landslide, storm, or any human induced accidents can induce the power outage. Once it occurs, a catastrophe is inevitable. For example, on 14 October 2016, the Suncor refinery plant in Colorado, USA accidental released a total of 34.29 tonnes of SO2 into the environment due to the power outage [2]. Nearby communities were evacuated for safety. Therefore, knowing in advance the areas affected by the SO2 released from petroleum refinery in case of power outage is very important. It is, therefore, the purpose of this study to simulate the dispersion of SO2 concentrations from the petroleum refinery due to power outage. The petroleum refinery plant in this study is located at Sriracha, Chonburi province, Thailand as shown in the following Figure 1. Coordinates of the study area are 47P 704770 E, 1448624 N or 100.888728ºE, 13.096967ºN or 100º 53' 19" E, 13º 5' 49" N. Land uses in the study area are mainly urban and water body. The elevation of the area is about 0.5 m above the mean sea level (MSL).
The model ALOHA was used in this study to simulate the SO2 dispersions. The ALOHA is a simple and widely used air quality model. It is also approved by the United States Environmental Protection Agency (EPA) as a good and simple model to predict the dispersion of gases. Several studies have shown that the ALOHA model can successfully be used to predict pollutant dispersions in the environment. For example, Salam demonstrated a success use of the ALOHA model to predict SO2 dispersions from a phosphate fertilizer facility located at El-Menya Governorate, Egypt [3]. Bariha et al. [4] used ALOHA and PHAST software to simulate the accidental scenario caused by an explosion of a LPG truck in Kannur, Kerala, India [4]. Results of the fireball, jet flame radiation and explosion overpressure agree well with the actual loss reported from the site. Hui and Guoning [5] used the ALOHA model to simulate the accidental leaking of natural gas from a pipeline in Natural Gas Power Generation Co., Ltd [5]. The results provide bases and decisions for the pipelines plan, construction of natural gas power plant and the spatial location of the town. In this study, the simulated results by using the ALOHA show that if there is a power outage, the petroleum refinery processes will stop running suddenly and release SO2 concentrations into the atmosphere, very much greater than the allowable ambient concentration. According to the National Ambient Air Quality Standards, (NAAQS), the ambient SO2 concentration must not exceed 0.075 ppm for 1 hour [6]. The results show that if there is a power outage the released SO2 greater than the allowable ambient can spread more than 10 km from the source.
Methodology
The basic equation used in the ALOHA model is the Gaussian equation as follow [7:]
( ) − − − = 2
2
2 H z y u Q c σ σ σ σ π
2 2 exp 2 z y z y
2 where c is the simulated SO2 concentration (g/m3); Q is the SO2 emission rate (g/s); u is the wind speed (m/s); H is the height of the SO2 plume above the stack base. The x, y, z are the coordinates of the receptor. The x-axis follows the wind direction, y-axis and z-axis are in the horizontal and vertical planes respectively and both are perpendicular to the wind direction (x-axis). The origin of the x, y, z axes is at the stack base. The σy and σz are dispersion functions in y and z directions respectively where more detail can be found in [8]. The Suncor incidence on 14 October 2016 released 34.29 tonnes of SO2 into the environment due to the power outage [2]. If it took one hour to fix the problem and stop the release, then the SO2 emission rate was 34.29×1000000/3600 = 9525 g/s. The Suncor refinery had the capacity of 98,000 barrels per day of crude oil [8]. For normal operation, the petroleum refinery plant in this study has the capacity of 174,000 barrels per day and emits 38.05 g/s of SO2 [9]. The stack height is 100 m above the ground surface. If there is a power outage similar to the Suncor case, the petroleum refinery in this study will release about 9525/98000×174000 = 16911 g/s of SO2 into the atmosphere.
The simulations were done for all seasons. There are 3 seasons in Thailand: summer (15 February to 15 May), rainy season (15 May to 15 October), and winter (15 October to 15 February) (Figure 2) [10]. The meteorological data used in the simulation consist of wind speed, wind direction cloud cover, ambient temperature and relative humidity as shown in the following Table 1.
| Season | Wind speed(m/s) | Blowing | Cloud cover | Temp. (ºC) | Relative humidity (%) | ||||||||||||
|---|---|---|---|---|---|---|---|---|---|---|---|---|---|---|---|---|---|
| from | |||||||||||||||||
| Summer | 1.55 | SW | 5 | 29.11 | 76 | ||||||||||||
| Rain | 1.73 | WSW | 7 | 28.79 | 78 | ||||||||||||
| Winter | 1.75 | NE | 4 | 27.23 | 74 |
Table 1: Meteorological data of the study area [10].
![Figure 2: Wind rose for summer, rainy season, and winter [10].](/fulltextimages/1826/fig_2.jpeg)
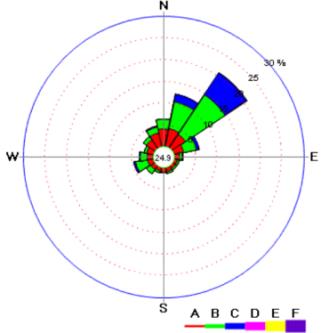
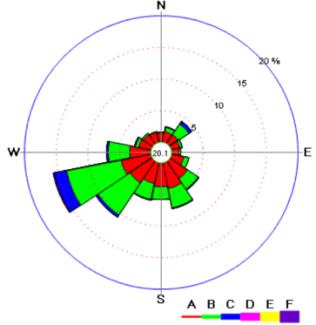
$$ \begin{array}{l} A \quad 0. 0 0 \sim < 5. 4 0 k m / h \\ B \quad 5. 4 0 \sim < 8. 8 6 k m / h \\ C \quad 8. 8 6 \sim < 1 6. 0 9 k m / h \\ D \quad 1 6. 0 9 \sim < 2 4. 9 5 k m / h \\ E \quad 2 4. 9 5 \sim < 3 4. 6 0 k m / h \\ F \quad 3 4. 6 0 \sim k m / h \\ \end{array} $$ Summer Rainy season Winter Figure 2: Wind rose for summer, rainy season, and winter [10].
Results
After using the ALOHA model, the simulated SO2 dispersions in summer, rainy season, and winter due to
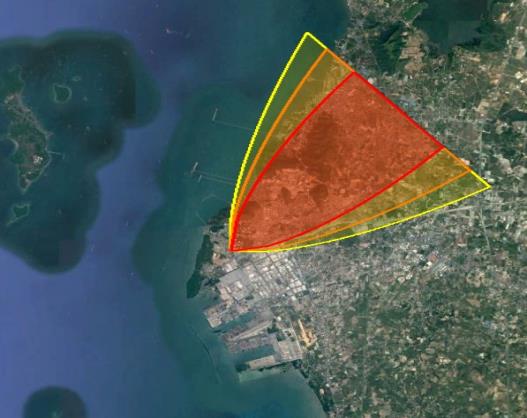
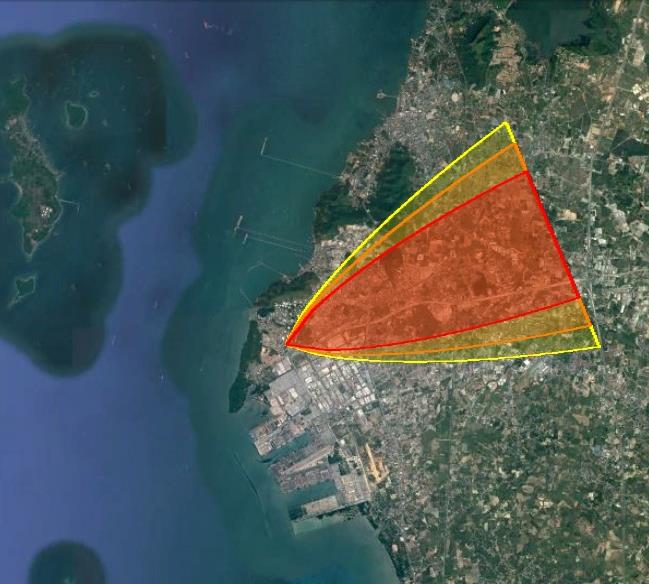
$$ \mathrm {点 点 点 点 点 点 点 点 点 点 点 点 点 点 点 点 点 点 点 点 点 点 点 点 点 点 点 点 点 点 点 点 点 点 点 点 点 点 点 点 点 点 点 点 点 点 点 点 点 点 点 点 点 点 点 点 点 点 点 点 点 点 点 点 点 点 点 点 点 点 点 点 点 点 点 点 点 点 点 点 点 点 点 点 点 点 点 点 点 点 点 点 点 点 点 点 点 点 点 点 点 点 点 点 点 点 点 点 点 点 点 点 点 点 点 点 点 点 点 点 点 点 点 点 点 点 点 点 点 点 点 点 点 点 点 点 点 点 点 点 点 点 点 点 点 点 点 点 点 点 点 点 点 点 点 点 点 点 点 点 点 点 点 点 点 点 点 点 点 点 点 点 点 点 点 点 点 点 点 点 点 点 点 点 点 点 点 点 点 点 点 点 点 点 点 点 点 点 点 点 点 点 点 点 点 点 点 点 点 点 点 点 点 点 点 点 点 点 点 点 点 点 点 点 点 点 点 点 点 点 点 点 点 点 点 点 点 点 点 点 点 点 点 点 点 点 点 点 点 点 点 点 点 点 点 点 点 点 点 点 点 点 点 点 点 点 点 点 点 点 点 点 点 点 点 点 点 点 点 点 点 点 点 点 点 点 点 点 点 点 点 点 点 点 点 点 点 点 点 点 点 点 点 点 点 点 点 点 点 点 点 点 点 点 点 点 点 点 点 点 点 点 点 点 点 点 点 点 点 点 点 点 点 点 点 点 点 点 点 点 点 点 点 点 点 点 点 点 点 点 点 点 点 点 点 点 点 点 点 点 点 点 点 点 点 点 点 点 点 点 点 点 点 点 点 点 点 点 点 点 点 点 点 点 点 点 点 点 点 点 点 点 点 点 点 点 点 点 点 点 点 点 点 点 点 点 点 点 点 点 点 点 点 点 点 点 点 点 点 点 点 点 点 点 点 点 点 点 点 点 点 点 点 点 点 点 点 点 点 点 点 点 点 点 点 点 点 点 点 点 点 点 点 点 点 点 点 点 点 点 点 点 点 点 点 点 点 点 点 点 点 点 点 点 点 点 点 点 点 点 点 点 点 点 点 点 点 点 点 点 点 点 点 点 点 点 点 点 点 点 点 点 点 点 点 点 greater than 0.075 ppm (more than 10 km) $$
\square
$$ greater than 0.0075 ppm (more than 10 km) greater than 0.00075 ppm (more than 10 km) Figure 3: SO2 dispersions in summer due to power outage.
$$ \mathrm {点 点 点 点 点 点 点 点 点 点 点 点 点 点 点 点 点 点 点 点 点 点 点 点 点 点 点 点 点 点 点 点 点 点 点 点 点 点 点 点 点 点 点 点 点 点 点 点 点 点 点 点 点 点 点 点 点 点 点 点 点 点 点 点 点 点 点 点 点 点 点 点 点 点 点 点 点 点 点 点 点 点 点 点 点 点 点 点 点 点 点 点 点 点 点 点 点 点 点 点 点 点 点 点 点 点 点 点 点 点 点 点 点 点 点 点 点 点 点 点 点 点 点 点 点 点 点 点 点 点 点 点 点 点 点 点 点 点 点 点 点 点 点 点 点 点 点 点 点 点 点 点 点 点 点 点 点 点 点 点 点 点 点 点 点 点 点 点 点 点 点 点 点 点 点 点 点 点 点 点 点 点 点 点 点 点 点 点 点 点 点 点 点 点 点 点 点 点 点 点 点 点 点 点 点 点 点 点 点 点 点 点 点 点 点 点 点 点 点 点 点 点 点 点 点 点 点 点 点 点 点 点 点 点 点 点 点 点 点 点 点 点 点 点 点 点 点 点 点 点 点 点 点 点 点 点 点 点 点 点 点 点 点 点 点 点 点 点 点 点 点 点 点 点 点 点 点 点 点 点 点 点 点 点 点 点 点 点 点 点 点 点 点 点 点 点 点 点 点 点 点 点 点 点 点 点 点 点 点 点 点 点 点 点 点 点 点 点 点 点 点 点 点 点 点 点 点 点 点 点 点 点 点 点 点 点 点 点 点 点 点 点 点 点 点 点 点 点 点 点 点 点 点 点 点 点 点 点 点 点 点 点 点 点 点 点 点 点 点 点 点 点 点 点 点 点 点 点 点 点 点 点 点 点 点 点 点 点 点 点 点 点 点 点 点 点 点 点 点 点 点 点 点 点 点 点 点 点 点 点 点 点 点 点 点 点 点 点 点 点 点 点 点 点 点 点 点 点 点 点 点 点 点 点 点 点 点 点 点 点 点 点 点 点 点 点 点 点 点 点 点 点 点 点 点 点 点 点 点 点 点 点 点 点 点 点 点 点 点 点 点 点 点 点 点 点 点 点 点 点 点 点 点 点 点 点 点 点 点 点 点 点 点 点 点 点 点 点 点 点 点 点 点 点 点 点 greater than 0.075 ppm (more than 10 km) $$
\square
$$ greater than 0.0075 ppm (more than 10 km) greater than 0.00075 ppm (more than 10 km) $$
\square
$$ Figure 4 :SO2 dispersions in rainy season due to power outage.
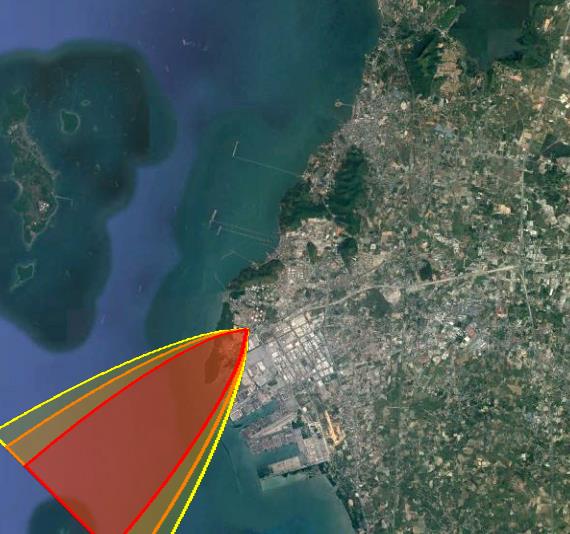
$$ \mathrm {点 点 点 点 点 点 点 点 点 点 点 点 点 点 点 点 点 点 点 点 点 点 点 点 点 点 点 点 点 点 点 点 点 点 点 点 点 点 点 点 点 点 点 点 点 点 点 点 点 点 点 点 点 点 点 点 点 点 点 点 点 点 点 点 点 点 点 点 点 点 点 点 点 点 点 点 点 点 点 点 点 点 点 点 点 点 点 点 点 点 点 点 点 点 点 点 点 点 点 点 点 点 点 点 点 点 点 点 点 点 点 点 点 点 点 点 点 点 点 点 点 点 点 点 点 点 点 点 点 点 点 点 点 点 点 点 点 点 点 点 点 点 点 点 点 点 点 点 点 点 点 点 点 点 点 点 点 点 点 点 点 点 点 点 点 点 点 点 点 点 点 点 点 点 点 点 点 点 点 点 点 点 点 点 点 点 点 点 点 点 点 点 点 点 点 点 点 点 点 点 点 点 点 点 点 点 点 点 点 点 点 点 点 点 点 点 点 点 点 点 点 点 点 点 点 点 点 点 点 点 点 点 点 点 点 点 点 点 点 点 点 点 点 点 点 点 点 点 点 点 点 点 点 点 点 点 点 点 点 点 点 点 点 点 点 点 点 点 点 点 点 点 点 点 点 点 点 点 点 点 点 点 点 点 点 点 点 点 点 点 点 点 点 点 点 点 点 点 点 点 点 点 点 点 点 点 点 点 点 点 点 点 点 点 点 点 点 点 点 点 点 点 点 点 点 点 点 点 点 点 点 点 点 点 点 点 点 点 点 点 点 点 点 点 点 点 点 点 点 点 点 点 点 点 点 点 点 点 点 点 点 点 点 点 点 点 点 点 点 点 点 点 点 点 点 点 点 点 点 点 点 点 点 点 点 点 点 点 点 点 点 点 点 点 点 点 点 点 点 点 点 点 点 点 点 点 点 点 点 点 点 点 点 点 点 点 点 点 点 点 点 点 点 点 点 点 点 点 点 点 点 点 点 点 点 点 点 点 点 点 点 点 点 点 点 点 点 点 点 点 点 点 点 点 点 点 点 点 点 点 点 点 点 点 点 点 点 点 点 点 点 点 点 点 点 点 点 点 点 点 点 点 点 点 点 点 点 点 点 点 点 点 点 点 点 点 点 点 点 点 点 点 点 点 点 点 greater than 0.075 ppm (more than 10 km) $$
\square
$$ greater than 0.0075 ppm (more than 10 km) greater than 0.00075 ppm (more than 10 km) $$
\square
$$ Figure 5 :SO2 dispersions in winter due to power outage.
The results show that if the power outage occurs, then most of the time SO2 concentration greater than the allowable ambient concentration will covers the areas northeast of the petroleum refinery plant. The safe areas from the high SO2 concentrations should be in the north and south of the petroleum refinery plant.
Verification
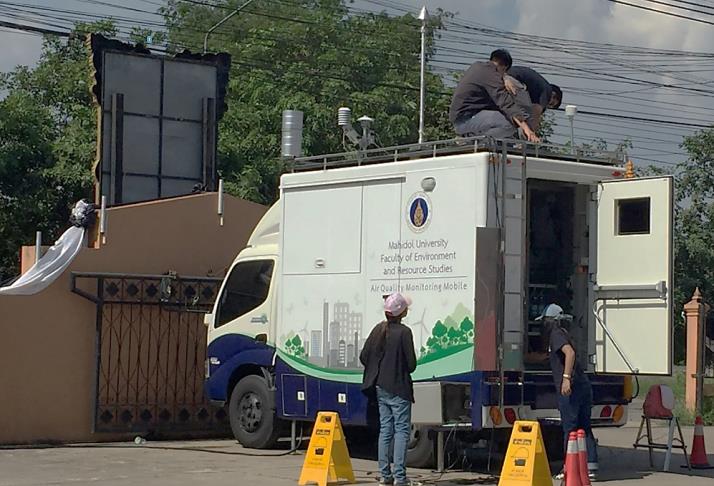
It is impossible to test the model output with the SO2 actually released from the petroleum refinery due to the power outage because it is impossible to know in advance when the outage will occur. The simulated SO2 concentrations were tested with the measured values near the petroleum refinery plant operating normally to measuring station was selected at 2 km northeast (downwind) of the petroleum refinery plant. The measured results are shown in the following Table 2.
| Wind spee | d | Wind | Cloud | Temp. | RH | Calculated | Measured | Error | ||||||||||||||||
|---|---|---|---|---|---|---|---|---|---|---|---|---|---|---|---|---|---|---|---|---|---|---|---|---|
| Time | (m/s) | direction | cover | (ºC) | (%) | SO (ppm) 2 | SO (ppm) 2 | (ppm) | ||||||||||||||||
| (h) | ||||||||||||||||||||||||
| 10-Sep | 1.39 | NE | 9 | 28.3 | 77 | 0.058 | 0.075 | 0.017 | ||||||||||||||||
| 11-Oct | 1.57 | NE | 9 | 29.9 | 78 | 0.055 | 0.06 | 0.005 | ||||||||||||||||
| 12-Nov | 1.75 | NE | 8 | 30.1 | 78 | 0.068 | 0.069 | 0.001 | ||||||||||||||||
| 13-Dec | 1.44 | NE | 8 | 30.3 | 79 | 0.056 | 0.042 | 0.014 | ||||||||||||||||
| 13-14 | 1.13 | NE | 8 | 30.5 | 80 | 0.062 | 0.05 | 0.012 | ||||||||||||||||
| 14-15 | 1.13 | NE | 9 | 30.4 | 80 | 0.062 | 0.05 | 0.012 | ||||||||||||||||
| Average | 0.058 | 0.01 |
Table 2: Simulated and measured SO2 concentrations.
References
-
Informative Report No. 1 (1964) The Petroleum Refining Industry—Air Pollution Problems and Control Methods. J the Air Pollution Control Association 14(1): 30-33.
-
Bruce Finley (2016) Environment news, Denver post, Suncor refinery accident released 75,600 pounds of sulfur dioxide, 150 times daily limit.
-
Abdel Salam HA (2013) Prediction of pollutants emissions dispersion of phosphate fertilizer production facility. Int J Eng Tech 2(11): 306-311.
-
Bariha N, Mani Mishra I, Srivastava VC (2016) Fire and explosion hazard analysis during surface transport of liquefied petroleum gas (LPG): A case study of LPG truck tanker accident in Kannur, Kerala, India. J Loss Prev Process Ind 40: 449-460.
-
Hui S, Guoning D (2012) Risk quantitative calculation and ALOHA simulation on the leakage accident of natural gas power plant. Int Symposium on Safety Science and Technology, Procedia Engineering 45: 352-359.
-
EPA (2017) Reviewing National Ambient Air Quality Standards (NAAQS): Scientific and Technical Information. USA.
-
De Nevers N (2000) Air pollution control engineering. 2nd(Edn.), McGraw-Hill, Boston, pp: 586.
-
Suncor (2018) Refining.
-
Thai meteorological department, seasons in Thailand.
- Nigeria’s Vulnerability in the Face of Global Energy Policy
- A Simulation Study of Investigation of Optimum Oil Production Performance by Applying Various Gas Injection Methods in Oil Reservoir
- Characterization of Permo-Triassic Reservoirs through Thermal Maturity Assessment of Westphalian Source Rocks in the Cheshire Basin
- Influence of Microwax on the Rheological and Thermal Behaviour of a Wax Crude Oil
- Real-Time Monitoring and Performance Optimization of Steam Injection in Heavy Oil Reservoirs Using Fiber Optic Sensing and Integrated Predictive Simulation Models
- Rapid On-Site Determination of the Total Petroleum Hydrocarbon Content of Soils by Handheld Fourier Transform Near-Infrared Spectroscopy: Development of a Global, Site- and Scanner- Independent Calibration Model