Investigation of Different Scenarios in Simulation of Controlling Water Production in Oil Wells Using Silica Gel Treatments
Excess water production is one of the limiting factors in oil recycling, which reduces production efficiency and leaves a lot of costs. In this paper, water control methods were investigated in order to find the best way to control excess water production. For this propos first, a real model was made using the history match of one of Iran's oil fields that produced excess water because of canalization and different simulation scenarios for gel treatment have been investigated. In the study of more scenarios, comparing the water production in the early times and later injecting the gel, the percentage of water production for injection in the early times has been further reduced. When the gel is injected for a fixed period of 6 months in the production and injection wells The best results for lowering the rate of production water are obtained when the gel is injected simultaneously into the injection and production well, which reduces the water production rate by 12,000 barrels, and the best oil production efficiency for when simultaneous injection is performed in the production and injection well. The best treatment method is injection of high concentration gel in the early stages of water production and it's better to inject gel in deeper wells.
Introduction
Water production problem in oil and gas reservoir is a limiting factor, which affects the production process in the oil fields. Disposal of produced water usually affect the environment and the new state law are affected by the production of wells over time. The oil produced with water can’t have a long perspective. Economic analysis records show that the water produced is very contradictory with the production of hydrocarbons and with environmental laws; the cost of producing water and disposal negatively affect the production of hydrocarbons therefore water production should be mitigated [1].
Chemical methods to control water production through the application of gels has been widely applied in the petroleum industry. Different types of gels are used to control excess water production. Gels are composed by mixtures of polymer (monomers) with a chemical cross-linker agent that causes the monomers to be bonded together. One of the new and widely used gels is silicate gel. Other types include polyacrylamides with chrome cross linker. Polymer treatment can dramatically decrease the proportion of water to oil, and in cases, it can restore the production of the marginal wells with high water cut [2].
Gels are liquid-based systems made with solid structural properties, in other words, most of the gel systems are fluid- based systems, where the liquid part form a solid three- dimensional structure, solid mass of the gel [3]. Polymer gel treatment is an effective treatment to reduce water production. Polymer gel can flow into fractures, it can also withstand the pressure difference near the wellbore. In the case of high permeability with high water saturation to reduce water permeability and prevent water channels, a polymer gel when is mixed with Cross linker agent form a solid gel [4, 5], that can block the permeable channels. Sodium silicate is used for water control operations, and before doing so, it can be diluted to reduce the viscosity and to increase the penetration depth in the desired area. The degree of dilution of this fluid is the controlling factor in calculating the final strength and time of attachment of the gel plug [6]. Silica can also be used as a polymer with other chemicals; it comes in the form of a polymer and makes a plug of gel. The silicate reacts with water and forms suspensions. Because the silicate dissolution strength depends on the size of its components, the particle size of this material plays an important role in forming the gel. It should be noted that with decreasing particle size, the solubility of this material increases [7].
Sodium and potassium silicate are produced directly by mixing and combining sand (SiO2) and sodium carbonate ash (Na2CO3) and potassium carbonate (K2CO3) at different ratios and at different temperatures. This combination leads to the formation of glass materials that combine with water vapor to give the formation of silicate liquid, also called water- glass, as shown in Figure 1 [6]. Like polymers, silicate can be polymerized with other chemicals to form a plug or gel, so that silicate reacts with water to form a suspension. Because the solubility of silicate depends on the size of its components, the particle size of the material plays an important role in its conversion into gel. It should be noted that as the particle size decreases, the solubility of this material increases [7].
![Figure 1: Schematic of silicate production steps [7].](/fulltextimages/6784/fig_1.png)
Figure 2 shows a general schematic of the sedimentation and gelation of silicate particles; which slowly become stable over time and form a stable gel. Measurement of gelation time using a Rheometer device, showed that increasing silica concentration, the time of gelation decreases [8].
![Figure 2: Schematic form of gel formation [8].](/fulltextimages/6784/fig_2.png)
The existence of fracture and channels can lead to the transfer of water from the lower layers to the wells and increase the percentage of water production [9].
Seright RS a study of treatments with gel to reduce canalization in high-transferable natural fracture reservoirs, observed the treatment with gel is beneficial to control the water production. A high-density gel should also be injected for treatments in naturally fracture reservoirs. However, treatments with gels of low gel concentration, have not been helpful [10].
Julio Herbas in an examination of the gel treatments based in laboratory experiments and reservoir simulations of the chemical reactions, modelled the gelation process in Eastern Venezuela’s wells, which reduced the amount of water cut by 38% [11].
Model Setting
The reservoirs in the underground have unique characteristics, some properties may change during the exploitation of the reservoir, as fluid compositions, pressures, and saturations. Theoretically, if the correct information describes the characteristics of the reservoir rock entered in the simulation model, a representative history match can be achieved [12]. In this study, to history match the reservoir numerical model, the oil-water relative permeability’s were adjusted; initially a model for an Iranian field was simulated considering the field parameters obtained from wells data, cores, fluids, etc.
Due to the inconsistency observed initially history matching the production rates, the oil water relative permeability parameter was adapted to the actual production flow by tuning some the water oil relative permeability’s. As a result, the model calculated production that match the historical production data; hence it was concluded the tuned model should be able to generate consistent prediction, this process is described as the history matching.
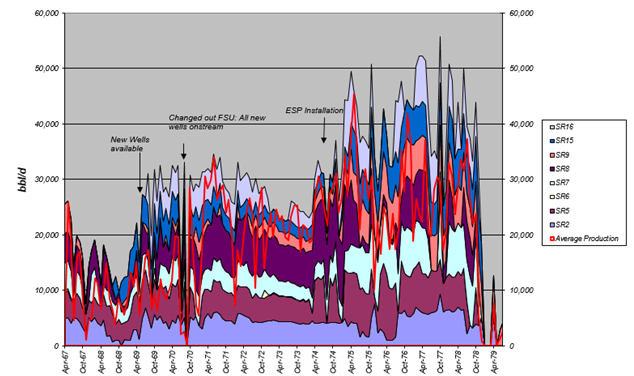
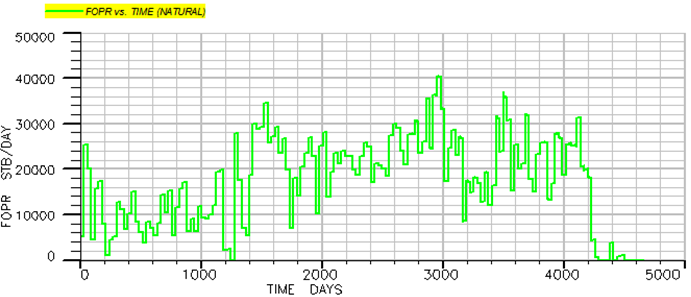
The field production history and the parameters obtained with the history matched model are shown in Figures 3 & 4.
Relative Permeability Changes for History Matching
According to a sensitivity analysis done to history match the field data, changes in the discharge flow are more affected by adjusting the relative permeability’s to water and to oil, therefore, there some adjusts were incorporated before a satisfactory history match was achieved.
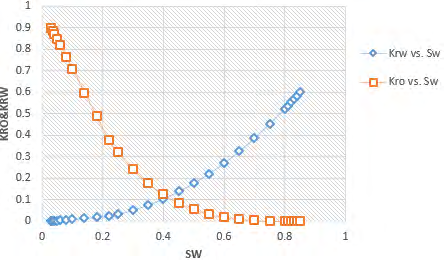
The water oil relative permeability curves before the history matching are shown in Figure 5, and the modified water oil relative permeability’s curves are in Figure 6.
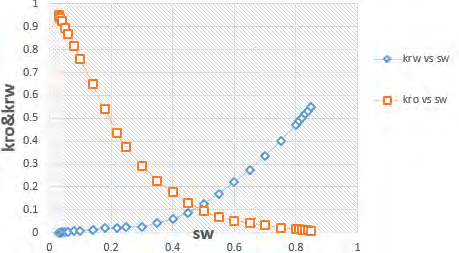
During the history adaptation as shown in Figures 5 and 6, the relative permeability graph of the reservoir has changed from oil-wet to water- wet.
Simulation Model
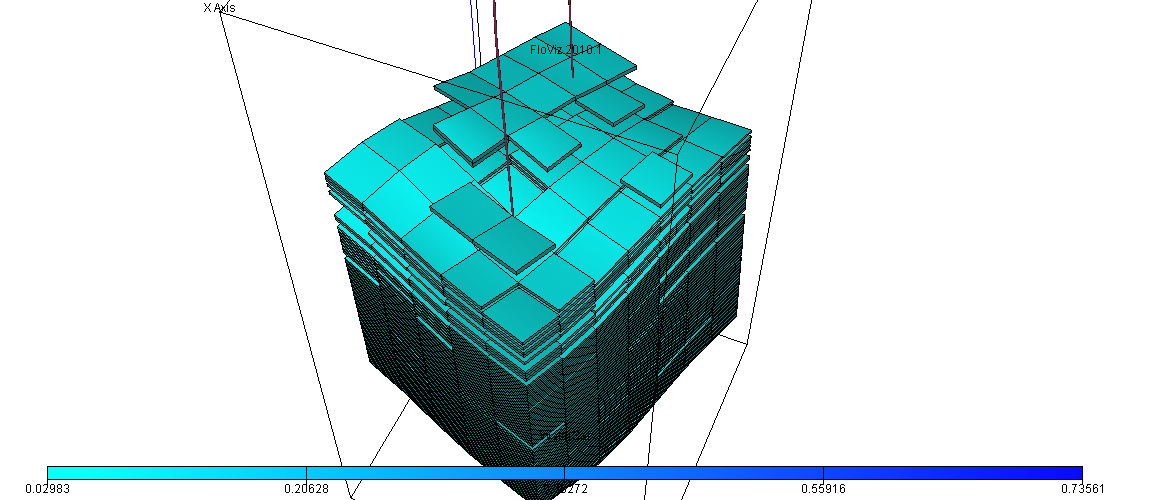
To simulate the gel injection to reduce water production in one of the wells of the field, a numeric model was build using the Eclipse simulator Figure 7. The sector behave is similar to the model obtained from the history matching due to having the same petro physical and dynamic characteristics with the model obtained from the model history matching. Thus, the accuracy and behavior of the sector will be similar to whole of the reservoir.
The three-dimensional structure of the model is in the form of tiny layers interstratified, in some places, there were assigned null values due to the lack of porosity and permeability. The Dimensions of each block grid are shown in Table 1.
| DX | 328 ft (L) |
| DY | 328 ft (W) |
| DZ | 328 ft (H) |
Table 1: Dimensions of each block grid.
Petro-Physical Characteristics of the Model
The depth of the reservoir is from 6774 to 7307 feet, the pressure before the production was 3610 psi reservoir; the production from the reservoir caused a pressure in the produced layers to 1284 psi. Because the reservoir is heterogeneous, the permeability range is from 100 up to 12000 md and the porosity variation from 10 up to 25%. The Primary Properties of the Reservoir are shown in Tables 2 & 3.
| 3610 | |
|---|---|
| Reservoir Temperature (°F) | 180 |
| Reference Depth (feet subsea) | 6774 |
| Oil Gravity (°API) | 14 |
| Oil Viscosity (cP) | 25 |
| Brine Salinity (PPM) | 1200 |
Table 2: Primary Properties of the Reservoir.
| Layers | Rock Type | Porosity (%) | Permeabiliy (mDarcys) |
|---|---|---|---|
| 1-17 | Sandstone | 17 | 0-2000 |
| 18-36 | Sandstone | 10 | 300-2500 |
| 37-68 | Sandstone | 17 | 400-3000 |
| 69 -98 | Sandstone | 19 | 100-12000 |
| 99-120 | Sandstone | 20 | 200-6000 |
| 121-150 | Sandstone | 25 | 1000-8000 |
| 150-164 | Sandstone | 35 | 1000-12000 |
Table 3: Rock Properties 3-D Model.
Gel Treatment
To heal the water channels, which were producing high water cuts, it was modeled a gel treatment. The POLYMER keyword is used in the Eclipse simulation model; the properties of the gel are according to the following Tables 4 & 5.
| Concentration of polymer absorbed by the rock (lb/lb) | |
|---|---|
| 0 | 0 |
| 7.01 | 0 |
| 8.011 | 0.000005 |
| 40 | 0.0000051 |
Table 4: Polymer Adsorption in the rock as function of concentration.
| Polymer Concentration (lb/stb) | Rate of Viscosity Change (cps) |
|---|---|
| 0 | 1 |
| 1 | |
| 40 | 1.00001 |
| 1.00001 |
Table 5: Change in polymer viscosity as function of concentration.
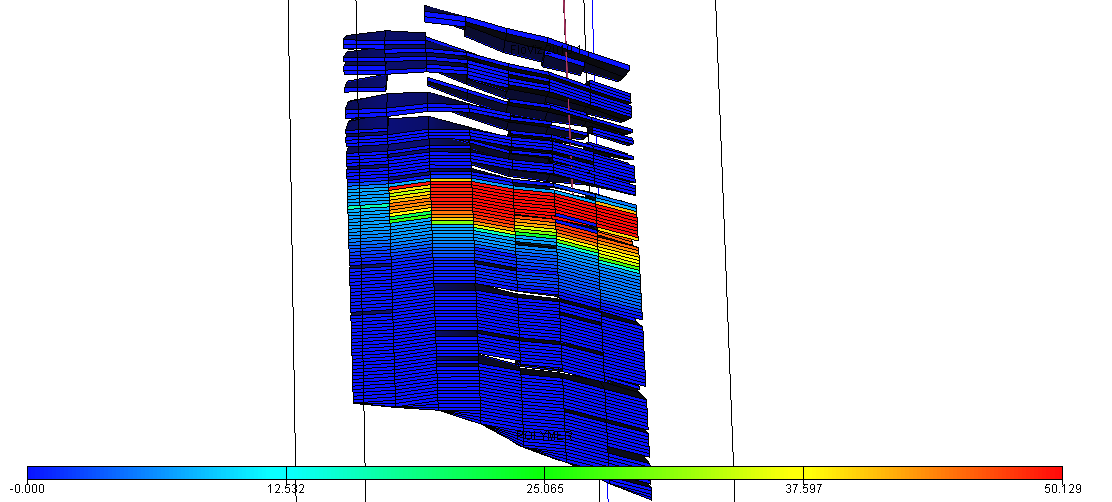
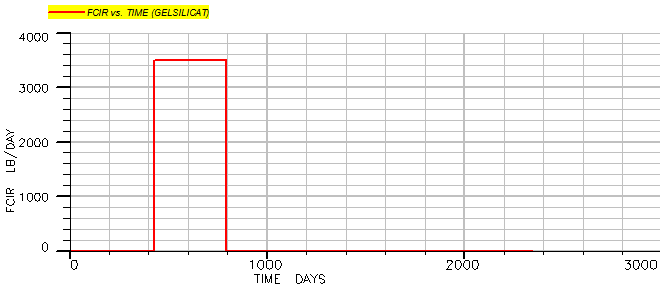
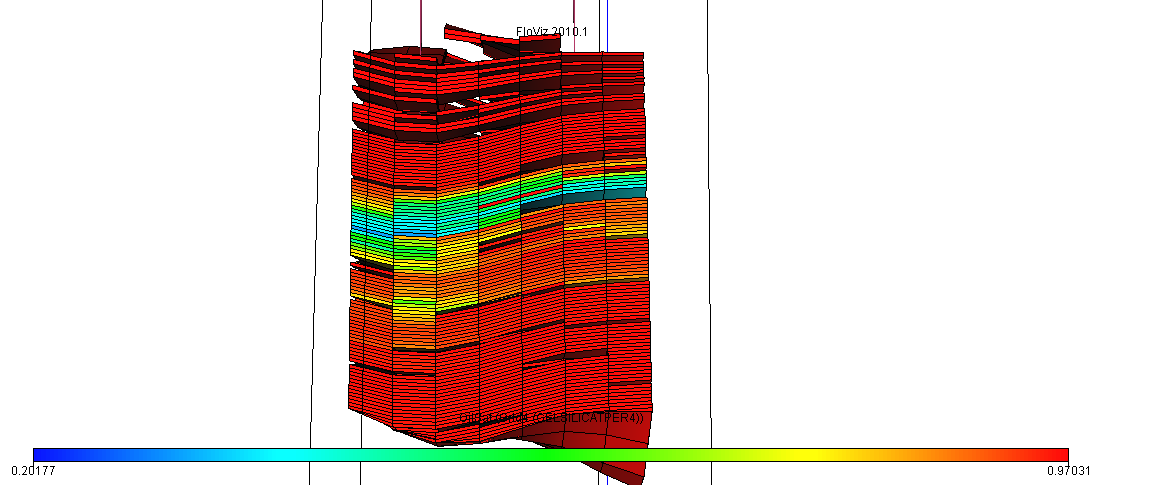
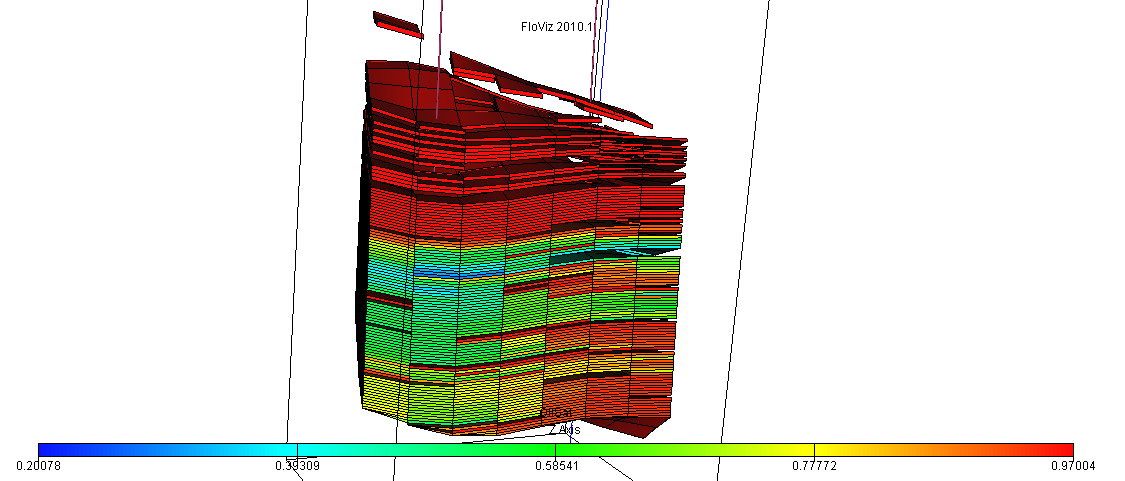
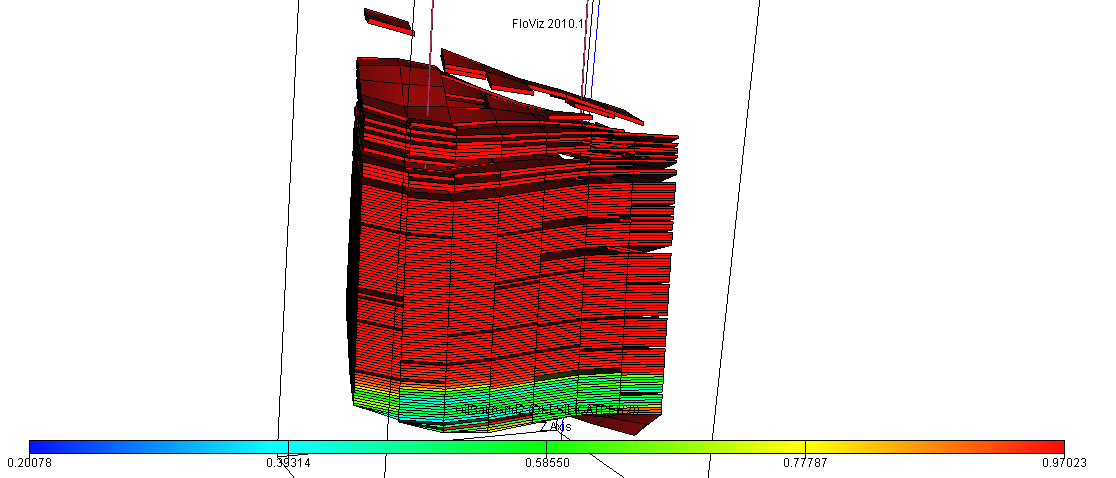
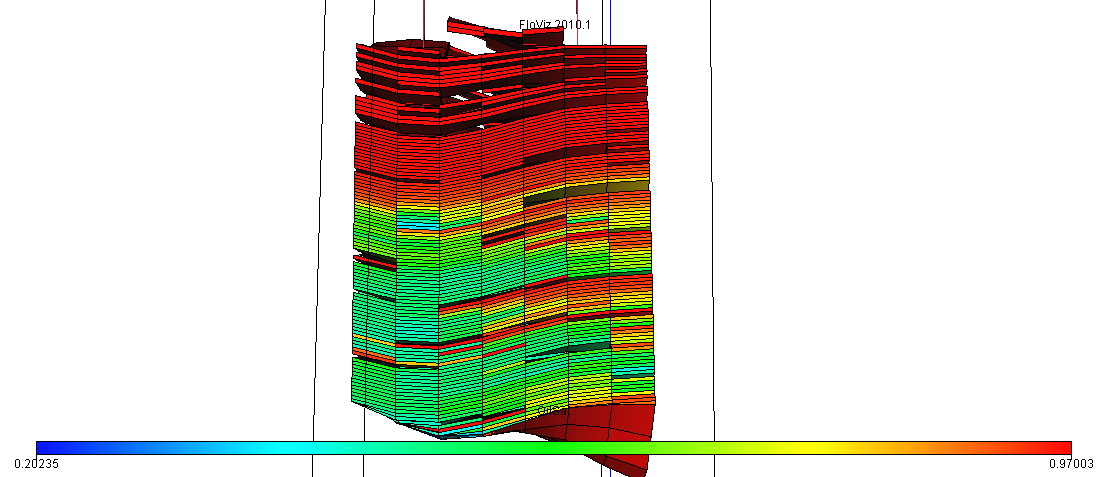
A flow resistance factor (RRF) of 10,000, was applied, to create high resistance to (against) water flow. The Figure 8 shows the injection of the gel and illustrate the gel propagation in the reservoir (blue is zero gel concentration, and red maximum gel concentration 50 lb/stb). The gel injection was initiated in the model, at 410 days at the time when the reservoir started water production; the injection gel rate is 3500 (lb/day) diluted in the injection water, Figure 9.
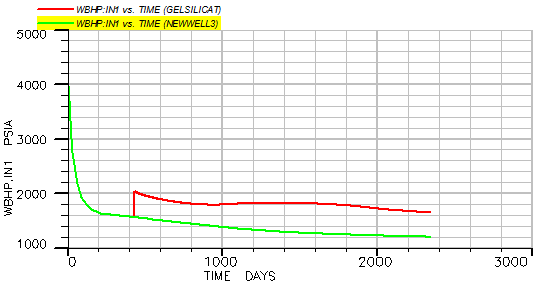
The bottom hole pressure in the injector well before and after injection gel injection, Figure 10, showed increases from 1600 to 2000 Psi.
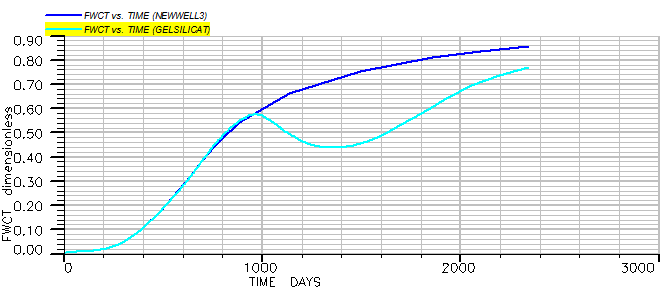
The water cut in the producer well was substantially reduced. That’s why if on the 500th day of production, the injected gel reduces the water production; on the 1400th day of production the water cut is 45%, and the gross water cut reduced is 30%, Figure 11.
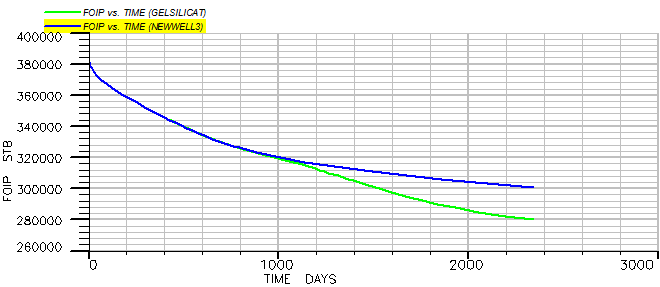
The amount of oil in place in the model has decreased before the injection of the gel and after the injection of the gel. Because the gel is injected into the pores and canals of the water transducer and prevents the flow of water in these channels, then the water is forced to pass through other finer pores and undisturbed areas which will sweep the oil into untapped areas which results in a reduction in water production and an increase in oil production and a reduction in the amount of oil left underground.
For the case of gel injection, the field oil in place (FOIP) after 2300 days of production decreases from 300000 barrels for the water injection case, to 280000 barrels that means 20,000 barrels of oil incremental production, Figure 12.
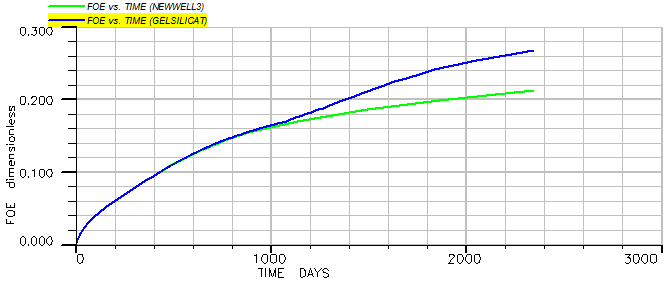
Additionally, and more important, the rate of oil production will increase by 5% after 2300 days of production, Figure 13.
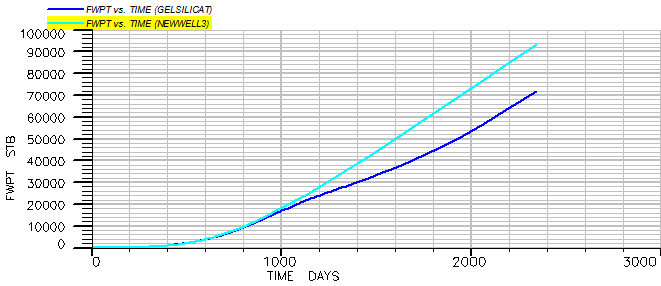
Comparing the water produced for the cases of water injection and the gel injection, Figure 14, it shows 94,000 barrels of produced water for the water injection and 72,000 barrels of water for the gel injection that means a total of 22,000 barrels of water production has been reduced.
The pressure variation, Figure 15, shows that increasing fluid production, pore pressure decreases, with the injection of gel, the pressure graph has increased. The gel is placed inside the pore instead of water and it prevents the pore pressure drop and reservoir. The Simulation results of gel injection on oil production efficiency and Reduction of water production for gel injection are according to the following Tables 6 & 7.
| Injected Volume of Gel (Bbl) | Oil In Situ (Bbl) | Oil Cumulative Production (Bbl) | Oil Recovery% | |
|---|---|---|---|---|
| New well | ----- | 300,000 | 80,000 | 21% |
| Gel Injector | 25550 | 280,000 | 100,000 | 27% |
| Incremental produced oil | 20,000 | 6% |
Table 6: Simulation results of gel injection on oil production efficiency.
| Well | Injected Volume of Gel (bbl) | Produced Water (bbl) | |
|---|---|---|---|
| Water Injection | Gel Injection | ||
| Gel Injector | 25,550 | 94,000 | 72,000 |
| Reduction in produced water | 22,000 |
Table 7: Reduction of water production for gel injection.

Gel Injection with different Concentrations
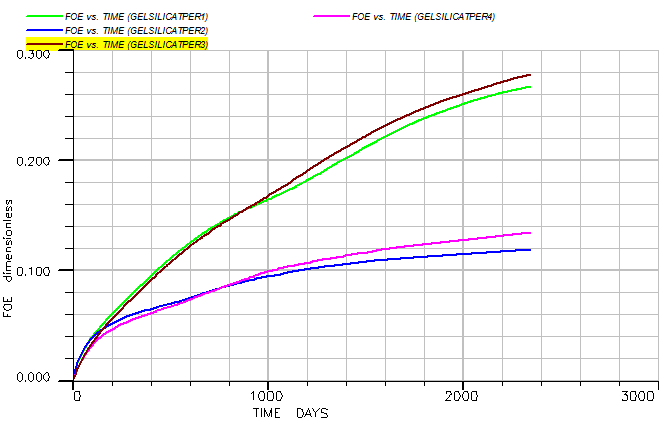
The gel was injected at various concentrations of 10, 20, 50, and 100 (lb/stb). Comparing the efficiency of oil production for these concentrations, it can be seen that increasing the concentration of injected polymer also increases the oil production efficiency, Figure 16, maximum concentration was 100 (lb/stb).
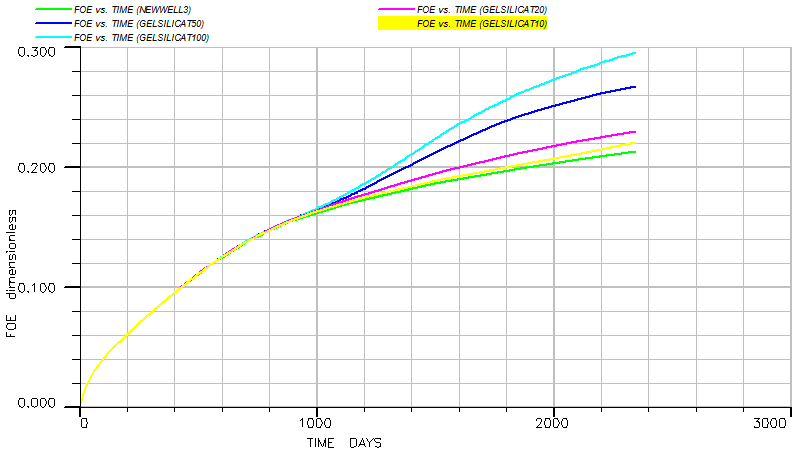
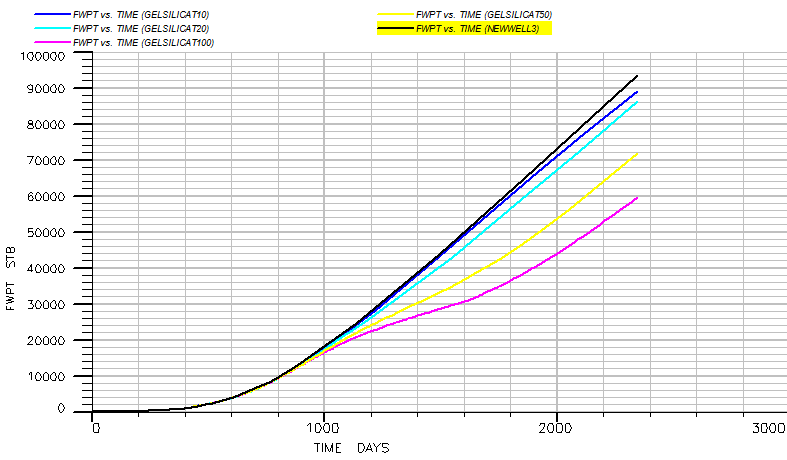
The predicted water production rate is different for different gel concentrations. By increasing the concentration of injectable polymer, the resistance of the gel to flow is increased and as a result, the water production rate decreases Figure 17. The Effect of Different Concentrations on Water Cut and Production Efficiency are shown in Table 8.
| Well and Gel Concentration | Injected Volume of Gel (Bbl) | Produced Water (Bbl) | Oil Recovery Factor (%) | |
|---|---|---|---|---|
| Before Injection Gel | After Injection Gel | |||
| NEW WELL | -------- | 94000 | --------- | 21% |
| 10 Gel inj (lb/stb) | 25550 | 94000 | 89000 | 22% |
| 20 Gel inj (lb/stb) | 25550 | 94000 | 86000 | 23% |
| 50 Gel inj (lb/stb) | 25550 | 94000 | 72000 | 27% |
| 100 Gel inj (lb/stb) | 25550 | 94000 | 60000 | 29% |
Table 8: Effect of Different Concentrations on Water Cut and Production Efficiency.
Repetition Scenario of Gel Injection in Early Times
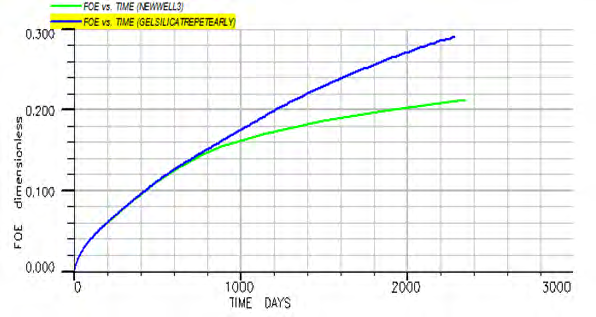
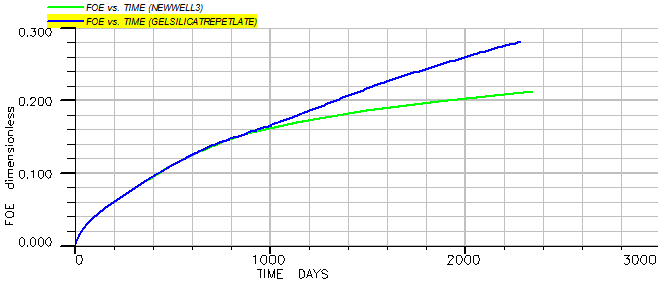
In this scenario, gel injections are performed continuously over three different time periods (one time each year). In the first six months of production, when water cut is low, gel injections begin in the first period. The gel is not injected for one year after each injection. The production efficiency chart is shown in Figure 18 in comparison with the case of gel injection in the early times.
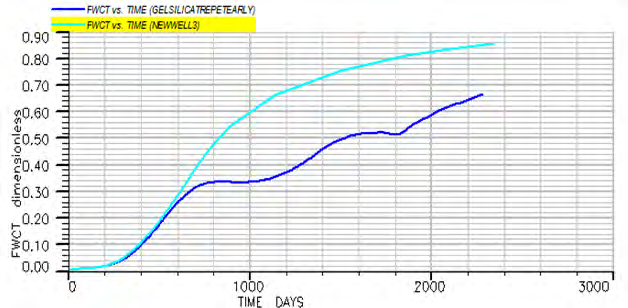
The chart of water production percentage of the well decreases significantly compared to the repeated mode of gel injection in the early times (six months after production) and by performing each step of gel injection, it prevents the increase of water production percentage. According to Figure 19.
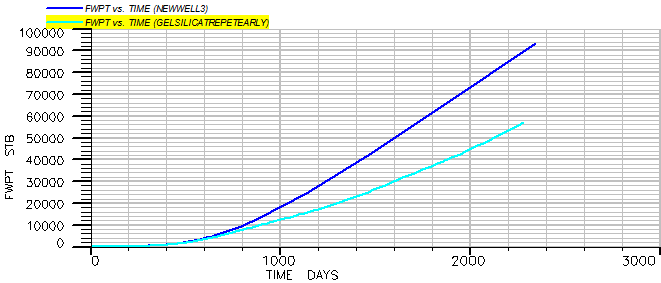
And the water production rate chart has been reduced by 30,000 barrels compared to the non-injection mode of the gel according to Figure 20.
Repetition Scenario of Gel Injection at later Times
In this scenario, the injection is repeated for three different time periods for one year. Gel injections should be given later than production (one year after production) when the water cutting rate is higher. The process is to inject the gel after one year of production from the well. Then, for one year, the well will produce a normal state (no gel injection) and the gel will be injected again in the same way to inject the gel three times. In Figure 21 the production efficiency is compared to the non-injection mode of the gel.
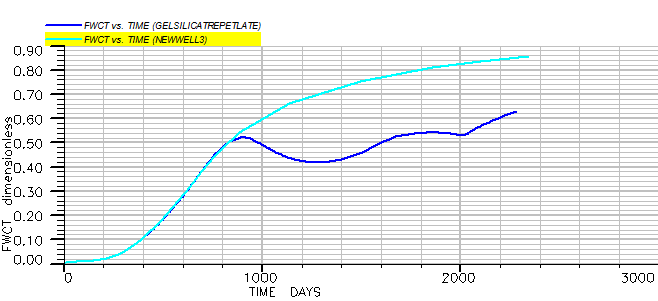
According to Figure 22, the water production percentage starts to decrease a lot after twelve months of production and one year of gel injection and over time the gel closes, and by performing each step, gel injection prevents the percentage of water production from increasing. The water production rate chart has been reduced by 30,000 barrels compared to the non-injection gel mode according to Figure 23.
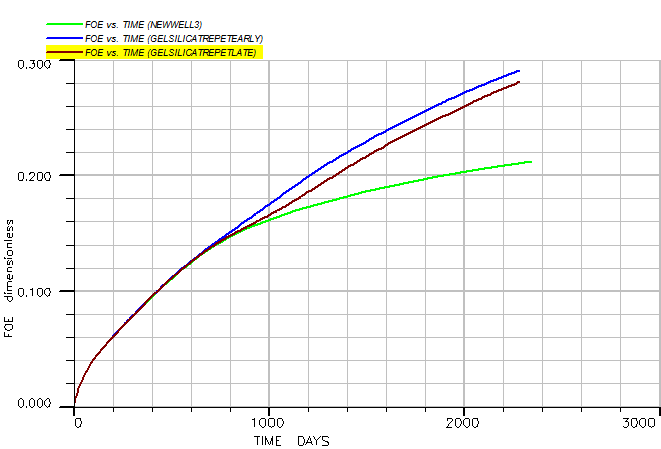
By comparing the production efficiency in the early and later times of gel injection, it can be seen that the injection is better in the early stages of production efficiency, which can be seen in Figure 24.
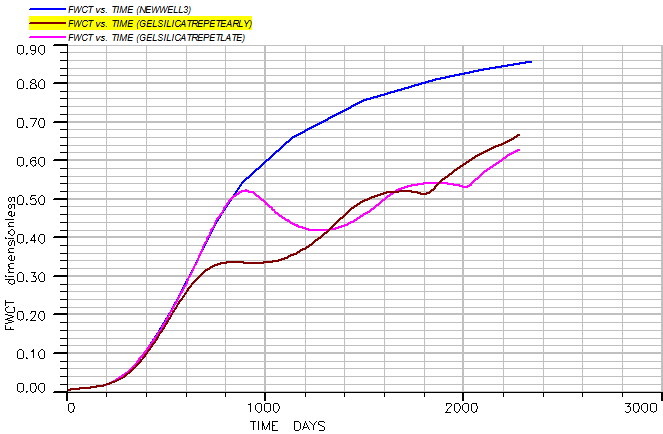
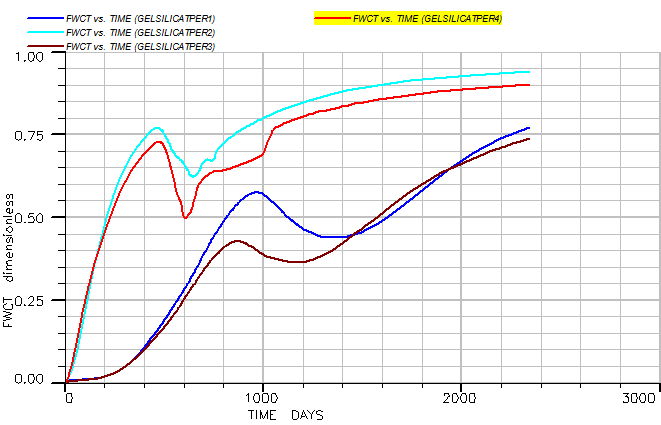
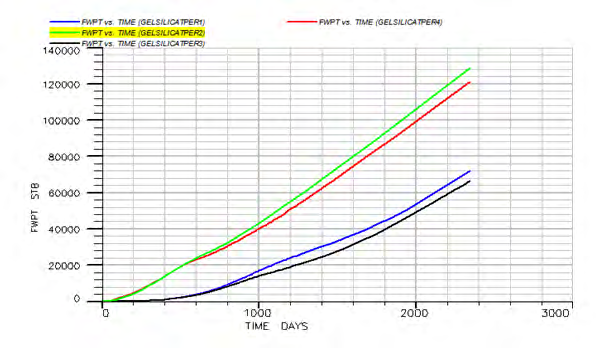
Comparison of Water Production in Early Times and Later Gel Injection
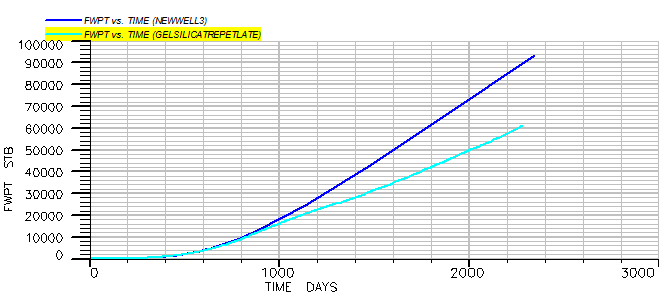
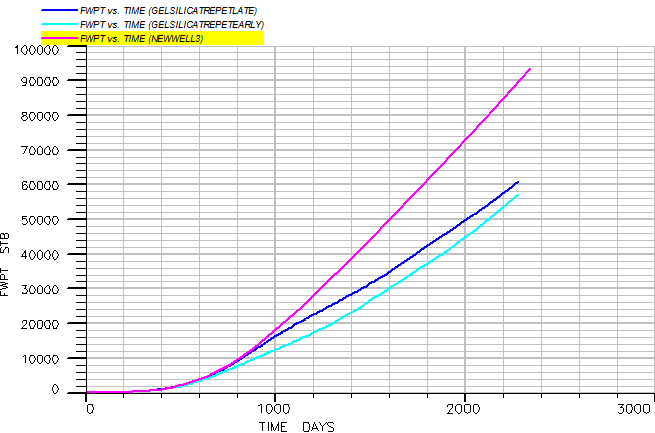
The diagram of the percentage of water production for injection in the early times has decreased further according to Figure 25. The rate of water production has improved for the time when the injection was given in the early days, when the water production rate was low, and the water production rate has decreased further. According to Figure 26.
Scenario of Production Injection and Production Layer
The definition of this scenario is that the perforation in different layers is done in four different modes, in which the gel is also injected: 1. The first case when injecting well perforated in the upper layers and the perforation of the production well should be done in the lower layers. According to Figure 27.
2. The second case, when the injection and production wells are both perforated in the lower layers of the model according to the Figure 28.
3. The third case is when the injection well is perforated in the lower layer and the production well perforated in the upper layers. According to Figure 29.
4. The fourth case when the perforation of the injection and production layer of both upper layers is done. According to Figure 30.
The highest production efficiency is for the case where the injection well is perforated in the lower layers and the production well is perforated in the upper layers because in this case the injected water sweeps more oil and directs it towards the production well. The lowest production efficiency is related to the fact that both the production and injection wells are perforated at the bottom of the wells, because in this case the injection water quickly reaches the production wells and does not cover a large area to sweep the oil. According to Figure 31.
The highest percentage of water production according to Figures 32 & 33 is related to the case that the injection and production wells are perforated in the lower part of the well and have a high water production rate and the lowest percentage and production water rate. It is related to the case that the injection well is drilled in the lower layers and the production well is drilled in the upper layers.
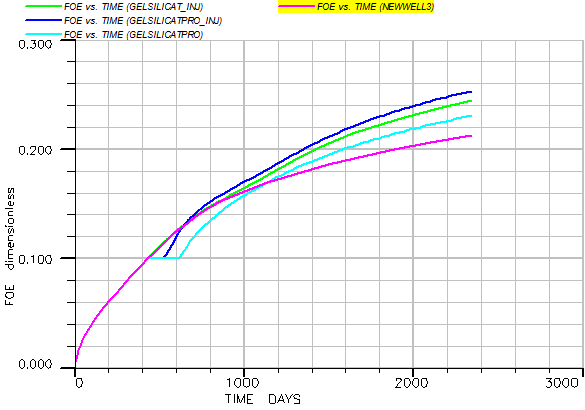
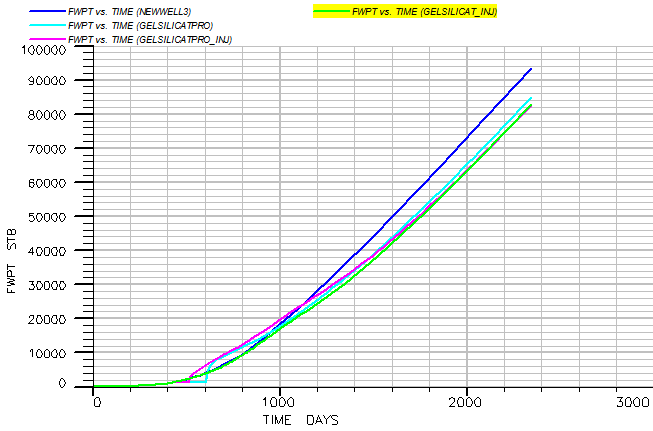
Injection Change Scenario in Production and Injection Wells
If we have injections in the model for six months, the oil production efficiency charts are in the form of Figure 34, which shows that when the gel injection in the injection well for three months and the gel injection in the production well for same time, In other words, if we have a total of six months of gel injections in the model, the efficiency of oil production has increased. Compared to the similar mode, which only injected the gel into the production well or only injected the gel into the injection well, Injection and production is that the injected gel penetrates the production cells in the cells adjacent to the well for a period of three months and prevents the production of water in the pores, and the oil flows instead of water, and in three months the gel is injected into the well. Production reduces the rate of water production until the entire injection gel is produced, while increasing oil production. The reason for the decrease in production efficiency chart at the beginning of the gel injection time is due to the fact that the production well was closed during that period. The rate of water production as shown in Figure 35 for the time when the gel injection takes place simultaneously in the injection and production well is less than in other similar cases in the same time period. Of course, the amount of water produced in the injection state at the same time in the production and injection wells with injection is only slightly different from the injection wells. When only injections are made in the production well, the amount of water produced is more than other methods of gel injection because the time of presence of the gel in the tank is less than other cases and after a short time all the injected gel is produced.
Conclusions
1. By history matching and changing parameters of reservoir properties, including relative permeability we achieved a representative model of the reservoir. 2. Gel injection reduces water production and increases the oil production. By injecting the gel, the amount of oil in place dropped from 300,000 barrels to 280,000 barrels after 2,300 days of production. That means 20,000 barrels of incremental oil are predicted to be produced.
3. After 1400 days, the percentage of water production has dropped by 30%. 4. By increasing gel concentration, the rate of water production decreases and oil production efficiency increases. 5. From different gel concentrations that were modelled, the gel concentration of 100 (lb/stb) showed the best results. 6. When the gel is injected continuously at different times, it keeps the water production rate at low percentages and prevents a sharp increase in water production. 7. Gel injection in the early times reduces the amount of water production from 90,000 barrels to 56000 barrels and gel injection in later times when water production is higher reduces the amount of water production from 90,000 barrels to 60,000 barrels. If the gel is injected in the early stages when the amount of water produced is low, it will reduce the amount of water produced more than other times when the amount of water produced is higher. 8. When perforation of the production and injection wells are changed, the best scenario is related to the case where the production wells are perforated at the top and the injection wells are done at the bottom, in which case the water and oil injection gel are better swept. In this case, the water production efficiency reaches 28% and the water production percentage reaches less than 30%. 9. When the gel is injected for a fixed period of 6 months in the production and injection wells. The best results for reducing production water rates are obtained when the gel is injected into the injection well, which reduces the water production rate by 14,000 barrels, and the best oil production efficiency for when the injection is made in the production and injection wells is when the efficiency is reduced. Oil recycling has increased by four percent.
References
-
Dahl A, Nguyen P, Dalrymple E, Rahimi A (1992) Current Water-Control Treatment Designs. European Petroleum Conference, Cannes, France.
-
White J, Goddard J (1973) Use of Polymers To Control Water Production in Oil Wells. J Pet Technol 25 (2): 143-
-
Dupuis G, Bouillot J, Templier A, Zaitoun A (2015) Successful Chemical Water Shut-Off Treatment in an Omani Field Heavy-Oil Well. Abu Dhabi International Petroleum Exhibition and Conference, Abu Dhabi, UAE.
-
Shahab U, Dolan JD, Chona RA, Gazi N, Monteiro K, et al. (2003) Lessons Learned from the First Openhole Horizontal Well Water Shutoff Job Using Two New Polymer Systems-A Case History from WafraRatawi Field Kuwait. Middle East Oil Show, Bahrain.
-
Miller M, Chen KS (1997) Water and Gas Control Gel Placement. SPE Western Regional Meeting, Long Beach, California.
-
CEES (2013) Soluble Silicates: Chemical, toxicological, ecological and legal aspects of production, transport, handling and application: Centre Europeend’Etude des Silicates.
-
Helleren J, Stavland A, Hatzignatiou D (2014) Numerical Evaluation of Dynamic Core-Scale Experiments of Silicate Gels for Fluid Diversion and Flow-Zone Isolation. SPE Prod & Oper 29 (2): 122-138.
-
Metin CO, Rankin KM, Nguyen Q (2012) Phase behavior and rheological characterization of silica nanoparticle gel. Applied Nanoscience 4: 93-101.
-
Bailey B (2000) Water Control. Oilfield Review, Schlumberger Company, Springer.
-
Seright RS, Lee R (1998) Gel Treatments for Reducing Channeling in Naturally Fractured Reservoirs. SPE Prod & Fac 14(4): 269-276.
-
Herbas J, Moreno R, Marin A, Romero M, Coombe D (2004) Reservoir Simulation of Non-Selective Placement of a Polymer Gel Treatment to Improve Water Injection Profiles and Sweep Efficiency in the Lagomar Field Western Venezuela. SPE International Petroleum Conference in Mexico, Puebla Pue., Mexico.
-
Mattax CC, Dalton RL (1990) Reservoir Simulation. J Pet Technol 42(6): 692-695.
- Nigeria’s Vulnerability in the Face of Global Energy Policy
- A Simulation Study of Investigation of Optimum Oil Production Performance by Applying Various Gas Injection Methods in Oil Reservoir
- Characterization of Permo-Triassic Reservoirs through Thermal Maturity Assessment of Westphalian Source Rocks in the Cheshire Basin
- Influence of Microwax on the Rheological and Thermal Behaviour of a Wax Crude Oil
- Real-Time Monitoring and Performance Optimization of Steam Injection in Heavy Oil Reservoirs Using Fiber Optic Sensing and Integrated Predictive Simulation Models
- Rapid On-Site Determination of the Total Petroleum Hydrocarbon Content of Soils by Handheld Fourier Transform Near-Infrared Spectroscopy: Development of a Global, Site- and Scanner- Independent Calibration Model