Thermodynamic Aspects of pH and Wettability Changes in Low Salinity Water Flooding Oil Recovery
Low salinity water flooding has for decades emerged as a technically and economically viable enhanced oil recovery scheme due to its environmentally attractive nature. In the literature, several reasons have been proposed for its immense success, some of which have been experimentally proven. Among the reasons given, wettability and pH increase have been greatly highlighted. In this paper, we have developed a pH and salinity dependent Gibbs free energy of adsorption model, using established thermodynamic concepts to prove the viability of hydrogen ions adsorption which can lead to pH and wettability increase. Accordingly, we have shown based on theoretical calculations that as salinity decreases, adsorption free energy for hydrogen ions decreases, leading to pH decrease at lower salinities. Our theoretical calculations also agree with optimum salinity ranges reported in the literature.
Introduction
Improved oil recovery based on water flooding was first discovered in early 1865 following an accidental flooding of water in Pithole City, Pennsylvania as a result of leaks from surface water and shallow water which entered the drilled holes. It became clear that the oil recovery factor by water flooding was significantly high compared to the natural depletion [1]. In 1924, the first commercial application of water flooding evolved in Pennsylvania, following which it grew and was widely implemented in many field operations [2]. In its practical application, economics and injection water compatibility were crucial factors in decision making. Consequently, many attempts were made in understanding the mechanism, planning and optimization of the entire process. Furthermore, considering its simplicity and reliability, water flooding technique has been worldwide implemented and applied to most of conventional oil reservoirs to augment oil recovery. In the 1990s, research in water flooding was devoted more to understanding the effect of water chemistry [3] following which the potential of Low Salinity Water Flooding (LSWF) was realized and developed by Morrow and his coworkers. In principle, LSWF consists of injecting brine of low concentration into the petroleum reservoir resulting in oil recovery that surpasses that of the conventional water flooding technique without emphasis on salinity.
Several factors are responsible for the success of LSWF among which are the wettability and local pH increases [4, 5, 6]. Normally, the injection of a low saline fluid, which promotes desorption of Ca2+, will create a local increase in pH close to the brine-clay interface because Ca2+ is substituted by H+ from the water [4, 7]. Several researches have been devoted to understanding the mechanism of pH and wettability evolution. For instance, Aziz, et al. [6] used molecular dynamics simulation approach to gain insight insights into pore-scale dynamics of wettability alteration during low salinity water flooding. Chen, et al. [8] used experimental approach to understand pH increase in LSWF. Physicochemical processes involved in LSWF spans geochemical process [9], that include surface adsorption of ions and fluid phase complexation reactions [4]. Moreover, as low salinity water is injected into the reservoir, the ionization of water increases due to the temperature effect [10]. Water ionization process will produce hydrogen ions, which are expected to reduce pH.
Therefore, if pH increases during LSWF then adsorption of hydrogen ions on rock surface is imminent. In the literature the surface complexation model has been used to understand adsorption phenomena [11, 12].
In this paper, we have used existing thermodynamic concepts to develop a pH and salinity dependent electrostatic Gibbs free energy of adsorption model to understand adsorption phenomena related to hydrogen ions, which has the potential for pH increase. Accordingly, we have carried out theoretical calculations based on our model and we have shown that as salinity decreases in general, the free energy of adsorption of hydrogen ions decreases, facilitating its adsorption on rock surface, which results in pH increase as reported in the literature. Calculations based on our model also confirm optimum salinity range reported in the literature based on experimental evidence.
Hypothesis
Within the petroleum reservoir, geochemical reactions related to adsorption that occur during oil trapping in structural traps are like those that occur during LSWF. Therefore, our fundamental hypothesis is that if pH and wettability increase occur in LSWF, then the adsorption of hydrogen ions from water must be thermodynamically favoured at formation water pH and low salinity. Therefore, a thermodynamic model that links the Gibbs free energy of adsorption of hydrogen ions to salinity and pH of formation water should provide evidence of feasibility or otherwise of this reaction. Within the thermodynamic literature, models of adsorption free energy exist that can be exploited to develop a salinity pH dependent Gibbs free energy and the following section will be devoted to this task. Moreover, LSWF simply implies enhanced pH and double layer repulsion increases. We further hypothesize that if these are observed realties then decrease salinity must show favorable thermodynamics.
Theoretical Background
Geochemical reactions involving the adsorption of ions on mineral surfaces in geologic systems can be driven by electrostatic and Coulombic forces, redox chemistry, entropy and interfacial tension minimization, and hydrophobic expulsion, among others [13], where the reactions can be described by the thermodynamic Gibbs free energy. Generally, a metal ion adsorbing from a bulk electrolyte solution onto a charged mineral surface must pass through the electrochemical double layer set up in the interfacial region. For an ion moving through such a double layer, the following additive expression can be used to quantify the change in adsorption free energy [14]:
G G G abs electrostatic chemical ∆ = ∆ + ∆ (1)
In which Gabs ∆ is the change in Gibbs free energy of adsorption [H+ mol-1], Gelectrostatic ∆ is the electrostatic contribution and Gchemical ∆ is the chemical contribution. The electrostatic component, which comes from Coulombic forces, can be related to surface potential as:
0 G F z electrostatic ψ ∆ = ∆ (2)
In which F is Faraday constant [Cmol-1], z ∆ is change in charge [C] and 0 ψ is the surface potential of solid surface [V]. At a given pH of aqueous solution, the degree of ionization of surface Silanol group is given as [15]:
1
1 10 2.7 z pH pK zys α = − +
(3) ( ) In which, z is the charge; negative for acidic site and positive for basic site, pH is negative logarithm to base 10 of hydrogen ion concentration, pK is negative logarithm to base 10 of the dissociation constant of surface functional group, ys is the scaled potential defined as:
e ys Tk ψ = (4)
0 B
In which, e is the electronic charge [C], T is absolute temperature, 0 ψ is surface potential [V], and B k is Boltzmann constant [JK-1] At a given pH and salinity defined by equivalent sodium chloride concentration, the fraction of surface coverage of an adsorbed species, such as hydrogen ion is given as [16]:
1
10 pH Sc Na α + − = +
(5) ( ) In which, Sc is surface coverage [moles per unit area, Na+ is sodium ion concentration. Substitution of Equation (3) into Equation (5) gives surface coverage of hydrogen ions as:
1 1 1 * * 10 1 10 s sil z pH pK pH y S SSA C c Na ez ( ) ( ) ( ) ( )
− − + − = + +
(6) In which SSA specific surface area of quartz [cm2g-1] and sil C is the concentration of surface Silanol group on quartz [mmolsg-1].
To achieve our objective in this paper, we will limit ourselves to the electrostatic Gibbs free energy change. We will further assume that surface coverage here refers to charge change as found in Equation (2). Substitution of Equation (6) into Equation (2) gives change in Gibbs free energy of adsorption for hydrogen ions as:
1 0 1 1 * * * 10 1 10 s sil z pH pK pH y G F SSA C electrostatic Na ez ψ −
( ) ( ) ( ) ( )
− + − ∆ = + +
(7) To complete the derivation for change in Gibbs free energy for hydrogen ion adsorption, the relationship between potential and pH is required. The relationship between the pH of solid surface and bulk solution is given as [17]:
e pH pH k T ψ − = (8)
0 2.3 s B B
In which pH is surface pH, e is electronic charge B pH is bulk pH. It is possible to rewrite Equation (8) as:
( ) 0 2.3 / pzc B pH pH k T e ψ = − (9)
Substitution of Equation (9) into Equation (4) and further substitution into Equation (7) gives change in Gibbs free energy as:
( ) 1 1 * * * *2.303 / 10 1 10 s sil pzc B z pH pK pH y G F SSA C pH pH k T e electrostatic Na ez − + − ∆ = − + + ( ) ( ) ( ) ( ) (10) To investigate our principal hypothesis, we will use Equation (9) for free energy change calculations for hydrogen ion adsorption to explore the trend considering the salinity effect as pH increases. The following table shows parameters from literature sources for our calculation, using Equation (10).
| Parameter | Value | Reference |
|---|---|---|
| Point of zero charge pH of silica surface [-] | 3 | [18,19] |
| Faraday’s constant | 96485 | [20] |
| Surface concentration of Silanol group-[mmoles/g) | 3.6 | [21] |
| Specific surface area of quartz [cm2g-1] | 5.22 m2g-1 | [22] |
| pKa of surface Silanol | 5.6 | [23] |
| Boltzmann constant –JK-1 | 1.38*10-23 | [24] |
Table 1: Literature source data for calculation.
Electrostatic interaction is a physical adsorption process, faster than chemical adsorption. Moreover, the adsorption basically includes two distinct processes, namely ion external diffusion from the bulk aqueous solution to the surface of the solid and adsorption reaction at protonated or deprotonated functional groups on solid surface [25]. In our study, although the thermodynamic free energy of adsorption as given by Equation (1) is additive, we would simply test our modeling by restricting ourselves to the electrostatic component. The results obtained from Scanning Electron Microscopy (SEM) and X-ray diffraction technique showed that tested samples of sandstones contain 3–12% clay minerals [26]. In our study, we assume that LSWF takes place in a sandstone oil reservoir with negligible percentage of clays, consistent with the finding of Kamal, et al. [26], regarding a low percentage such as 3. Therefore, ion bridging where only quartz is indicated will be adopted in our model.
Accordingly, we considered a sandstone oil reservoir under LSWF, where the subsurface temperature is 45 degrees Celsius. Specifically, we considered silica as the major component of sandstone oil reservoir and carried out thermodynamic calculations, using Equation (10). Wei, et al. [27] have demonstrated experimentally that the optimum salinity for sodium chloride brine for LSWF is from 1000 pm to 500ppm. We used salinities in this range. In addition, we also used higher salinities 2 M, 3 M and 4 M to compare our results. To obtain the surface coverage, we regarded delta z in Equation (2) as a change in charge (+) following the adsorption of hydrogen ions on quartz surface.
Results and Discussion
In our work, we assume aqueous pH is increased partly by dilution [28] and partly by hydrogen ion adsorption from the bulk [7]. The electrostatic Gibbs free energy of adsorption as given in Equation (2) has a unit of J per mole. However, based on our derivation, Equation (9) for the Gibbs free energy has a unit of J/cm2, consistent with the calculation of the thermodynamic free energy of formation the electric double layer elsewhere [29], which has the same unit. In this regard, we have theoretically obtained a different unit from an original one. Figure 1 shows variation of the degree of ionization with pH of aqueous solution, where increase in pH results in increase in ionization of surface Silanol. We assume an ideal case where there is no departure from the ideality due to the signature of electrostatic interactions between charged species involved in the system [30]. Figure 2 shows a plot of surface coverage of hydrogen ions as a function of pH, where coverage is seen to increase with decreasing salinity. This trend is also revealed in Figure 3 using optimum salinity ranges in accordance with Wei, et al. [27] recommended salinity range. In the optimum salinity range, 0.017 M and 0.086 M correspond to 1000 ppm and 5000 ppm respectively based on Wei et al. [27] recommendation for sodium chloride brine.
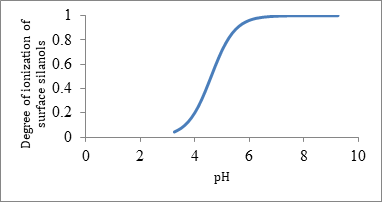
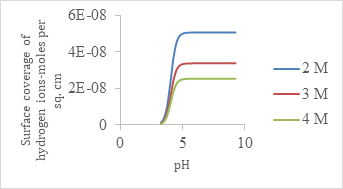
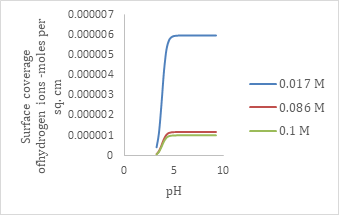
Figure 4 shows a plot of Gibbs free energy of adsorption as a function of pH for optimum concentrations where decreasing salinity results in decreasing Gibb free energy. It is interesting to note that both the lower and upper limit optimum concentrations in accordance with Wei, et al. [27] appear to merge at lower free energy of adsorption compared to 0.1 M outside the optimum range.
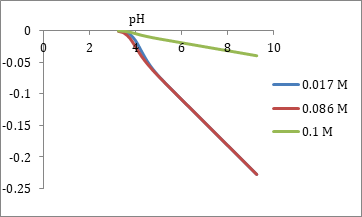
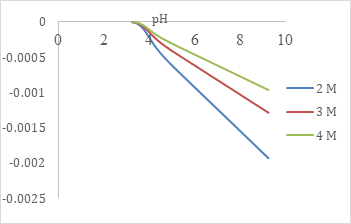
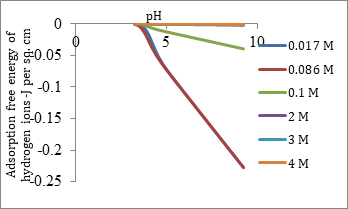
Figure 5 is for higher salinity range for a similar plot also shows consistent decrease in Gibb free energy of adsorption with decrease salinity, while Figure 6 shows a combined plot of free energy of adsorption with increasing salinity. Accordingly, the figure sums up the theoretical observations of all free energy plots. Figure 4, Figure 5 and Figure 6 were obtained using the pH and salinity dependent Gibb’s free energy of adsorption equation (Equation (10)).
The feasibility of a thermodynamic reaction is judged by its Gibbs free energy, where lower free energies favor reactions. In this study, we have used an existing thermodynamic model for adsorption free energy to develop a pH and salinity dependent adsorption onto a silica surface where hydrogen ions are the adsorbate. Our intent is to prove the hypothesis that part of pH increase in LSWF is due to hydrogen ion adsorption as reported in the literature.
Conclusion
- In all our calculations, the Gibbs free energy of adsorption decreases with decreasing salinity.
- Decrease free energy of adsorption with salinity decrease due to hydrogen ions adsorption implies contact angle decreases and wettability increases,
- Our free energy calculations show that sodium chloride concentration from 0.017 M to 0.086 M corresponding to 1000 ppm and 5000 ppm respectively as recommended by Wei, et al. [27] gave the most favorable condition for hydrogen ions adsorption and, therefore, better pH increase, which translates to better wetting conditions.
- Our finding is further supported by Snosy, et al. [31] who agreed that a moderate average concentration of 3000 ppm gives a relatively better incremental oil recovery.
Ideally, 5000 ppm in our case is reasonable, given that an average 5000 ppm is recommended by Snosy, et al. [31].
Acknowledgements
We greatly acknowledge the support of Cape Breton University Research office for its continuous support in our research work. The support of the University library services facilitated the timely acquisition of literature materials that were essential for the timely completion of this manuscript.
References
-
Ben-Mahmud H, Arumugam S, Mahmud W (2019) Potential of Low-Salinity Waterflooding Technology to Improve Oil Recovery. Intech Open pp: 1-120.
-
Riley R, Harper J, Harrison W, Barnes D, Nuttall B, et al. (2005-2010). Evaluation of CO2-Enhanced oil recovery and sequestration opportunities in oil and gas fields in the MRCSP region. MRCSP Phase II Topical Report, DOE- NETL Cooperative Agreement DE-FC26-05NT42589, DOE.
-
Morrow NR (1990) Wettability and Its Effect on Oil Recovery. J Pet Technol 42(12): 1476-1484.
-
Katende A, Sagala F (2019) A critical review of low salinity water flooding: Mechanism, laboratory and field application. Journal of Molecular Liquids 278: 627-649.
-
Xie Q, Sari A, Pu W, Chen Y, Brady PV, et al. (2018) pH effect on wettability of oil/brine/carbonate system: Implications for low salinity water flooding. Journal of Petroleum Science and Engineering 168: 419-425.
-
Aziz R, Joekar-Niasar V, Martínez-Ferrer PJ, Godinez- Brizuela OE, Theodoropoulos C, et al. (2019) Novel insights into pore-scale dynamics of wettability alteration during low salinity waterflooding. Scientific Reports 9: 9257.
-
Austad T, RezaeiDoust A, Puntervold T (2010) Chemical Mechanism of Low Salinity Water Flooding in Sandstone Reservoirs. SPE Improved Oil Recovery Symposium, Tulsa, Oklahoma, USA.
-
Chen Y, Xie Q, Pu W, Saeedi A (2018) Drivers of pH increase and implications for low salinity effect in sandstone. Fuels 218: 112-117.
-
Lee JH, Sang K (2019) Geochemical evaluation of low salinity hot water injection to enhance heavy oil recovery from carbonate reservoirs. Petroleum Science 16: 366- 381.
-
Perit E, Domaros MV, Kirchner B, Ludwig R, Weinhold F (2017) Predicting the Ionic Product of Water Sci Rep 7: 1-10.
-
Werner Stumm BW, Wieland E (1987) Surface Complexation and Its Impact on Geochemical. CCACAA 60(3): 429-456.
-
Koretsky CM (2000) The significance of surface complexation reactions in hydrologic systems: A geochemist’s perspective. Journal of Hydrology 230(3- 4): 127-171.
-
Morel FM, Hering JG (1993) Principles and Applications of Aquatic Chemistry. John Wiley & Sons Inc, New York, USA.
-
Malin JN, Holland JG, Geiger FM (2009) Free Energy Relationships in the Electric Double Layer and Alkali Earth Speciation at the. J Phys Chem C 113(41): 17795- 17802.
-
Biesheuvel PM (2004) Electrostatic free energy of interacting ionizable double layers. Journal of Colloid and Interface Science 275(2): 514-522.
-
Glover PW, Meredith PG, Sammonds PR, Murrell SA (1994) Ionic surface electrical conductivity in sandstone. Journal of Geophysical Research 99(B11): 21635-21650.
-
Hal RV, Eijkel J, Bergveld P (1996) A general model to describe the electrostatic potential at electrolyte oxide interfaces. Advances in Colloid and Interface Science 69(1-3): 31-62.
-
Amadu M, Adango M (2017) Determination of the Point of Zero Charge pH of Borosilicate Glass Surface Using Capillary Imbibition Method. International Journal of Chemistry 9(3): 67-84.
-
Kosmulski M (2020) The pH dependent surface charging and points of zero charge. VIII. Update. Advances in Colloid and Interface Science 251: 115-138.
-
Gomes MT, Oliveira MM, Fonseca MA, Oliveira JA (2004) An Expeditious Experiment To Determine the Faraday Constant. J Chem Educ 81(1): 116.
-
Gallas JP, Goupil JM, Vimont A, Lavalley JC, Gil B, et al. (2009) Quantification of Water and Silanol Species on Various Silicas by Coupling IR Spectroscopy and in-Situ Thermogravimetry. Langmuir 25(10): 5825-5834.
-
Clouter A, Brown D, Höhr D, Borm P, Donaldson K (2001) Inflammatory effects of respirable quartz collected in workplaces versus standard DQ12 quartz: Particle surface correlates. Toxicol Sci 63(1): 90-98.
-
Sulpizi M, Gaigeot MP, Spri M (2012) The Silica-Water Interface: How the Silanols Determine the Surface Acidity and Modulate the Water Properties. J Chem Theory Comput 8(3): 1037-1044.
-
Fischer J (2019) The Boltzmann Constant for the Definition and Realizationof the Kelvin. Ann Phys 531(5): 1-12.
-
Li Y, He J, Zhang K, Liu T, Hu Y, et al. (2019) Super rapid removal of copper, cadmium and lead ions from water by NTA-silica gel†. RSC Adv 9: 397-407.
-
Kamal MS, Mahmoud M, Hanfi M, Elkatatny S, Hussein I (2019) Clay minerals damage quantification in sandstone rocks using core. Journal of Petroleum Exploration and Production Technology 9: 593-603.
-
Wei X, Zhang Y, Jiang W, Wang Z, Li X, et al. (2020) Experimental Investigation on the Role of Clays in Low Salinity Water Flooding. Front Energy Res 8: 1-10.
-
Chen Y, Ubaidah A, Elakneswaran Y, Niasar VJ, Xie Q (2020) Detecting pH and Ca2+increase during low salinity waterflooding incarbonate reservoirs: Implications for wettability alteration process. Journal of Molecular Liquids 317.
-
Chan DY, Mitchell DJ (1983) The Free Energy of an Electrical Double Layer. Journal of Colloid and Interface Science 95(1): 193-197.
-
Delhorme M, Labbez C, Caillet C, Thomas F (2010) Acid- Base Properties of 2:1 Clays. I. Modeling the Role of Electrostatics. Langmuir 26(12): 9240-9249.
-
Snosy MF, Ela MA, El Banbi A, Sayyouh H (2019) Comprehensive investigation of low-salinity water flooding in sandstone reservoirs. Journal of Petroleum Exploration and Production Technology 10: 2019-2034.
- Nigeria’s Vulnerability in the Face of Global Energy Policy
- A Simulation Study of Investigation of Optimum Oil Production Performance by Applying Various Gas Injection Methods in Oil Reservoir
- Characterization of Permo-Triassic Reservoirs through Thermal Maturity Assessment of Westphalian Source Rocks in the Cheshire Basin
- Influence of Microwax on the Rheological and Thermal Behaviour of a Wax Crude Oil
- Real-Time Monitoring and Performance Optimization of Steam Injection in Heavy Oil Reservoirs Using Fiber Optic Sensing and Integrated Predictive Simulation Models
- Rapid On-Site Determination of the Total Petroleum Hydrocarbon Content of Soils by Handheld Fourier Transform Near-Infrared Spectroscopy: Development of a Global, Site- and Scanner- Independent Calibration Model