Visualization of Spreading and Non-Spreading Oil Films in Gas-Assisted Gravity Drainage (GAGD) Process Using Novel NOA81 Microfluidic Platform
The presence of oil films in three phase flow of oil, water and gas through reservoir rocks has a significant effect on the recovery efficiency associated with various Enhanced Oil Recovery (EOR) processes like Water Alternating Gas (WAG) and Gas-Assisted Graviry Drainage (GAGD). Visualization of these oil films helps in having a better understanding of the conditions required for the formation of such films in a rock pore network. In this work, we have used a microfluidic platform consisting of Norland Optic Adhesives-81(NOA81) that better mimics the reservoir rock pore geometry, to visualize the oil films in different spreading systems. NOA81 is a transparent polymer with high chemical and physical resistance, which enabled the device to withstand harsh organic solvents as well as high pressures and temperatures encountered in the EOR experiments. This device was designed with pore network similar to that of a consolidated water wet porous rock with varying channel widths and taper, unlike various other platforms using regular square or constant channel width grids. This modification resulted in a more realistic representation of the actual pore network of reservoir rocks. Continuous thinner oil films were observed in the positive spreading system, whereas discontinuous trapped oil blobs were encountered in the negative spreading system. Statistical analysis carried out on the thickness of the oil phase separating water and gas phases indicated significant differences and confirmed the visual observations.
Introduction
Water, oil and gas coexist in almost all conventional oil reservoirs, especially in the depleted reservoirs, i.e. those that have been produced through the primary or secondary stages using either the natural drive energy or flooded water. In these depleted reservoirs during application of gas injection Enhanced Oil Recovery (EOR) processes like Water Alternating Gas (WAG) and Gas-Assisted Graviry Drainage (GAGD), gas is injected into the reservoir to displace the remaining oil. In the GAGD process, gas is injected at the top of the reservoir pay-zone, which pushes the existing fluids downward to be produced by horizontal well(s) positioned at the bottom of the oil-zone in the reservoir [1]. In this condition, all three fluid phases, viz. gas, oil and water flow through the porous rock of the reservoir. Fluid distribution in the rock pores is best treated in terms of what is referred to as the spreading coefficient [2]. The oil spreading coefficient is defined as a function of the interfacial tensions between each pair of the three co-existing phases. The coefficient is defined as:
o wg ow og S σ σ σ = − −
Where , wg σ , ow σ and og σ are gas-water, oil-water, and oil-gas interfacial tensions respectively. The numerical value of this parameter can be either positive or negative depending on the pressure, temperature and fluids’ compositions in the system. The spreading parameter for the non-equilibrium situation is the energy gained when covering one-unit area of water with a flat oil film of macroscopic thickness. When the spreading coefficient is positive, oil is expected to spread over the water thereby preventing water-gas contact, whereas a negative spreading coefficient reduces the chance of oil spreading over the water [3, 4, 5, 6].
Effects on recovery efficiency of the GAGD process through film formation has traditionally been studied through flooding reservoir cores or sandpacks. However, one primary drawback of these conventional approaches is that they are not amenable to direct visualization that is accorded using microfluidic devices. Formation of films can only be indirectly inferred in core flooding and thus suffers from a lack of visualization, uncertainty about wettability condition, and non-consistency with the in-situ rocks. Sand pack models offer a higher degree of visualization compared to corefloods because the sandpack is encapsulated in a glass compartment; but the observed interface in the sand pack models are not reliable. The pore volume between sand grains and glass walls could be larger compared to that between grains, which may cause a change in fluid flow regime. The bigger pores close to the glass walls become conduits for injected fluids and the observed interface may not represent the location of the interface in the model.
Micromodels are thus an efficient way to perform such analyses and have opened a new venue to address the limitations of traditional methods. Pore networks are relatively easy to design and fabricate so as to mimic rock conditions. Identical devices can be used in parallel to study different conditions using the exact same patterns, without needing to measure porosity or pore volume in each experiment. The surface treatment is easy to apply and is already established in the literature. The experiments can be performed with very small amounts of fluids, and the duration for each experiment usually does not exceed a few minutes [7, 8, 9].
In this work, a microfluidics platform was developed for visualizing and studying three-phase flow in porous media. The device, which was fabricated using Norland Optic Adhesives (NOA81) was used due to its compatibility with organic solvents. The pore network was designed to represent sandstone reservoirs, to study EOR by GAGD process in positive and negative oil spreading coefficient conditions.
Methodology
Methodology involved firstly the construction of the microfluidics platform using NOA81 and then carrying out microfluidic experimentation to elucidate the displacement characteristics of the three fluid phases, namely gas, oil and water under GAGD operation. Figure 1 shows the realistic pore network of the device mimicking a sandstone reservoir. Figure 2 shows pictorially the various construction steps involved in NOA81 device fabrication. Here only an abridged version of the construction steps is given for following the work. The details of the NOA81 device construction can be found elsewhere [10].
The device design built upon similar design by Wu, et al. [9] and Kenzhekhanov [11] to more closely resemble real- world conditions by varying channel widths from 15-50 um. Using Voronoi built in function in MATLAB, channel widths were randomized with added complexity. A series of micro filters (10 um spacing) were added after the inlet and before the outlet to prevent clogging. The fluid network was then imported to AutoCAD to finalize the device design. Based on the final design, a chrome mask for making silicon wafer master was then purchased. In the chrome mask the channels were opaque, which prevented cross-linking of photo-resist material on exposure to UV light.
To microfabricate the silicon wafer master, a 4” silicon wafer was baked, followed by cleaning of its top surface for sputtering a photoresist layer. Upon applying the photoresist layer, the silicon master was further baked to stabilize the photoresist layer. The chrome mask was then placed on the silicon master and it was exposed to UV light for cross- linking the photoresist. Upon exposure, the photoresist layer was baked again, followed by washing away of the non- cross-linked (unexposed areas) photoresist material using a developer solution.
After making the silicon master, Polydimethylsiloxane (PDMS) replicas of the same were generated to make sacrificial mold for the NOA81 devices. This was done to avoid damaging the silicon master itself, so that it could be used repeatedly. To put things into context, normally, microfluidic devices are made of PDMS, unlike ours. For making PDMS replicas, PDMS was mixed with a hardener and was poured on the silicon wafer in a petridish and was baked to allow curing of the PDMS. After the PDMS was cured, it was peeled off the silicon wafer master. The fluid channels left a positive impression on the PDMS replica. To make inlet and outlet ports, holes were punched at both ends. In addition to the above PDMS replica of the fluidic channels, a second PDMS slab was also made and a rectangle was cut out to shape walls around the device, as illustrated in Figure 2B. The purpose of this second PDMS cast was to avoid cutting off stiff NOA81 mold for separating NOA81 replicas.
Next, the PDMS cast was attached to the first PDMS
replica to get a mold with the pore network patterns at the bottom. The PDMS mold was then used to make NOA81 replicas. In order to attach the two PDMS pieces, PDMS replica was placed first and then the cast was positioned over it in such a way that the hollow part of it fitted the part of the replica with the patterns. Then a small amount of uncured PDMS was applied around the edges and between two PDMS pieces to act as a glue. The cast and replica were thus stuck on each other and baked for the pieces to bond together. PDMS mold was then ready for NOA81 device fabrication.
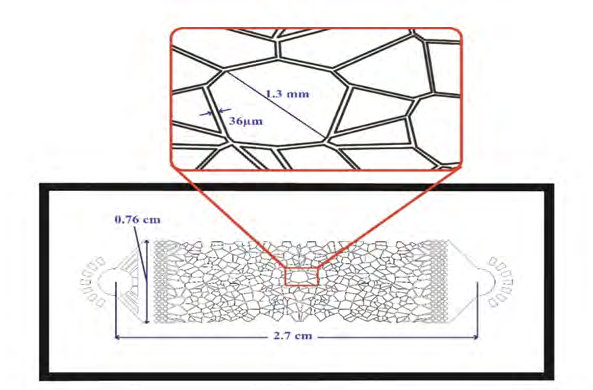
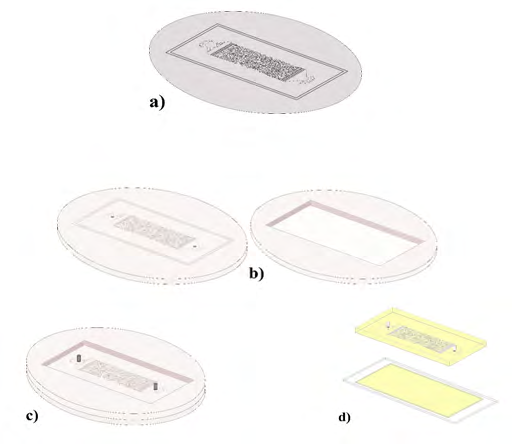
Figure 2: a) A silicon wafer with etched patterns on it. b) PDMS master with holes in inlet and outlet and a piece of PDMS with a rectangular cut in the middle c) complete PDMS master with tubing in the inlet and outlet holes d) cured NOA81 device with pattern and cured thin NOA81 Layer on a glass slide Prior to the fabrication of the NOA81 replicas, two pieces of tubing of appropriate sizes were cut and placed into the inlet/outlet ports in the PDMS master to prevent NOA81 from getting into the holes while pouring the NOA81. NOA81 was then poured on the channels in the PDMS mold, taking care to avoid filling in the inlet and outlet holes (Figure 2C). The PDMS replicas filled with the NOA81 was cured by UV exposure. After the NOA81 was cured, it was peeled off of the PDMS master, which left a negative relief of the patterns imprinted into the NOA81 (Figure 2D).
Another thin layer of NOA81 was cured by placing a few drops on a glass slide and spreading it before exposing to UV light. Then the two cured NOA81 pieces were plasma bonded to each other to create fluid-tight channels to use for experimentation (Figure 2D). This step was needed due to different wettability characteristics of the glass slide and of NOA81 to water and oil. In other words, this step was crucial for achieving consistent wettability properties throughout the device and avoiding potential irregularities. This step was previously described by Kenzhekhanov [11]. To ensure the stability of the plasma bonds, a waiting time of at least six hours was needed after plasma bonding before any flow injection.
Upon construction of the device, functional testing of the device was done to make sure that there were no leakages. Once device integrity was confirmed through the functional test, the displacement experiments were then carried out. Functionality testing and displacement experiments are described in the following sections.
Functionality Check of the Microfluidic NOA81 Device
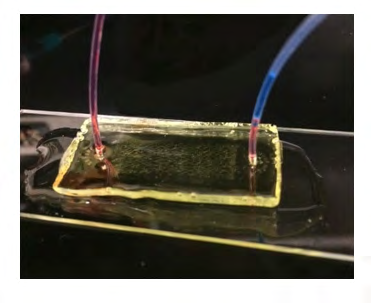
First the integrity check of the constructed NOA81 device was carried out by injecting fluids into the device. For that tubings were connected to both inlet and outlet ports and fluids were manually injected into the device using a 10 ml syringe and a 23-gauge needle. Initially, water (dyed blue) was injected to confirm that the device was fluid tight, and the plasma bonding was holding. Water was observed to enter and exit the device without any leakage. Decane (dyed red), the oil phase, was then introduced likewise into the device to displace the water that was injected in the previous step. Decane was able to displace most of the water, however, some residual water got left behind in the device. Here again, no leakage was seen from the device as illustrated in Figure 3. Thus, the integrity of the bonding and device sealing was confirmed in the presence of both water and oil phases. It illustrated that the bonding scheme was proper for the device and could be relied on to withstand the injected phases. Figure 4 shows the three phases present in the microfluidic device.
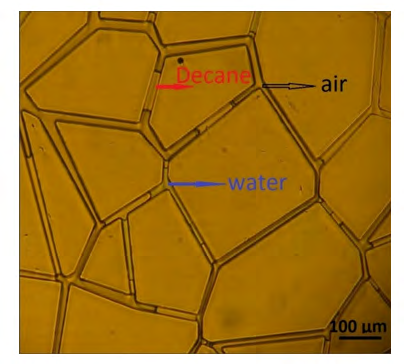
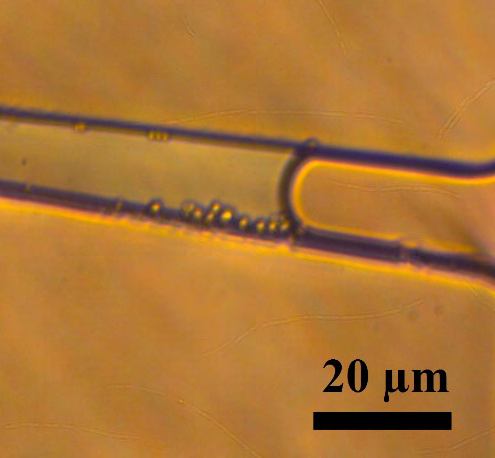
As was expected, the procedure followed in making the microfluidic device, resulted in water-wet channel walls, which can be seen from the curvature of the oil-water interface and the resulting low contact angles. Although NOA81 is weakly hydrophilic, the plasma bonding process makes it water wet [12, 11] as seen in Figure 5.
The success of this step ensured that the device was fully functional with no observable leakage and operational challenges.
Film Flow Experiments in Spreading and Non- Spreading System
Upon functionality check of the constructed NOA81 microfluidic device, it was then used to visualize the interactions between the three fluid phases, namely, air, water, and oil. Experiments were run in both positive and negative spreading systems and differences in flow and spreading behavior were observed visually. The thickness of the oil phase separating gaseous and aqueous phases was measured and compared between positive and negative spreading systems. Statistical technique was used to ascertain if there was a significant difference in the thickness of the phase, indicating the presence of oil films between air and water phases in the systems.
In order to create positive and negative spreading systems, Soltrol and Decane were used respectively. The table below shows the interfacial tensions and oil spreading coefficients in both systems as reported by Oren and Pinzewski, and Goebel and Lunkenheimer [6, 13, 14] and many others (Table 1).
| ó (dyn cm) ow | ó (dyn cm) wg | ó (dyn cm) go | S (dyn cm) o | |
|---|---|---|---|---|
| Soltrol | 32.6 | 73.3 | 23 | 17.7 |
| Decane | 53.2 | 73.3 | 23.7 | -3.6 |
Table 1: Interfacial tensions and oil spreading coefficient between fluids used in experiments.
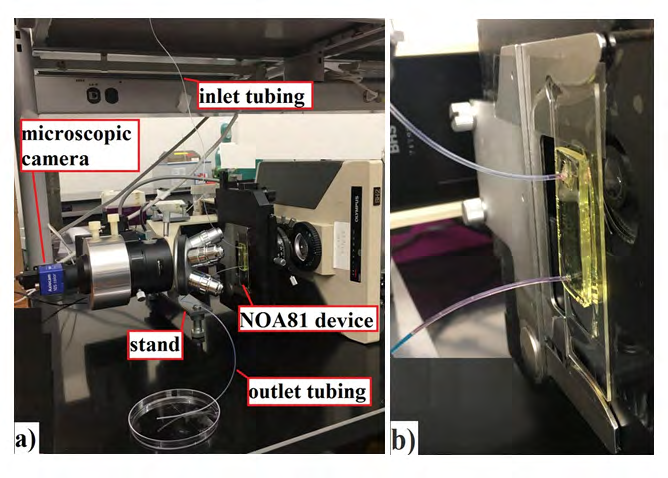
The device was located vertically on an inverted microscope to simulate the GAGD process. The microscope was inverted 90 degrees and stabilized using a custom-made mount. As is shown in Figure 6, the gas inlet of the device was located at the top, and the outlet was at the bottom, so that gravity was able to drive the fluid flow in the channels. The device was fixed on the microscope and inlet and outlet tubings were attached to the shelf and table respectively to avoid unexpected movements and disjoints. Fluids were injected into the tubing using 10 mL syringes and a needle.
In order to make the fluids more distinguishable in the microscopic images, water and oil were dyed. For water, blue food dye was used and for the oils - Soltrol and Decane, Sudan IV, which is an organic red dye was used.
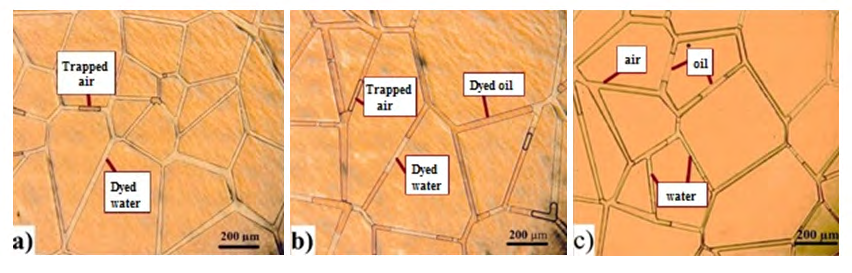
To mimic the reservoir fluids distribution, first water was injected into the channels, which occupied all the pore space, except places where air was trapped (Figure 7a). Then oil was injected to displace the water. After this step, all the three phases were present in the pore space, but the amount of air was very low and hence there was very little chance of observing all the three phases in the same pore (Figure 7b). Next air was injected as a secondary gas flood without any preceding water flood (Figure 7c). The reason for skipping the water flood step was to not lose the chance of observing all the three phases at the same location. All the injections were made manually by hand and there was no pressure or rate constraint at the inlet.
Results and Discussion
Apart from representing a more realistic reservoir porous network, the designed depths of channels (10 µm) facilitated capturing the interface of gas phase and liquid phase. Higher channel depths lead to higher curved interfaces between gas and liquid due to the relatively low interfacial tension of the gas against oil and water. On the other hand, much lower thickness devices have limitation in terms of distinguishing the different phases. Because of reduced thickness, the concentration of the dye also decreases and thus the color intensity of the liquids decreases. But in our designed 10 µm thick micro-channels, the color remained sufficiently distinguishable. The aqueous phase had a blue color tone and could easily be identified from the other two phases. The gaseous phase was not dyed and its color was grayish. The gaseous phase could be located by its thick boundaries due to the high curvature of its interfaces with liquids. The oil phase had a diluted red color tone and could be similarly distinguished from the other two phases. The microscopic lamp emitted a warm light and that slightly faded the red color of the oil, even though it was fairly distinguishable.
Negative Oil Spreading Coefficient
As illustrated in Table 1, the water, decane and air system had a negative spreading coefficient. Water, decane, and air were injected into the device to examine the three-phase displacement process and the occurrence of oil films in case of a negative spreading system. Previously Keller, et al. [15] had showed that there could exist a stable decane oil layer spreading over water, even when the spreading coefficient is negative. Zhou and Blunt [16] also theoretically proved that generation of oil films is possible in negative spreading coefficient, but it is much rarer than in positive spreading systems. They had also pointed out that the pore geometry plays a pivotal role in the generation of oil films. Work of Oren, et al. [13] also showed the presence of oil films, even though it was not as continuous as in the positive spreading system.
In the series of experiments using the NOA81 microfluidic device, some oil droplets were observed that were separating air and water. These oil drops were mostly by-passed oils and were not considered as oil films. Figure 8 shows the process of air intrusion and the oil droplets that were left behind in two channels. The oil droplets were separating aqueous and gaseous phases, but that should not be confused with oil films, although Keller, et al. [15] has shown existence of stable oil films in negative spreading systems. The pore network in their work was, however, starkly different in terms of porosity. Their porosity was much higher than the current device and relatively bigger pores were close to each other. This could have decreased the chance of retraction of oil films in case they were generated. On the other hand, in the current device, the pore volume consisted of long and narrow channels, which increased the chance of retraction of potential oil films. Also, another observation affirmed that the separating oil droplets were indeed trapped oil. As the gaseous phase pressure was increased, trapped oil drops contracted and they again expanded as soon as the pressure was released. Interestingly, however, they never vanished and the pressure increase did not cause movement of the trapped oil droplets. This indicated that the oil droplets were not connected to other oil bodies.
The most common drainage mechanism observed in this system was two-phase displacement. Figure 8 shows the displacement of oil by air while aqueous phase was largely immobile.
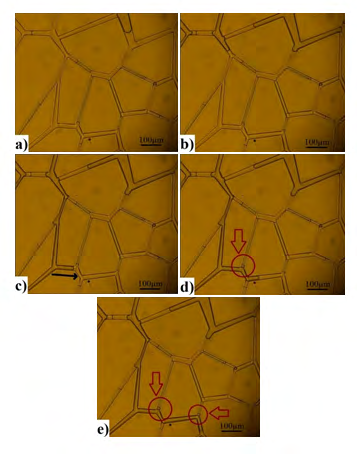
Figure 8: These pictures are taken in five-time steps at the same location in the microchannel to show generation of trapped oil in the system (a) gas entering the channels, (b) gas flowing and pushing existing fluids downwards, (c) gas finding the path of least resistance and flowing downward, and (d, e) bypassing oil droplets termed as trapped oil.
This phenomenon led to trapping of oil in some parts of pore network; also called oil bank, which causes a decrease in oil recovery. This contrasts with the double drainage mechanism in which injected gaseous phase displaces the oleic phase and which in turn displaces the aqueous phase. This was the predominant mechanism responsible for water production in the work of Oren, et al. [13], even though it was less pronounced in the negative spreading case compared to positive one. However, in our current work it was not observed to be a dominant mechanism and most of the water were bypassed and remained trapped, probably because it had remained in the smaller diameter pores (the system being water-wet) post the first drainage event when oil phase drained the model that was initially saturated with water. Thus, the pore network geometry appears to have a sizable impact in the displacement process.
Positive Oil Spreading Coefficient
The soltrol-water-air system had a positive spreading coefficient (as shown in Table 1). A positive spreading coefficient meant that oil would spread over the water surface, so as not to allow direct contact between the gaseous and aqueous phases. It is a favored configuration thermodynamically due to lowering of the interfacial tension of the system. According to Zhou and Blunt [16], this system has a zero equilibrium spreading coefficient which causes the most stable oil films. Although the films are sometimes so thin (0.1~5 nm) that they cannot be seen directly, but their existence could be inferred from their manifestation. This spreading of oil also facilitates oil flow and consequently, higher oil recoveries [17].
The same phenomenon shown in Figure 8, which causes trapped oil droplets, occurred in the positive spreading system as well. The difference is that when pressure was applied on the inlet by injecting gas, the oil drops contracted until they vanished. This is an indication of the existence of oil films that act like conduits for oil drops to flow and also help them to join the larger oil blobs. In other words, oil films make the oil phase one single continuous phase which would lead to increase in oil recovery.
Figure 9a shows the existence of such thin oil films. Figure 9b on the other hand shows that direct contact is possible between gaseous and aqueous phase even in positive spreading system.
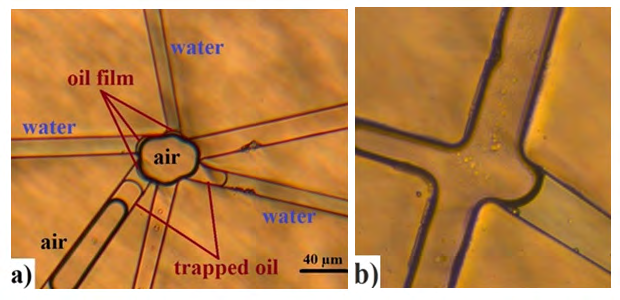
Although the microscopic pictures have shown many thin oil layers (similar to three thin oil layers shown in Figure 9a) and microfluidic studies have shown the existence of the films [15], the oil films were not observed between gaseous and aqueous phases everywhere in the positive oil spreading system. For instance, direct gas-water contact was seen as in Figure 9b. This contact is made possible because of zero oil saturation in the location where gas first encountered the aqueous phase. This can be further explained considering, initially, three different phases were present at the same location. If gas is now introduced to a pore, which is saturated with water and oil saturation is zero, no oil film would be observed. Theoretically, the formation of oil films is still possible in these cases, but the thickness would be extremely small, not more than a few molecular diameters, which was not possible to be captured with our current microscopic equipment. Oren, et al. [13] also observed initial gas-water contact when gas was first introduced into the system, but this film got quickly drained out to spread a continuous oil film that separated the aquesous phase everywhere in the sytem. In our device, however, this event was not observed and this may be partly because of shallower depth of our device compared to that of Oren, et al [13]. In their work, they visualized gas encapsulation over their pore network because oil could easily spread over water and coat the aqueous phase. Also, they observed thin water layers attached to the glass walls due to strong hydrophilicity of the surface. On the other hand, observations in the NOA81 device were different. The connection of oil films to each other and bigger oil bodies are not directly observed; although, their presence is proved when pressure is increased, and they coalesce. Also, the thin wetting phase is not directly seen although hydrophilicity of the walls can be seen from the water-oil interface curvature (Figure 9b). The differences in such observations is caused by pore geometry and specifically the pore size. The glass micromodel used in Oren, et al. study had a range of 100-500 µm pore throats and pore bodies which is 10 times larger than pore sizes in the NOA81 device used in this study. Also, the channels in the NOA81 device were longer and narrower which made the oil films thinner.
Comparison between Spreading and Non- Spreading Oil Systems
In order to distinguish trapped oil vs. oil film, the thickness of each oil blob was measured using microscopic pictures. Then to standardize the measurements, the thicknesses were divided by the channel width in which they existed, to get dimensionless thicknesses. These dimensionless thicknesses were then used for statistical analysis. Using dimensional thicknesses would have been misleading due to the heterogeneity in the width of the channels. Table 2 & 3 shows the measurements of the oil phase thicknesses separating air and water observed in microscopic pictures for both systems.
To be able to distinguish between oil films (which were more stable in positive spreading systems) and trapped oil a statistical analysis was conducted. Although, the differences in average dimensionless thicknesses seem significant, their distribution needed to be compared. To test the hypothesis whether dimensionless thicknesses in the two systems were significantly different or not, the Mann–Whitney– Wilcoxon (MWW) [18] method was used. The advantage of the MWW method to other statistical methods was that MWW method did not require a normal distribution of the samples for testing. This method compares two random samples and reports a P-value whether the samples are from two significantly different populations or not. In other words, if the P-value is larger than 0.01, the populations are not different, whereas P-values smaller than 0.01 indicate that the populations are significantly different. To conduct the MWW method, dimensionless thicknesses were fed to the R programming language and the Wilcox test function was used. The P-value reported by this analysis is 0.0029, which indicated significant difference in the thickness of oil droplets/layers in positive and negative systems.
| Oil Phase Thickness (µm) | Channel Width (µm) | Dimensionless Thickness |
|---|---|---|
| 2.43 | 25.58 | 0.01 |
| 4.12 | 30.2 | 0.14 |
| 5.83 | 40.51 | 0.14 |
| 6.15 | 40.7 | 0.15 |
| 5.91 | 36.43 | 0.16 |
| 3.13 | 18.29 | 0.17 |
| 4.08 | 23.48 | 0.17 |
| 7.21 | 35.51 | 0.2 |
| 5.94 | 20.51 | 0.29 |
| 6.26 | 20.46 | 0.31 |
| 15.83 | 49.91 | 0.32 |
| 13.39 | 37 | 0.36 |
| 12.73 | 31.91 | 0.4 |
| 19.36 | 30.31 | 0.64 |
| 9.46 | 14.12 | 0.67 |
| 15.9 | 17.84 | 0.89 |
| 6.76 | 7.14 | 0.95 |
| 11.47 | 11.33 | 1.01 |
| 17.84 | 16.87 | 1.06 |
| 48.83 | 45.22 | 1.08 |
| 41.01 | 35.36 | 1.16 |
| 57.94 | 38.08 | 1.52 |
| 31.1 | 18.63 | 1.67 |
| Average | 0.59 | |
| 19.53 | 26.58 | 0.73 |
| 22.36 | 30.21 | 0.73 |
| 29.15 | 36.91 | 0.78 |
| 31.32 | 36.91 | 0.82 |
| 21.21 | 24.75 | 0.84 |
| 27.04 | 30.21 | 0.9 |
| 41.23 | 45.07 | 0.91 |
| 28.28 | 24.75 | 1.12 |
| 30.1 | 24.75 | 1.25 |
| 58.52 | 45.96 | 1.26 |
| 26.58 | 21.51 | 1.29 |
| 31.32 | 23.05 | 1.35 |
| 35.09 | 25.12 | 1.4 |
| 25.5 | 15.81 | 1.56 |
| Average | 1.07 |
Table 2: Thickness measurements for positive oil spreading coefficient.
Thus, it is further confirmation that continuous oil films that facilitate oil movement across the system to connect dispersed oil blobs to be further produced are absent in negative spreading systems. Shallow depths and smaller sizes of the channels facilitated such visualization thus enhancing our understanding of the three-phase flow and oil film formation and stability in porous reservoir rocks.
Summary and Conclusions
- Using novel microfluidic platform NOA81, three phase flow experiments were carried out to elucidate film formations in GAGD process in both spreading and non- spreading systems. The designed novel NOA81 platform was much more representative of a conventional oil reservoir in contrast to common usage of regular square networks. This framework also has higher chemical and physical resistance, making it amenable to higher pressures and temperatures as well as various chemical species encountered in EOR experiments.
- Device integrity and its functionality were successfully demonstrated in the presence of different hydrocarbons- soltrol and decane, along with water and air, while the device and microscope were mounted orthogonally to simulate GAGD oil recovery process.
- Film thickness of oil spreading over water to separate the gas phase in the positive spreading system was significantly lower than that in the negative spreading system and also found to be continuous unlike the later. Statistical analysis carried out on the thickness of oil phase separating water and air showed significant differences in dimensionless thicknesses between the two spreading systems, thus indicating the existence of thinner oil films in the system with positive oil spreading coefficient. The continuous and lower oil film thicknesses in positive spreading systems have beneficial impact in terms of oil recovery.
- Drainage mechanisms were different in the two cases.
In the positive spreading system, double drainage was observed, but in case of negative spreading system, only two-phase displacements with gas displacing the oil phase was observed with the water phase remaining stagnant in the pores. This is attributed to lower depth and smaller sizes of the channels of the pore network offering increased resistance to flow of the wetting phase.
References
-
Rao DN, Ayirala SC, Kulkarni MM, Sharma AP (2004) Development of Gas Assisted Gravity Drainage (GAGD) Process for Improved Light Oil Recovery. SPE/DOE Symposium on Improved Oil Recovery, Tulsa, Oklahoma, USA.
-
Bautista EV, Meneses Barillas JL, Dutra TV, da Mata W (2014) Capillary, viscous and gravity forces in gas- assisted gravity drainage. Journal of Petroleum Science and Engineering 122: 754-760.
-
Kantzas A, Bryan J, Taheri S (1994) Fundamentals of Fluid Flow in Porous Media. PERM Inc.
-
Blunt MJ, Fenwick DH, Zhou D (1994) What Determines Residual Oil Saturation in Three-Phase Flow? SPE/DOE Improved Oil Recovery Symposium, Tulsa, Oklahoma, USA.
-
Oren PE, Billiotte J, Pinczewski WV (1992) Mobilization of Waterflood Residual Oil by Gas Injection for Water- Wet Conditions. SPE Form Eval 7(1): 70-78.
-
Øren PE, Pinczewski WV (1995) Fluid distribution and pore-scale displacement mechanisms in drainage dominated three-phase flow. Multiphase Flow in Porous Media, pp: 105-133.
-
Sinton D (2015) Microfluidics and Their Macro Applications for the Oil and Gas Industry. The Way Ahead 11(3): 8-10.
-
Ganzer L, Wegner J, Buchebner M (2014) Benefits and Opportunities of a “Rock-on-a-Chip” Approach to Access New Oil. Oil Gas-European Magazine 39: 43-47.
-
Wu M, Xiao F, Johnson-Paben RM, Retterer ST, Yin X, et al. (2012) Single- andTwo-Phase Flow in Microfluidic Porous Media Analogs Based on Voronoi Tessellation. Lab on a Chip 12(2): 253-261.
-
Sombolestani S (2018) Developing a Microfluidics Platform for Visualizing Oil-film Formation in Gas- Assisted Gravity Drainage (GAGD) Processes. Final Project, Craft & Hawkins department of Petroleum engineering, LSU, USA.
-
Shaken K (2016) Chemical EOR process visualization using NOA81 micromodels. Colorado School of Mines, ProQuest Dissertations Publishing, pp: 1-74.
-
Wägli P, Homsy A, de Rooij NF (2011) Norland optical adhesive (NOA81) microchannels with adjustable wetting behavior and high chemical resistance against a range of mid-infrared-transparent organic solvents. Sensors and Actuators B: Chemical 156(2): 994-1001.
-
Oren PE (1994) Pore-Scale Network Modelling of Waterflood Residual Oil Recovery by Immiscible Gas Flooding. SPE/DOE Improved Oil Recovery Symposium, Tulsa, Oklahoma, USA.
-
Goebel A, Lunkenheimer K (1997) Interfacial tension of the water/n-alkane interface. Langmuir 13(2): 369-372.
-
Keller AA, Blunt MJ, Roberts APV (1997) Micromodel Observation of the Role of Oil Layers in Three-Phase Flow. Transport in Porous Media 26: 277-297.
-
Zhou D, Blunt M (1997) Effect of spreading coefficient on the distribution of light non-aqueous phase liquid in the subsurface. Journal of Contaminant Hydrology 25(1-2): 1-19.
-
Al-Tameemi AAA (2019) An Experimental Study of Fractional Wettability Effects on Gas Assisted Gravity Drainage (GAGD). Craft & Hawkins Department of Petroleum Engineering, LSU Master’s Theses, USA.
-
Wilson LT (2009) Mann-Whitney U-Test.
- Nigeria’s Vulnerability in the Face of Global Energy Policy
- A Simulation Study of Investigation of Optimum Oil Production Performance by Applying Various Gas Injection Methods in Oil Reservoir
- Characterization of Permo-Triassic Reservoirs through Thermal Maturity Assessment of Westphalian Source Rocks in the Cheshire Basin
- Influence of Microwax on the Rheological and Thermal Behaviour of a Wax Crude Oil
- Real-Time Monitoring and Performance Optimization of Steam Injection in Heavy Oil Reservoirs Using Fiber Optic Sensing and Integrated Predictive Simulation Models
- Rapid On-Site Determination of the Total Petroleum Hydrocarbon Content of Soils by Handheld Fourier Transform Near-Infrared Spectroscopy: Development of a Global, Site- and Scanner- Independent Calibration Model